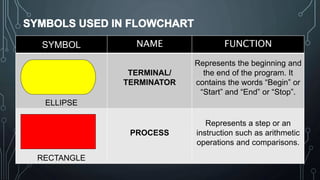
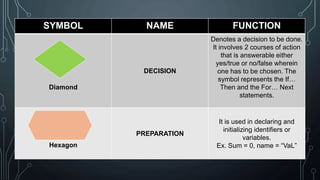
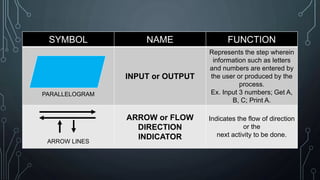
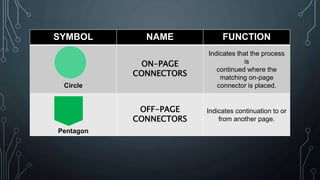
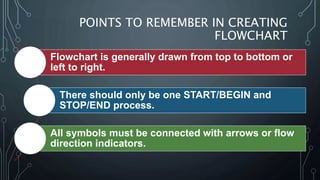
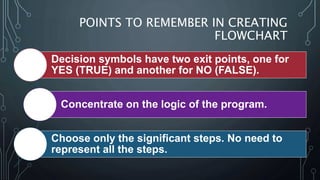
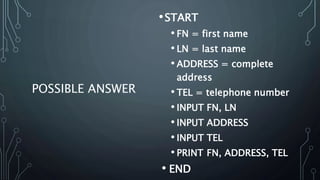
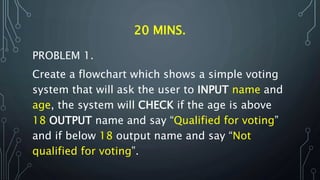
The document discusses programming as the process of creating instructions for computers, emphasizing the use of flowcharts as a tool for representing algorithms and logic visually. It describes various flowchart symbols along with their functions, and highlights best practices for creating effective flowcharts. Additionally, several problem-solving examples demonstrate how to generate flowcharts for specific programming tasks.
Introduces programming, defining it as a collection of instructions for computers to execute specific tasks.
Flowcharts are graphical representations of algorithms, using symbols to depict processes and decisions.Guidelines for designing flowcharts: directionality, starting/ending points, and the importance of logic.
Examples of programming tasks requiring user input and calculating results using flowcharts and pseudocode.
Definition of data, its forms, and its role in calculations and computations within programming.
Incorporation of pseudocode in addressing sample problems, demonstrating practical programming scenarios.
Tasks to create flowcharts for everyday scenarios like cooking and a voting system assessment.
List of references used for the presentation on flowcharts and programming concepts.
FLOWCHART
•It is thegraphical representation of an
algorithm. Flowchart is the pictorial
description of sequenced activities and logic
to be performed by the computer for
carrying out data
6.
FLOWCHART
•processing. It usesspecial symbols which
represent a specific function. It is used by
a programmer before the actual start of
any programming activity.
SYMBOL NAME FUNCTION
ELLIPSE
TERMINAL/
TERMINATOR
Representsthe beginning and
the end of the program. It
contains the words “Begin” or
“Start” and “End” or “Stop”.
RECTANGLE
PROCESS
Represents a step or an
instruction such as arithmetic
operations and comparisons.
9.
SYMBOL NAME FUNCTION
Diamond
DECISION
Denotesa decision to be done.
It involves 2 courses of action
that is answerable either
yes/true or no/false wherein
one has to be chosen. The
symbol represents the If…
Then and the For… Next
statements.
Hexagon
PREPARATION
It is used in declaring and
initializing identifiers or
variables.
Ex. Sum = 0, name = “VaL”
10.
SYMBOL NAME FUNCTION
PARALLELOGRAM
INPUTor OUTPUT
Represents the step wherein
information such as letters
and numbers are entered by
the user or produced by the
process.
Ex. Input 3 numbers; Get A,
B, C; Print A.
ARROW LINES
ARROW or FLOW
DIRECTION
INDICATOR
Indicates the flow of direction
or the
next activity to be done.
POINTS TO REMEMBERIN CREATING
FLOWCHART
Flowchart is generally drawn from top to bottom or
left to right.
There should only be one START/BEGIN and
STOP/END process.
All symbols must be connected with arrows or flow
direction indicators.
13.
POINTS TO REMEMBERIN CREATING
FLOWCHART
Decision symbols have two exit points, one for
YES (TRUE) and another for NO (FALSE).
Concentrate on the logic of the program.
Choose only the significant steps. No need to
represent all the steps.
14.
ADVANTAGES OF FLOWCHART
Theflow of program is easily understood.
It determines the validity of the processes involved in the program.
Debugging or correcting errors is less complicated.
It produces effective program documentation.
15.
PROBLEM 1.
Ask theuser to type in his/her complete
name, complete address and telephone
number. Generate a print out of the first
name, address and telephone number
only.
16.
POSSIBLE ANSWER
•START
• FN= first name
• LN = last name
• ADDRESS = complete
address
• TEL = telephone number
• INPUT FN, LN
• INPUT ADDRESS
• INPUT TEL
• PRINT FN, ADDRESS, TEL
• END
17.
•PROBLEM 2.
Ask theuser to input two numbers
and have the program compute the
sum. The output should print the
two numbers and their sum.
18.
POSSIBLE
ANSWER
•START
• N1 =first number
• N2 = second number
• SUM
• INPUT N1
• INPUT N2
• SUM N1 + N2
• PRINT N1
• PRINT N2
• PRINT SUM
• END
19.
INPUT
•The values
and
formulas
to beused
PROCES
S •The
procedures
that can
help the
user
manipulate
the input
data to
arrive at a
solution
OUTPU
T •The results
obtained
from data
processing
20.
•From Latin word“Datum” mean “SOMETHING
GIVEN”
•Defined as any collection of facts
•In the form of facts or figures obtained from
experiments or surveys
21.
•Used as basisfor making calculations or
drawing conclusions
•Used in computer processing
•(numbers, texts, images, sounds, in a form
that is suitable for storage in or processing
by a computer)
22.
EXAMPLES OF PSEUDOCODED SOLUTIONS
CREATE A FLOWCHART VERSION FOR EACH
SOLUTONS PRESENTED
23.
• PROBLEM 1.
•Ask the user to type in
his/her complete name,
complete address and
telephone number.
Generate a print out of
the first name, address
and telephone number
only.
• START
• FN = first name
• LN = last name
• ADDRESS = complete address
• TEL = telephone number
• INPUT FN, LN
• INPUT ADDRESS
• INPUT TEL
• PRINT FN, ADDRESS, TEL
• END
24.
• PROBLEM 5.
•Create a program in
accessing Facebook
user accounts.
• START
• EMAIL = email address
• PW = password
• URL = Uniform Resource Locator
• PROCESS Access web browser
• INPUT URL
• PROCESS Access LOG IN page
• INPUT EMAIL, PW
• IF EMAIL and PW are correct
THEN DISPLAY Facebook Account
ELSE
INPUT EMAIL, PW
• END IF
• END
25.
•Create a flowchartwhich shows the
steps in cooking a sunny side-up egg.
•Create a flowchart which shows the
steps in computing the area of a
rectangle.
20 MINS.
PROBLEM 1.
Createa flowchart which shows a simple voting
system that will ask the user to INPUT name and
age, the system will CHECK if the age is above
18 OUTPUT name and say “Qualified for voting”
and if below 18 output name and say “Not
qualified for voting”.