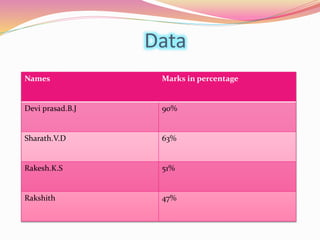
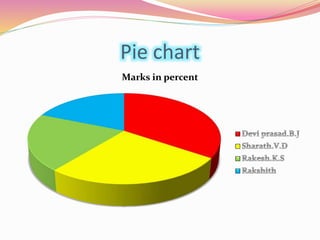
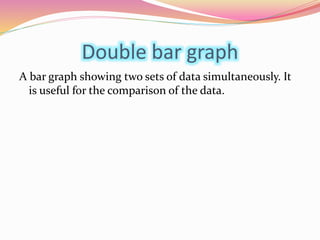
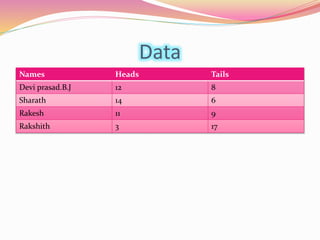
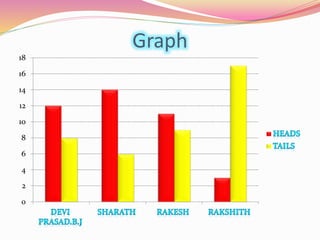
The document contains information about different types of graphs. It includes a pie chart showing student marks percentages, with Devi Prasad having the highest at 90%. It also contains a double bar graph comparing student scores in heads and tails, with Rakshith scoring the most tails at 17. The document was created by Charan S D, a 9th grade student at Amrita Vidyalayam, for their Math subject.