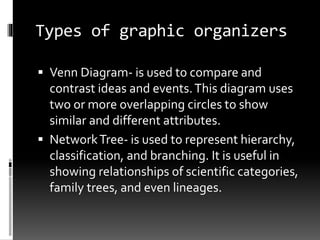
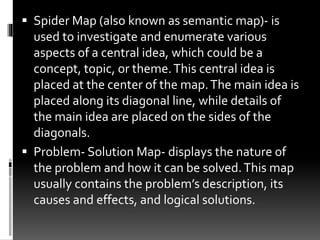
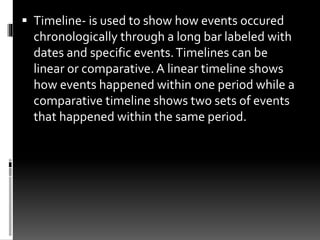
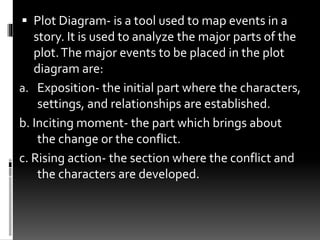
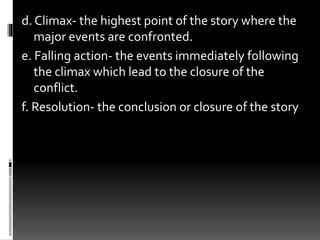
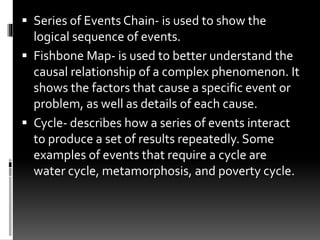
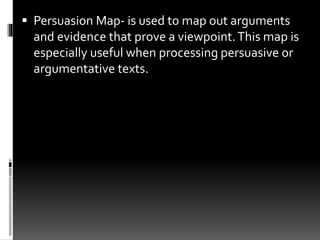
GRAPHIC ORGANIZERS
Types of graphic organizers
 Venn Diagram- is used to compare and
contrast ideas and events.This diagram uses
two or more overlapping circles to show
similar and different attributes.
 NetworkTree- is used to represent hierarchy,
classification, and branching. It is useful in
showing relationships of scientific categories,
family trees, and even lineages.
 Spider Map (also known as semantic map)- is
used to investigate and enumerate various
aspects of a central idea, which could be a
concept, topic, or theme.This central idea is
placed at the center of the map.The main idea is
placed along its diagonal line, while details of
the main idea are placed on the sides of the
diagonals.
 Problem- Solution Map- displays the nature of
the problem and how it can be solved.This map
usually contains the problem’s description, its
causes and effects, and logical solutions.
 Timeline- is used to show how events occured
chronologically through a long bar labeled with
dates and specific events.Timelines can be
linear or comparative. A linear timeline shows
how events happened within one period while a
comparative timeline shows two sets of events
that happened within the same period.
 Plot Diagram- is a tool used to map events in a
story. It is used to analyze the major parts of the
plot.The major events to be placed in the plot
diagram are:
a. Exposition- the initial part where the characters,
settings, and relationships are established.
b. Inciting moment- the part which brings about
the change or the conflict.
c. Rising action- the section where the conflict and
the characters are developed.
d. Climax- the highest point of the story where the
major events are confronted.
e. Falling action- the events immediately following
the climax which lead to the closure of the
conflict.
f. Resolution- the conclusion or closure of the story
 Series of Events Chain- is used to show the
logical sequence of events.
 Fishbone Map- is used to better understand the
causal relationship of a complex phenomenon. It
shows the factors that cause a specific event or
problem, as well as details of each cause.
 Cycle- describes how a series of events interact
to produce a set of results repeatedly. Some
examples of events that require a cycle are
water cycle, metamorphosis, and poverty cycle.
 Persuasion Map- is used to map out arguments
and evidence that prove a viewpoint.This map is
especially useful when processing persuasive or
argumentative texts.

Graphic organizers

  • 1.
  • 2.
    Types of graphicorganizers  Venn Diagram- is used to compare and contrast ideas and events.This diagram uses two or more overlapping circles to show similar and different attributes.  NetworkTree- is used to represent hierarchy, classification, and branching. It is useful in showing relationships of scientific categories, family trees, and even lineages.
  • 3.
     Spider Map(also known as semantic map)- is used to investigate and enumerate various aspects of a central idea, which could be a concept, topic, or theme.This central idea is placed at the center of the map.The main idea is placed along its diagonal line, while details of the main idea are placed on the sides of the diagonals.  Problem- Solution Map- displays the nature of the problem and how it can be solved.This map usually contains the problem’s description, its causes and effects, and logical solutions.
  • 4.
     Timeline- isused to show how events occured chronologically through a long bar labeled with dates and specific events.Timelines can be linear or comparative. A linear timeline shows how events happened within one period while a comparative timeline shows two sets of events that happened within the same period.
  • 5.
     Plot Diagram-is a tool used to map events in a story. It is used to analyze the major parts of the plot.The major events to be placed in the plot diagram are: a. Exposition- the initial part where the characters, settings, and relationships are established. b. Inciting moment- the part which brings about the change or the conflict. c. Rising action- the section where the conflict and the characters are developed.
  • 6.
    d. Climax- thehighest point of the story where the major events are confronted. e. Falling action- the events immediately following the climax which lead to the closure of the conflict. f. Resolution- the conclusion or closure of the story
  • 7.
     Series ofEvents Chain- is used to show the logical sequence of events.  Fishbone Map- is used to better understand the causal relationship of a complex phenomenon. It shows the factors that cause a specific event or problem, as well as details of each cause.  Cycle- describes how a series of events interact to produce a set of results repeatedly. Some examples of events that require a cycle are water cycle, metamorphosis, and poverty cycle.
  • 8.
     Persuasion Map-is used to map out arguments and evidence that prove a viewpoint.This map is especially useful when processing persuasive or argumentative texts.