Download to read offline

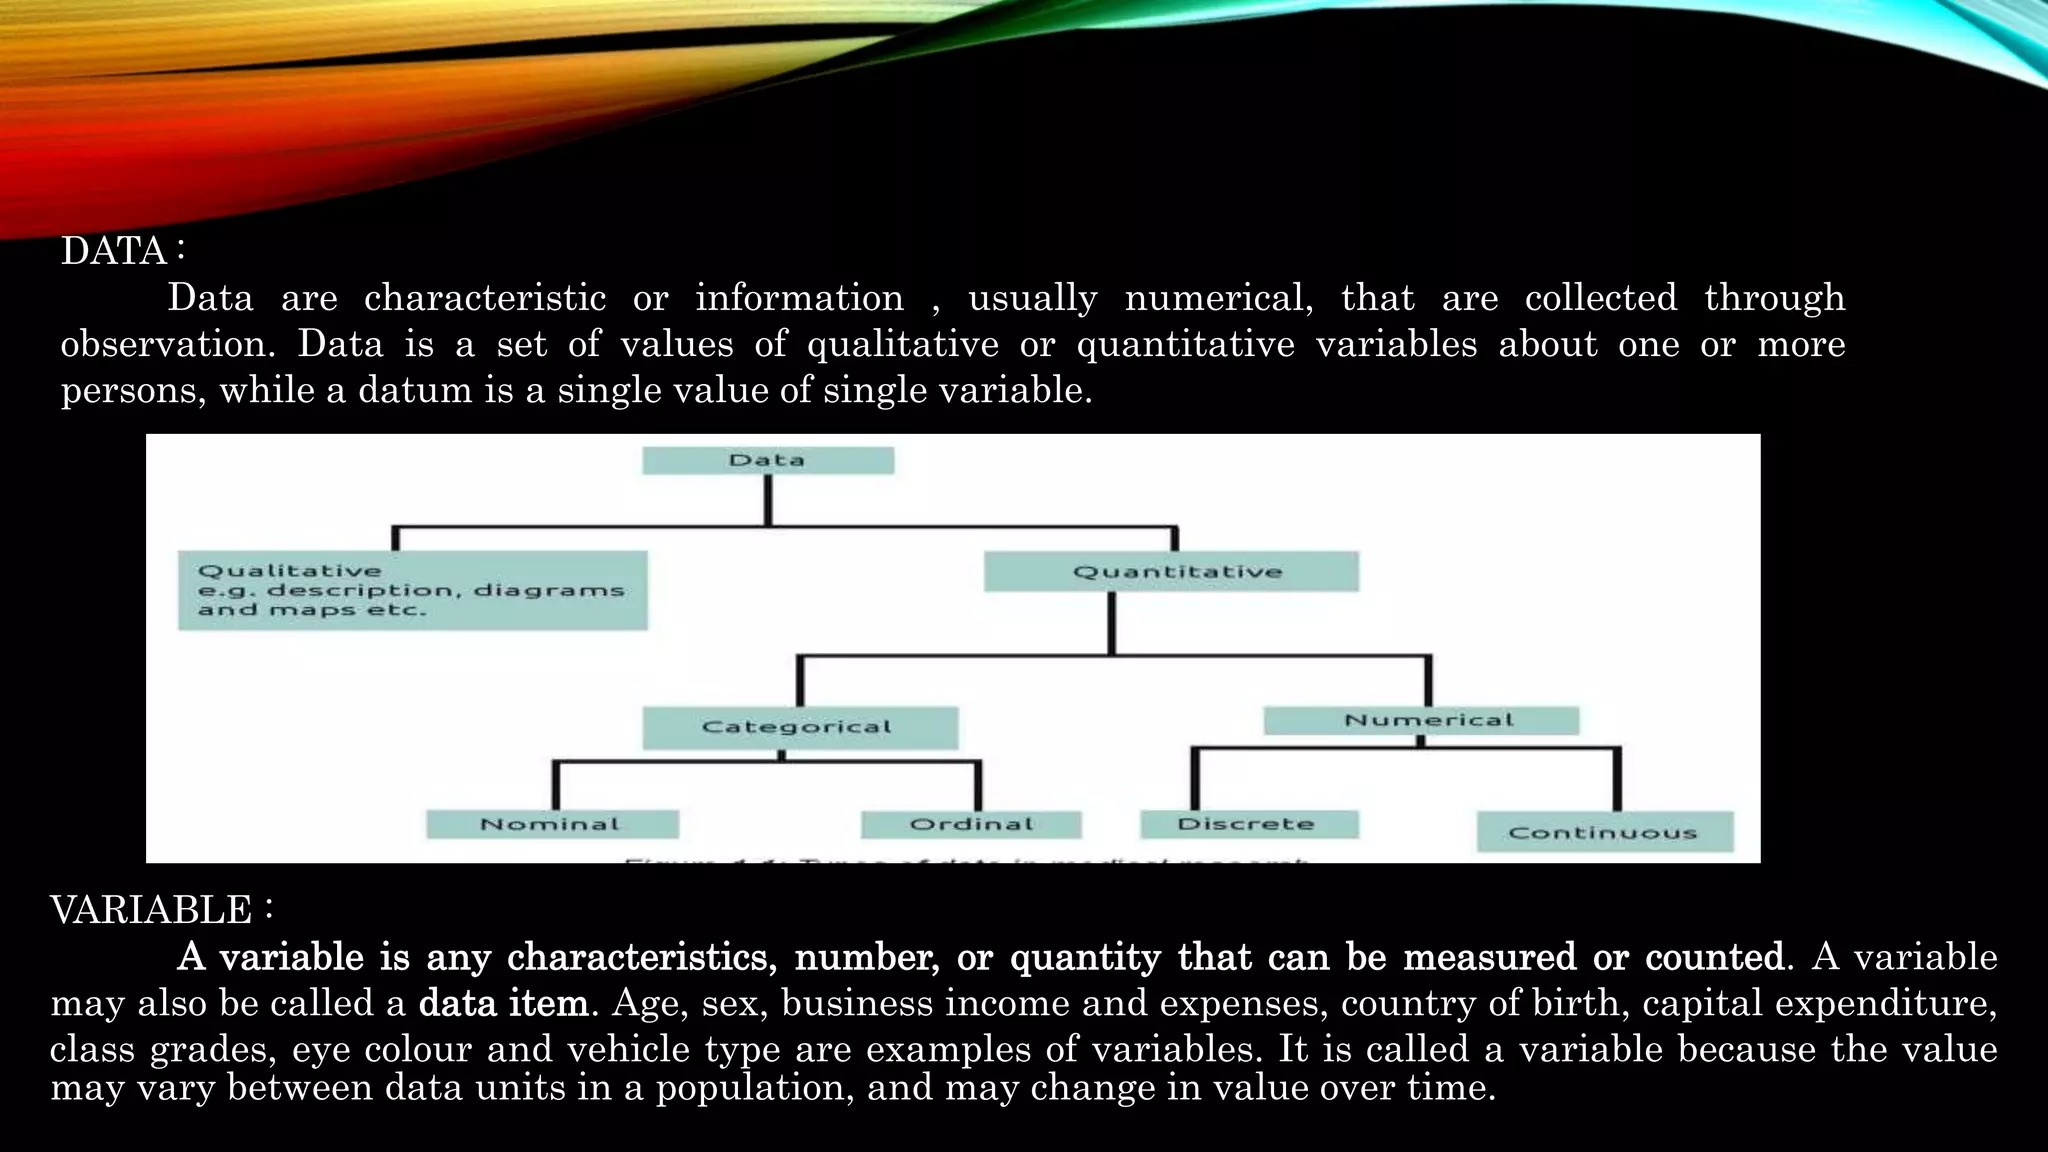

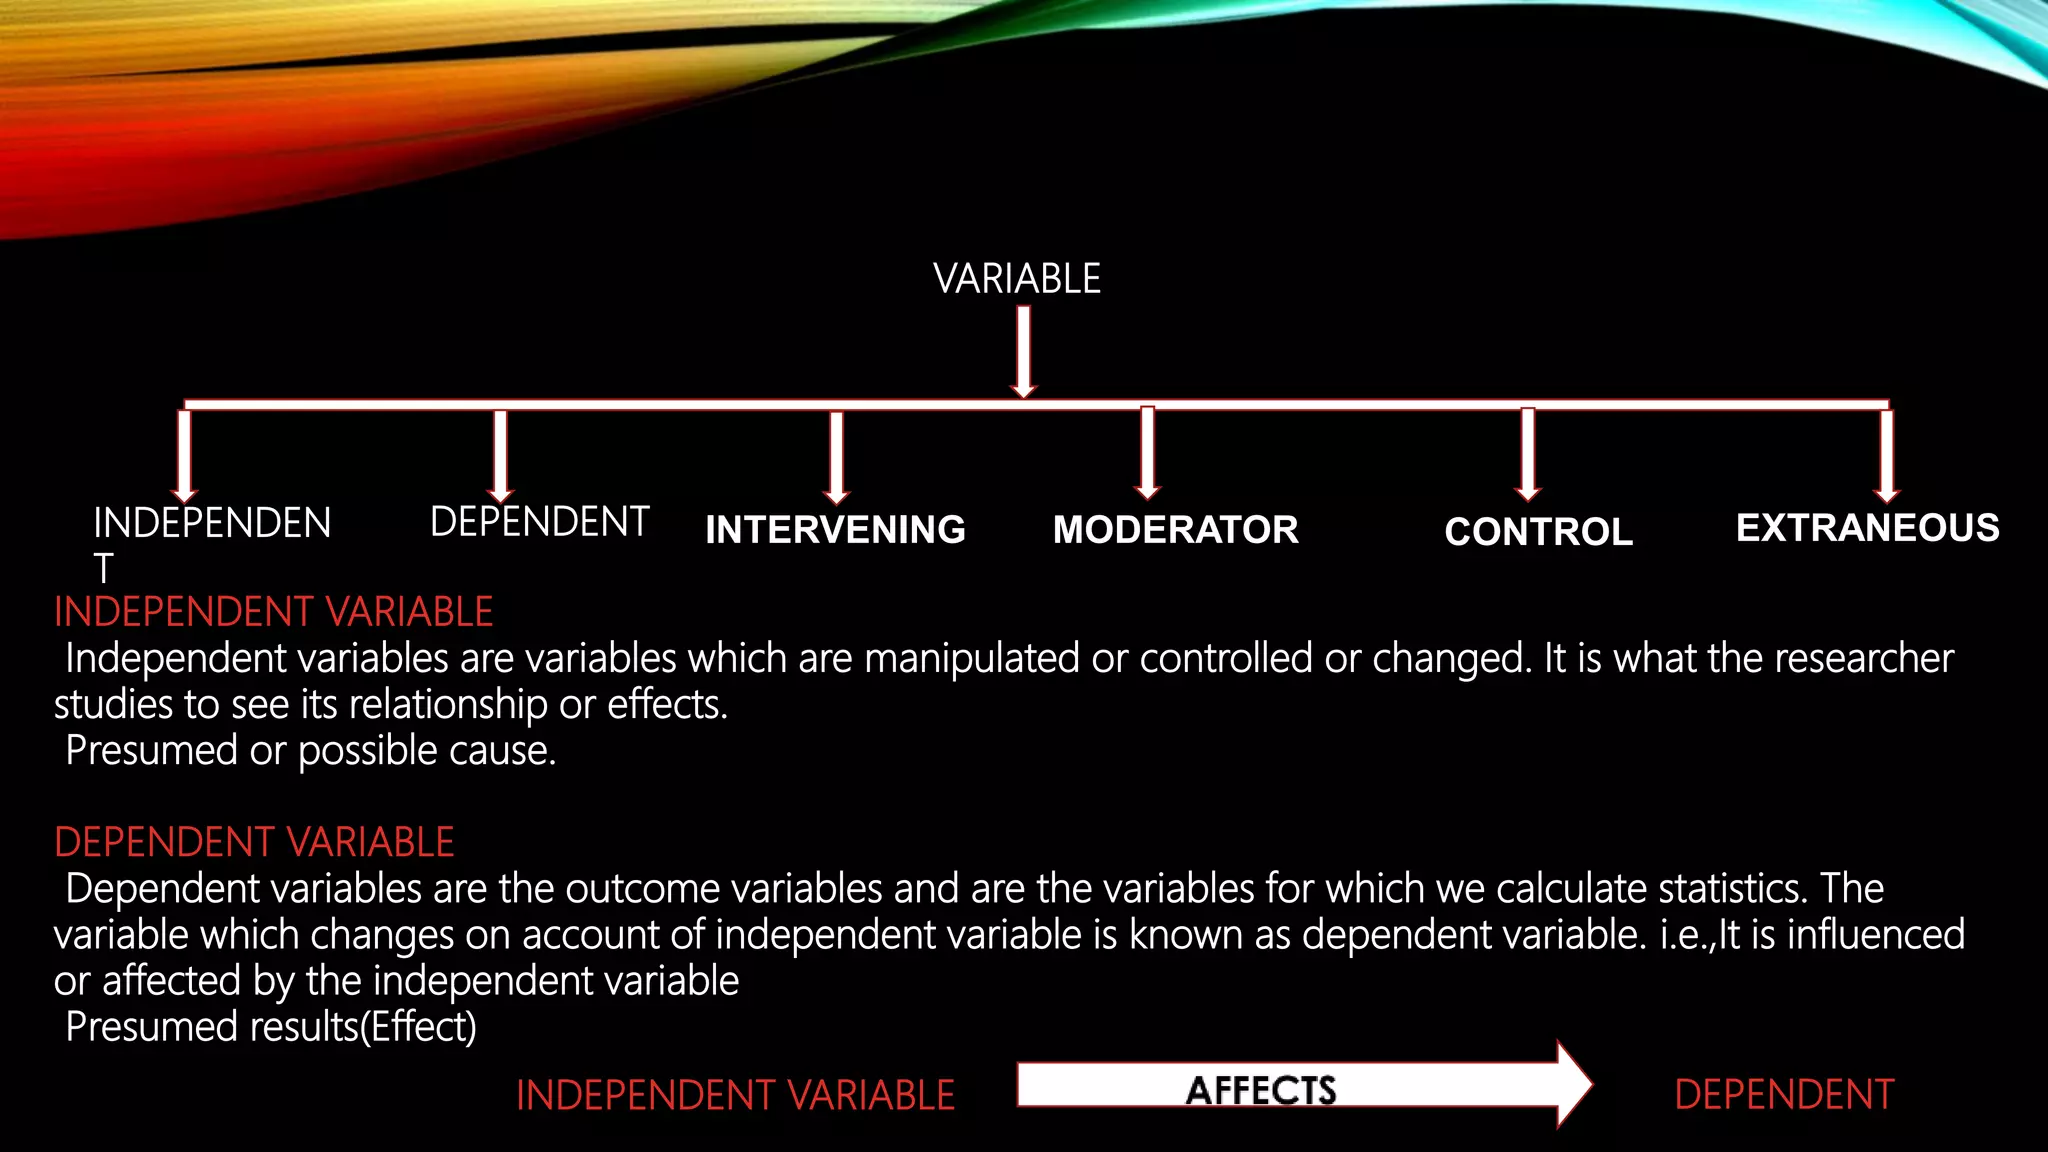

This document defines key terms related to data and variables: 1. Data are characteristic or information, usually numerical, that are collected through observation. Variables are any characteristics that can be measured or counted. 2. Quantitative data is numerical data that is measured in numbers or counts. It includes numerical data and categorical data such as interval and ratio data. 3. Variables include independent variables, dependent variables, intervening variables, moderator variables, control variables, and extraneous variables. Independent variables are what is manipulated in an experiment, while dependent variables are what is observed.