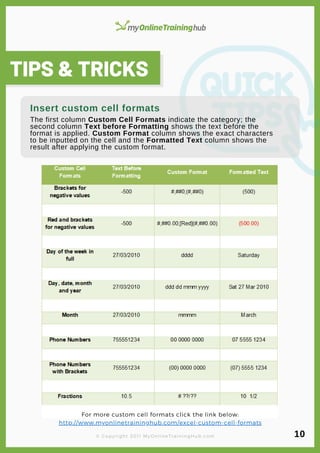
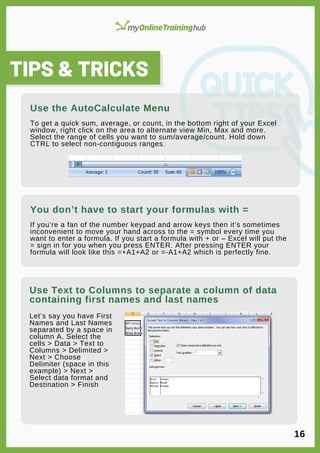
This document provides tips and tricks for using Microsoft Excel. It includes shortcuts for copying, pasting, formatting cells, and other common tasks. It also provides instructions for functions like transposing data, increasing numbers by a set amount, forcing line breaks in cells, and using the format painter. The document is intended to help readers become more proficient with Excel.
This document provides a summary of key Excel functions including formatting cells, selecting cells, entering and editing data, wrapping text, deleting cells, saving and closing files, using absolute cell references, and using logical and lookup functions. It explains how to format cells using number, date, currency and other formats. It also describes how to navigate between cells using keyboard shortcuts and the name box, select single or multiple cells, enter and edit text and numbers, wrap text, delete cell contents, save and close a workbook. The document further explains absolute cell referencing and using logical functions like IF, AND, OR and NOT as well as lookup functions such as VLOOKUP and HLOOKUP.
Uses & applications of microsoft excel in vph researchDr Alok Bharti
Microsoft Excel is a spreadsheet application that allows users to enter and organize data into columns and rows, perform calculations with formulas, and visualize data through graphs and charts. It consists of worksheets where data is entered into cells that are organized by columns and rows. Common functions include formatting cells, filtering and sorting data, and using formulas to analyze data through calculations and pivot tables to examine relationships between variables.
This document provides an introduction and tutorial for Microsoft Excel. It begins with an overview of Excel and what it can be used for, such as budget creation, data analysis, and presenting information. It then discusses key Excel components like the ribbon menu, cells, columns, rows, and worksheets. The document provides instructions for common tasks like navigating, entering data, formatting text and cells, inserting and deleting rows and columns, sorting data, and printing. It concludes by explaining how to copy and paste formatting between cells using tools like the format painter.
Youtube Link:
English: https://youtu.be/U2lBTGR3GeQ
Hindi: https://youtu.be/uGwJb7t28t4
Excel – is the world’s most widely used spreadsheet calculating program
It is used in many places like hospitals, hotels, school and companies etc.
A program that allows you to use data to forecast, manage, predict, and present information
Let’s Just Go For It! Wish you an Awesome Learning Experience.
Subscribe to our YouTube channel:
https://www.youtube.com/c/TimesRide?sub_confirmation=1
Visit our Official Website: https://timesride.com/
Follow us:
Facebook: https://www.facebook.com/timesride
Twitter: https://twitter.com/TimesRide
LinkedIn: https://www.linkedin.com/in/timesride
Instagram: https://www.instagram.com/timesride.connect
Pinterest: https://in.pinterest.com/timesrideconnect
Scribd: https://www.scribd.com/user/529709683/Times-Ride
Thank You
#AwesomeLearningExperience
#SmartQuickTips&Tricks #LeaningVideos #TimesRide #Keep Learning to Keep Winning!
Excel is a spreadsheet program that allows users to create and format workbooks containing spreadsheets to analyze data. Users can track data, build models, write formulas, pivot data, and present it in charts. The ribbon interface organizes commands into tabs like Home, Insert, Page Layout, Formulas, Data, Review, and View. Users can enter and format data, insert items, adjust page setup, create formulas, sort/filter data, check spelling, and change views. Formatting options include borders, styles, fills, fonts, wrapping text, and number formats to enhance the professional appearance of spreadsheets.
Excel can be used to create and format workbooks containing spreadsheets in order to analyze data. The ribbon interface in Excel 2010 organizes commands into tabs like Home, Insert, Page Layout, Formulas, and Data. Functions like sorting, filtering, and formulas can be used to analyze and modify worksheet data. Cells can be formatted, merged, borders added, and text wrapped to further enhance the appearance and readability of spreadsheets.
Excel can be used to create and format workbooks containing spreadsheets in order to analyze data. The ribbon interface in Excel 2010 organizes commands into tabs like Home, Insert, Page Layout, Formulas, and Data. Functions like sorting, filtering, and formulas can be used to manipulate data. Cells and ranges can be formatted with borders, colors, number formats, and other styles to present data professionally in charts and tables.
This document provides an outline for a lecture on introducing Microsoft Excel 2010. It discusses the Excel interface and various functions for navigating, selecting, editing, formatting and arranging cells, rows and columns. These include moving between worksheets, renaming worksheets, inserting and deleting rows and columns, changing row heights and column widths, hiding and unhiding rows and columns, and switching between different Excel views. The learning objectives are to understand and apply skills for exploring the Excel user interface and performing common tasks like formatting numbers and cells.
Get up to speed quickly on Excel! Excel can be very intimidating for the beginner but you don't need to know everything to operate day-to-day. Start with the basics and that will take you a long way.
The document provides an agenda for teaching basic Excel skills. It will cover the essential Home tab functions for basic tasks like formatting, sorting, and filtering. It will also cover more advanced skills like inserting objects, charts and using keyboard shortcuts to work more efficiently. The goal is for learners to feel comfortable creating and formatting a basic spreadsheet and practicing useful techniques.
This document provides an overview of Microsoft Excel and its various features and functions. It discusses the layout and components of a spreadsheet, including rows, columns, cells, worksheets and ribbons. It describes how to enter and modify cell data, insert and delete rows and columns, and use basic formulas and functions like SUM. The document is intended as a guide for using Excel and highlights its applications in fields like accounting, auditing, taxation and data analysis.
1) The document provides instructions on getting started with Excel, including how to navigate worksheets, select and enter data, format cells, and use basic formulas. It covers functions like IF, AND, OR and NOT.
2) Formatting cells allows you to change how data is displayed, such as displaying numbers as currency or dates. You can also create custom formats. Absolute cell references lock the cell reference so it does not change when a formula is copied.
3) Names can be assigned to cells or ranges to make formulas and references more readable. The GOTO feature and names allow quickly navigating to cells. Names are also useful in formulas in place of cell references.
This document provides a quick reference guide for Excel formulae and functions. It begins with the basics of building formulae using cell references and operators like addition and subtraction. It then explains how to use functions by providing the function name and arguments. The document provides examples of how to build formulae to add, subtract, multiply and divide. It also discusses techniques like using absolute cell references when copying formulae and using the autosum and autofill functions.
This document provides tips and instructions for using spreadsheets. It begins with definitions of key spreadsheet terminology like cells, rows, and columns. It then gives numerous tips for inputting, formatting, and manipulating data within spreadsheets. These tips include adjusting column widths, inserting and deleting rows and columns, formatting cells, and using basic formulas like SUM. The document demonstrates concepts like copying and pasting formulas while maintaining relative cell references. It also shows functions like autofill and format painter for efficiently applying formats.
This document provides an outline for a training course on using Microsoft Excel. It includes learning objectives, topics that will be covered such as navigating worksheets, inserting and deleting rows and columns, and formatting cells. The document contains details on how to perform tasks like changing column widths, selecting cells and ranges, and editing and formatting worksheets. It also provides overviews of the Excel interface and different views within Excel.
The document provides instructions on getting started with Excel including how to work with worksheets, format cells, select cells, enter and edit data, wrap text, delete cells, save files, and close Excel. It also discusses calculating data with advanced formulas including using names, absolute cell addressing, conditional and logical functions like IF, AND, OR, and NOT statements, and lookup functions like LOOKUP, HLOOKUP, VLOOKUP, and more. Key topics covered include formatting cells, selecting ranges, editing data, absolute vs relative references, logical tests and conditions, and looking up values.
Excel can be used to create spreadsheets, charts, and simple databases. It contains worksheets made up of rows and columns that intersect to form cells. Cells can contain labels, values, or formulas. Functions like SUM can perform calculations on ranges of cells. Conditional formatting can change cell appearances based on values. Data can be sorted, filtered, and organized into tables or charts for visualization.
This document provides 10 tips to help users work more efficiently in Excel. Tip 1 explains how to keep the active cell in place when pressing enter. Tip 2 says you don't need to capitalize function names. Tip 3 notes you don't need a closing parenthesis for single functions. The tips continue with suggestions like not using collapse buttons, right clicking for formatting options, using keyboard shortcuts for menus, and more ways to streamline common Excel tasks. It encourages visiting an online tutorial site for additional Excel tips.
This document provides an overview of managing worksheets in Excel. It discusses how to create and manage workbooks and worksheets, enter and format cell data, and manipulate rows and columns. The document covers topics such as creating and renaming worksheets, adding and deleting sheets, navigating between sheets, moving and copying sheets, and saving workbooks. It also discusses selecting cells and ranges, copying and pasting data, commenting on cells, and deleting or replacing cell content.
This chapter discusses how to format worksheets in Microsoft Excel. It covers how to add borders and background colors, format text and numbers, adjust column and row sizes, center and align cell contents, copy and move cells using absolute and relative references, and insert and delete rows and columns. The chapter also discusses using styles, hiding and unhiding rows and columns, and managing multiple worksheets in a workbook.
You can insert, delete, move, and rename worksheets. Insert or delete cells when needed for space. AutoComplete suggests labels as you type, and Pick From Drop-Down List displays column labels. Cut or copied data can be pasted multiple times and is stored on the Windows and Office Clipboards. Deleting or inserting rows or columns affects the entire worksheet. Change alignment to improve readability. The Mini toolbar formats selected text. Merge and Center combines cells. Borders and shading outline and fill cells. Data bars apply conditional formatting based on cell values.
This document provides an overview of the basic functions and features of Microsoft Excel. It explains how to navigate an Excel worksheet and describes the different areas like cells, columns, rows, and worksheets. It also covers how to enter and format text and numeric data, perform calculations with formulas, and print or modify a worksheet. Common tasks like inserting or deleting cells/rows/columns, copying and pasting data, and using auto-fill are demonstrated. Finally, it introduces basic formulas and functions in Excel.
1. This document provides instructions for using basic Microsoft Excel functions like opening Excel, navigating the ribbon interface, entering data into cells, formatting cells, using autofill, and other common tasks.
2. It explains the different parts of the Excel interface like tabs, groups, commands, and describes the different data types Excel recognizes.
3. The document provides step-by-step examples for tasks like entering text and numbers, selecting cells, cutting/copying/pasting data, inserting and deleting rows and columns, and using basic formatting options.
This document is a table of contents and introduction for "The Mega Book of Excel Keyboard Shortcuts" by John MacDougall. It provides an overview of the book's contents including sections on copying and pasting, editing data and formulas, Excel window commands, formatting cells, and more. The introduction welcomes the reader and explains that the book contains Excel and Visual Basic Editor keyboard shortcuts to help users work more efficiently in Excel.
The document discusses the major components of the Excel window and how to navigate and work with Excel spreadsheets. It describes key Excel concepts like workbooks, worksheets, cells, formulas, and charts. It also provides instructions for common Excel tasks like entering data, selecting ranges, inserting and deleting rows/columns, moving cells, printing, and using the Chart Wizard to create graphs.
This document provides an introduction to using Microsoft Excel for an accounting course. It explains basic spreadsheet concepts and Excel features such as cells, columns, rows, formatting, entering data, altering cell sizes, inserting/deleting rows and columns, and using cut, copy and paste. Students are instructed to create a proper spreadsheet for accounting purposes based on a provided guide.
Superpower Your Apache Kafka Applications Development with Complementary Open...Paul Brebner
Kafka Summit talk (Bangalore, India, May 2, 2024, https://events.bizzabo.com/573863/agenda/session/1300469 )
Many Apache Kafka use cases take advantage of Kafka’s ability to integrate multiple heterogeneous systems for stream processing and real-time machine learning scenarios. But Kafka also exists in a rich ecosystem of related but complementary stream processing technologies and tools, particularly from the open-source community. In this talk, we’ll take you on a tour of a selection of complementary tools that can make Kafka even more powerful. We’ll focus on tools for stream processing and querying, streaming machine learning, stream visibility and observation, stream meta-data, stream visualisation, stream development including testing and the use of Generative AI and LLMs, and stream performance and scalability. By the end you will have a good idea of the types of Kafka “superhero” tools that exist, which are my favourites (and what superpowers they have), and how they combine to save your Kafka applications development universe from swamploads of data stagnation monsters!
A Comprehensive Guide on Implementing Real-World Mobile Testing Strategies fo...kalichargn70th171
In today's fiercely competitive mobile app market, the role of the QA team is pivotal for continuous improvement and sustained success. Effective testing strategies are essential to navigate the challenges confidently and precisely. Ensuring the perfection of mobile apps before they reach end-users requires thoughtful decisions in the testing plan.
Baha Majid WCA4Z IBM Z Customer Council Boston June 2024.pdfBaha Majid
IBM watsonx Code Assistant for Z, our latest Generative AI-assisted mainframe application modernization solution. Mainframe (IBM Z) application modernization is a topic that every mainframe client is addressing to various degrees today, driven largely from digital transformation. With generative AI comes the opportunity to reimagine the mainframe application modernization experience. Infusing generative AI will enable speed and trust, help de-risk, and lower total costs associated with heavy-lifting application modernization initiatives. This document provides an overview of the IBM watsonx Code Assistant for Z which uses the power of generative AI to make it easier for developers to selectively modernize COBOL business services while maintaining mainframe qualities of service.
The Comprehensive Guide to Validating Audio-Visual Performances.pdfkalichargn70th171
Ensuring the optimal performance of your audio-visual (AV) equipment is crucial for delivering exceptional experiences. AV performance validation is a critical process that verifies the quality and functionality of your AV setup. Whether you're a content creator, a business conducting webinars, or a homeowner creating a home theater, validating your AV performance is essential.
Nashik's top web development company, Upturn India Technologies, crafts innovative digital solutions for your success. Partner with us and achieve your goals
WWDC 2024 Keynote Review: For CocoaCoders AustinPatrick Weigel
Overview of WWDC 2024 Keynote Address.
Covers: Apple Intelligence, iOS18, macOS Sequoia, iPadOS, watchOS, visionOS, and Apple TV+.
Understandable dialogue on Apple TV+
On-device app controlling AI.
Access to ChatGPT with a guest appearance by Chief Data Thief Sam Altman!
App Locking! iPhone Mirroring! And a Calculator!!
Why Apache Kafka Clusters Are Like Galaxies (And Other Cosmic Kafka Quandarie...Paul Brebner
Closing talk for the Performance Engineering track at Community Over Code EU (Bratislava, Slovakia, June 5 2024) https://eu.communityovercode.org/sessions/2024/why-apache-kafka-clusters-are-like-galaxies-and-other-cosmic-kafka-quandaries-explored/ Instaclustr (now part of NetApp) manages 100s of Apache Kafka clusters of many different sizes, for a variety of use cases and customers. For the last 7 years I’ve been focused outwardly on exploring Kafka application development challenges, but recently I decided to look inward and see what I could discover about the performance, scalability and resource characteristics of the Kafka clusters themselves. Using a suite of Performance Engineering techniques, I will reveal some surprising discoveries about cosmic Kafka mysteries in our data centres, related to: cluster sizes and distribution (using Zipf’s Law), horizontal vs. vertical scalability, and predicting Kafka performance using metrics, modelling and regression techniques. These insights are relevant to Kafka developers and operators.
Odoo releases a new update every year. The latest version, Odoo 17, came out in October 2023. It brought many improvements to the user interface and user experience, along with new features in modules like accounting, marketing, manufacturing, websites, and more.
The Odoo 17 update has been a hot topic among startups, mid-sized businesses, large enterprises, and Odoo developers aiming to grow their businesses. Since it is now already the first quarter of 2024, you must have a clear idea of what Odoo 17 entails and what it can offer your business if you are still not aware of it.
This blog covers the features and functionalities. Explore the entire blog and get in touch with expert Odoo ERP consultants to leverage Odoo 17 and its features for your business too.
An Overview of Odoo ERP
Odoo ERP was first released as OpenERP software in February 2005. It is a suite of business applications used for ERP, CRM, eCommerce, websites, and project management. Ten years ago, the Odoo Enterprise edition was launched to help fund the Odoo Community version.
When you compare Odoo Community and Enterprise, the Enterprise edition offers exclusive features like mobile app access, Odoo Studio customisation, Odoo hosting, and unlimited functional support.
Today, Odoo is a well-known name used by companies of all sizes across various industries, including manufacturing, retail, accounting, marketing, healthcare, IT consulting, and R&D.
The latest version, Odoo 17, has been available since October 2023. Key highlights of this update include:
Enhanced user experience with improvements to the command bar, faster backend page loading, and multiple dashboard views.
Instant report generation, credit limit alerts for sales and invoices, separate OCR settings for invoice creation, and an auto-complete feature for forms in the accounting module.
Improved image handling and global attribute changes for mailing lists in email marketing.
A default auto-signature option and a refuse-to-sign option in HR modules.
Options to divide and merge manufacturing orders, track the status of manufacturing orders, and more in the MRP module.
Dark mode in Odoo 17.
Now that the Odoo 17 announcement is official, let’s look at what’s new in Odoo 17!
What is Odoo ERP 17?
Odoo 17 is the latest version of one of the world’s leading open-source enterprise ERPs. This version has come up with significant improvements explained here in this blog. Also, this new version aims to introduce features that enhance time-saving, efficiency, and productivity for users across various organisations.
Odoo 17, released at the Odoo Experience 2023, brought notable improvements to the user interface and added new functionalities with enhancements in performance, accessibility, data analysis, and management, further expanding its reach in the market.
Mobile App Development Company In Noida | Drona InfotechDrona Infotech
React.js, a JavaScript library developed by Facebook, has gained immense popularity for building user interfaces, especially for single-page applications. Over the years, React has evolved and expanded its capabilities, becoming a preferred choice for mobile app development. This article will explore why React.js is an excellent choice for the Best Mobile App development company in Noida.
Visit Us For Information: https://www.linkedin.com/pulse/what-makes-reactjs-stand-out-mobile-app-development-rajesh-rai-pihvf/
Everything You Need to Know About X-Sign: The eSign Functionality of XfilesPr...XfilesPro
Wondering how X-Sign gained popularity in a quick time span? This eSign functionality of XfilesPro DocuPrime has many advancements to offer for Salesforce users. Explore them now!
Boost Your Savings with These Money Management AppsJhone kinadey
A money management app can transform your financial life by tracking expenses, creating budgets, and setting financial goals. These apps offer features like real-time expense tracking, bill reminders, and personalized insights to help you save and manage money effectively. With a user-friendly interface, they simplify financial planning, making it easier to stay on top of your finances and achieve long-term financial stability.
Transforming Product Development using OnePlan To Boost Efficiency and Innova...OnePlan Solutions
Ready to overcome challenges and drive innovation in your organization? Join us in our upcoming webinar where we discuss how to combat resource limitations, scope creep, and the difficulties of aligning your projects with strategic goals. Discover how OnePlan can revolutionize your product development processes, helping your team to innovate faster, manage resources more effectively, and deliver exceptional results.
DECODING JAVA THREAD DUMPS: MASTER THE ART OF ANALYSISTier1 app
Are you ready to unlock the secrets hidden within Java thread dumps? Join us for a hands-on session where we'll delve into effective troubleshooting patterns to swiftly identify the root causes of production problems. Discover the right tools, techniques, and best practices while exploring *real-world case studies of major outages* in Fortune 500 enterprises. Engage in interactive lab exercises where you'll have the opportunity to troubleshoot thread dumps and uncover performance issues firsthand. Join us and become a master of Java thread dump analysis!
16. lorem ipsum
Let’s say you have First
Names and Last Names
separated by a space in
column A. Select the
cells > Data > Text to
Columns > Delimited >
Next > Choose
Delimiter (space in this
example) > Next >
Select data format and
Destination > Finish
TIPS & TRICKS
To get a quick sum, average, or count, in the bottom right of your Excel
window, right click on the area to alternate view Min, Max and more.
Select the range of cells you want to sum/average/count. Hold down
CTRL to select non-contiguous ranges.
Use Text to Columns to separate a column of data
containing first names and last names
Use the AutoCalculate Menu
If you’re a fan of the number keypad and arrow keys then it’s sometimes
inconvenient to move your hand across to the = symbol every time you
want to enter a formula. If you start a formula with + or – Excel will put the
= sign in for you when you press ENTER. After pressing ENTER your
formula will look like this =+A1+A2 or =-A1+A2 which is perfectly fine.
You don’t have to start your formulas with =
16