Daewoongholdings 003090-Algorithm Analysis Report
•
0 likes•131 views

This document contains financial information and analysis of the Algorithm company from 2014 to 2017, including quarterly sales, profits, debt ratios, and stock prices. It also provides the company's current stock price, an indicated price range, and investment recommendations based on the price gaps. A buying and selling analysis is given for different indicated price points. Charts show the company's stock price rise probability scores and sector comparisons over time. Compliance notices state that the analysis is for reference only and the user bears full responsibility for investment decisions.
![[Price for scheduled purchasing]
Arbitrarily made
알기컨 >
tacac.co.kr
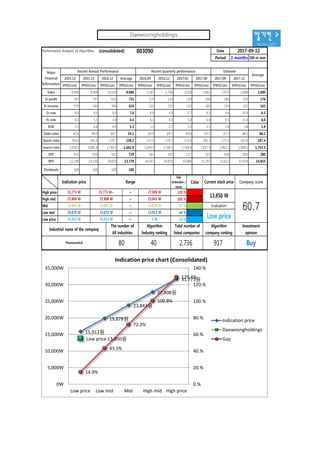
Algorithm stocks Trading Strategies (consolidated) 003090 Date
Period
Gap
(Indication /
stock)
Color
low price 15,913 W 15,913 W ~ 0 W 15 % -704,580 W -44
Low mid 19,878 W 19,878 W ~ 15,913 W 44 % -2,058,625 W -104
Mid 23,843 W 23,843 W ~ 19,878 W 72 % -3,412,671 W -143
High mid 27,808 W 27,808 W ~ 23,843 W 101 % -4,766,716 W All selling
Suggested Purchase
Amount 4,729,698 W
Number of stocks
purchased 341
Indication price Range Buying / Selling Buying / Selling [Stocks]
High price 31,773 W 31,773 W~ ~ 27,808 W 129 % -6,120,762 W All selling
2017-09-12
3 months
Current stock price Evaluation
Stock price rise
probability score
Investment opinion Prospective purchase amount
13,850 W Low price 40.8 Buy 10,000,000 W
50.1 30.8 41.1 37.5 48.2 34.2
2017.04.14 2017.05.18 2017.06.16 2017.07.14 2017.08.11 2017.09.11
Stock price rise
probability score
A Sector 52.7 44.0 51.4 46.1 51.1 49.6
40.8B Sector 47.5 17.5 30.8 46.1 45.4 18.8
Total average
2017.06.16 2017.07.14 2017.08.11 2017.09.11
Total of
increase rate
Total score
A Sector -20 % 14 % -11 % 10 % -3 %
-13 % 42.3B Sector -171 % 43 % 33 % -2 % -142 %
Total average -63 % 25 % -10 % 22 % -41 %
2017.05.18
53
44
51
46
51 5048
18
31
46 45
19
50
31
41
38
48
34
0
10
20
30
40
50
60
2017.04.14 2017.05.18 2017.06.16 2017.07.14 2017.08.11 2017.09.11
Stock price rise probability score
A sector
B sector
Total average
-20%
14%
-11%
10%
-3%
-171%
43% 33%
-2%
-142%
-63%
25%
-10%
22%
-41%
-200%
-150%
-100%
-50%
0%
50%
100%
2017.05.18 2017.06.16 2017.07.14 2017.08.11 2017.09.11
Increase rate of stock price rise
A sector
B sector
Total average
Daewoongholdings](data:image/gif;base64,R0lGODlhAQABAIAAAAAAAP///yH5BAEAAAAALAAAAAABAAEAAAIBRAA7)
Recommended
Recommended
More Related Content
What's hot
What's hot (20)
Similar to Daewoongholdings 003090-Algorithm Analysis Report
Similar to Daewoongholdings 003090-Algorithm Analysis Report (20)
More from 알고리즘 기업분석 컨설팅-알기컨,algikeon
More from 알고리즘 기업분석 컨설팅-알기컨,algikeon (20)
Recently uploaded
Recently uploaded (16)
Daewoongholdings 003090-Algorithm Analysis Report
- 1. 알기컨 > tacac.co.kr Performance Analysis of Algorithm (consolidated) 003090 Date Period 3 months 100-m won 2014.12 2015.12 2016.12 Average 2016.09 2016.12 2017.03 2017.06 2017.09 2017.12 IFRS(Con) IFRS(Con) IFRS(Con) IFRS(Con) IFRS(Con) IFRS(Con) IFRS(Con) IFRS(Con) IFRS(Con) IFRS(Con) IFRS(Con) Sales 8,940 9,968 10,150 9,686 2,565 2,706 2,628 2,862 2,972 3,086 2,690 O-profit 787 797 610 731 175 133 150 244 286 335 176 N-income 379 546 346 424 105 231 132 183 254 352 163 O-rate 8.8 8.0 6.0 7.6 6.8 4.9 5.7 8.5 9.6 10.9 6.5 N-rate 4.2 5.5 3.4 4.4 4.1 8.5 5.0 6.4 8.5 11.4 6.0 ROE 5.3 6.6 4.0 5.3 1.3 2.7 1.5 2.1 2.8 3.8 1.9 Debt-ratio 42.6 49.9 69.7 54.1 65.9 69.7 69.8 67.2 67.7 68.2 68.1 Quick-ratio 294.0 241.0 179.7 238.2 217.1 179.7 171.6 181.1 171.3 162.4 187.4 reserve-ratio 1,558.1 1,681.4 1,749.1 1,662.9 1,694.5 1,749.1 1,768.4 1,817.9 1,862.2 1,908.1 1,757.5 EPS 652 939 595 729 181 397 227 315 436 605 280 BPS 12,189 14,250 14,870 13,770 14,367 14,870 14,886 15,297 15,622 15,954 14,855 Dividends 100 100 100 100 Major Financial Information Recent Annual Performance Recent quarterly performance Estimate Average 2017-09-12 Gap (Indication / stock) Color High price ~ 129 % High mid ~ 101 % Mid ~ 72 % Low mid ~ 44 % Low price ~ 15 % Buy 15,913 W 15,913 W 0 W Industrial name of the company The number of All industries Algorithm Industry ranking Total number of listed companies Algorithm company ranking Investment opinion Pharmaceutical 80 40 2,736 917 27,808 W 27,808 W 23,843 W 23,843 W 23,843 W 19,878 W Evaluation 31,773 W 31,773 W~ 27,808 W 13,850 W 60.719,878 W 19,878 W 15,913 W Low price Indication price Range Current stock price Company score 15,913원 19,878원 23,843원 27,808원 31,773원 Low price 13,850원 14.9% 43.5% 72.2% 100.8% 129.4% 0.% 20.% 40.% 60.% 80.% 100.% 120.% 140.% 0W 5,000W 10,000W 15,000W 20,000W 25,000W 30,000W 35,000W Low price Low mid Mid High mid High price Indication price chart (Consolidated) Indication price Daewoongholdings Gap Daewoongholdings
- 2. [Price for scheduled purchasing] Arbitrarily made 알기컨 > tacac.co.kr Algorithm stocks Trading Strategies (consolidated) 003090 Date Period Gap (Indication / stock) Color low price 15,913 W 15,913 W ~ 0 W 15 % -704,580 W -44 Low mid 19,878 W 19,878 W ~ 15,913 W 44 % -2,058,625 W -104 Mid 23,843 W 23,843 W ~ 19,878 W 72 % -3,412,671 W -143 High mid 27,808 W 27,808 W ~ 23,843 W 101 % -4,766,716 W All selling Suggested Purchase Amount 4,729,698 W Number of stocks purchased 341 Indication price Range Buying / Selling Buying / Selling [Stocks] High price 31,773 W 31,773 W~ ~ 27,808 W 129 % -6,120,762 W All selling 2017-09-12 3 months Current stock price Evaluation Stock price rise probability score Investment opinion Prospective purchase amount 13,850 W Low price 40.8 Buy 10,000,000 W 50.1 30.8 41.1 37.5 48.2 34.2 2017.04.14 2017.05.18 2017.06.16 2017.07.14 2017.08.11 2017.09.11 Stock price rise probability score A Sector 52.7 44.0 51.4 46.1 51.1 49.6 40.8B Sector 47.5 17.5 30.8 46.1 45.4 18.8 Total average 2017.06.16 2017.07.14 2017.08.11 2017.09.11 Total of increase rate Total score A Sector -20 % 14 % -11 % 10 % -3 % -13 % 42.3B Sector -171 % 43 % 33 % -2 % -142 % Total average -63 % 25 % -10 % 22 % -41 % 2017.05.18 53 44 51 46 51 5048 18 31 46 45 19 50 31 41 38 48 34 0 10 20 30 40 50 60 2017.04.14 2017.05.18 2017.06.16 2017.07.14 2017.08.11 2017.09.11 Stock price rise probability score A sector B sector Total average -20% 14% -11% 10% -3% -171% 43% 33% -2% -142% -63% 25% -10% 22% -41% -200% -150% -100% -50% 0% 50% 100% 2017.05.18 2017.06.16 2017.07.14 2017.08.11 2017.09.11 Increase rate of stock price rise A sector B sector Total average Daewoongholdings
- 3. 알기컨 > tacac.co.kr 정보와 완전 정보 결 투자판단 있습니 위배 무단으 숙지하 Compliance notice ① The information provided by The Algorithm Company Analysis Consulting is obtained through reliable data and information and The Algorithm Company Analysis Program (TACAP), but its accuracy or completeness are not guaranteed. Furthermore, it may change over time.Therefore, we are not legally responsible for the results of the data provided by The Algorithm Company Analysis Consulting because of information errors or omissions. ② The Algorithm Company Analysis Consulting and all the information provided on it site are reference materials for investment decisions and the final responsibility of investment is up to users utilizing this information. ③ The Algorithm Company Analysis Consulting and its site do not do anything that violates the related laws such as discretionary transaction. ④ Users can not reallocate and recycle the information provided by The Algorithm Company Analysis Consulting firm let alone the information provided by its Site. ⑤ Be sure to know about application period of this algorithm analysis report in order to improve its accuracy. Tel : 070 - 4667 - 5009 Email : tacac@tacac.co.kr Homepage : tacac.co.kr Blog : tacac.blog.me Request : http://tacac.co.kr/?page_id=1374 ① Consulting The Algori accuracy o change ove results of Consulting ② informatio investmen up ③ do anythin transaction ④ The Algori informatio ⑤ analysis re