Downloaded 11 times


![An iMR query
The same:
• MapReduce API
– map(r) {k,v} : extract/filter data
– reduce({k,v[]}) v’ : data aggregation
– combine({k,v[]}) v’ : early, partial aggregation
The new:
• Provides continuous results
– because logs are continuous
4](https://image.slidesharecdn.com/imr-130304030226-phpapp02/85/In-situ-MapReduce-for-Log-Processing-5-320.jpg)
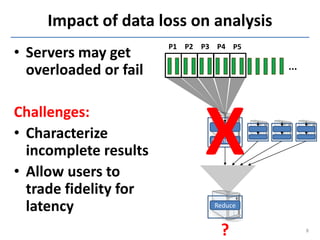

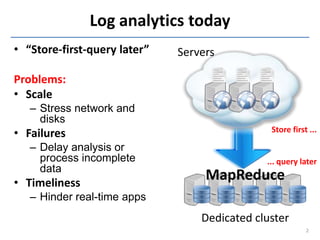
This document discusses in-situ MapReduce (iMR) for log processing. iMR moves MapReduce analysis to the servers generating logs to avoid transferring large amounts of data. It provides continuous results over sliding windows of log data. The approach quantifies data fidelity when results may be incomplete due to failures or overloads using a "C2 metric." This allows trading off fidelity for lower latency. A prototype implementation extends an existing system to evaluate iMR's scalability, ability to understand incomplete results, and improve fidelity under load through load shedding techniques.


