This document summarizes research on an inkjet-printed graphene-based flexible humidity sensor. Key points:
- Researchers from MIMOS Berhad developed a humidity sensor consisting of an interdigitated electrode made from reduced graphene oxide and silver nanoparticle ink, with graphene oxide as the sensing material, printed on a flexible polyethylene terephthalate substrate.
- The graphene oxide sensing material's dielectric constant changes with humidity, allowing the sensor to detect humidity levels based on capacitance measurements.
- Testing showed the sensor achieved a highest sensitivity of 0.15pF/%RH at 50°C, with a linear response at low humidity and exponential increase above 60%RH. It also demonstrated good temperature dependence below
![2020 IEEE International Conference on Semiconductor Electronics (ICSE)
978-1-7281-5968-3/20/$31.00 ©2020 IEEE
Inkjet-Printed Graphene-based Flexible Humidity
Sensor for Environmental Applications
Suraya Sulaiman
Nanoelectronics Lab
MIMOS Berhad
Kuala Lumpur, Malaysia
suraya.sulaiman@mimos.my
Nora’zah Abdul Rashid
Nanoelectronics Lab
MIMOS Berhad
Kuala Lumpur, Malaysia
norazah@mimos.my
Aiman Sajidah Abdul Aziz
Nanoelectronics Lab
MIMOS Berhad
Kuala Lumpur, Malaysia
aiman.sajidah@mimos.my
Liew Qiao Jun
Nanoelectronics Lab
MIMOS Berhad
Kuala Lumpur, Malaysia
qj.liew@mimos.my
Syed Muhammad Hafiz Syed Mohd Jaafar
Nanoelectronics Lab
MIMOS Berhad
Kuala Lumpur, Malaysia
hafiz.jaafar@mimos.my
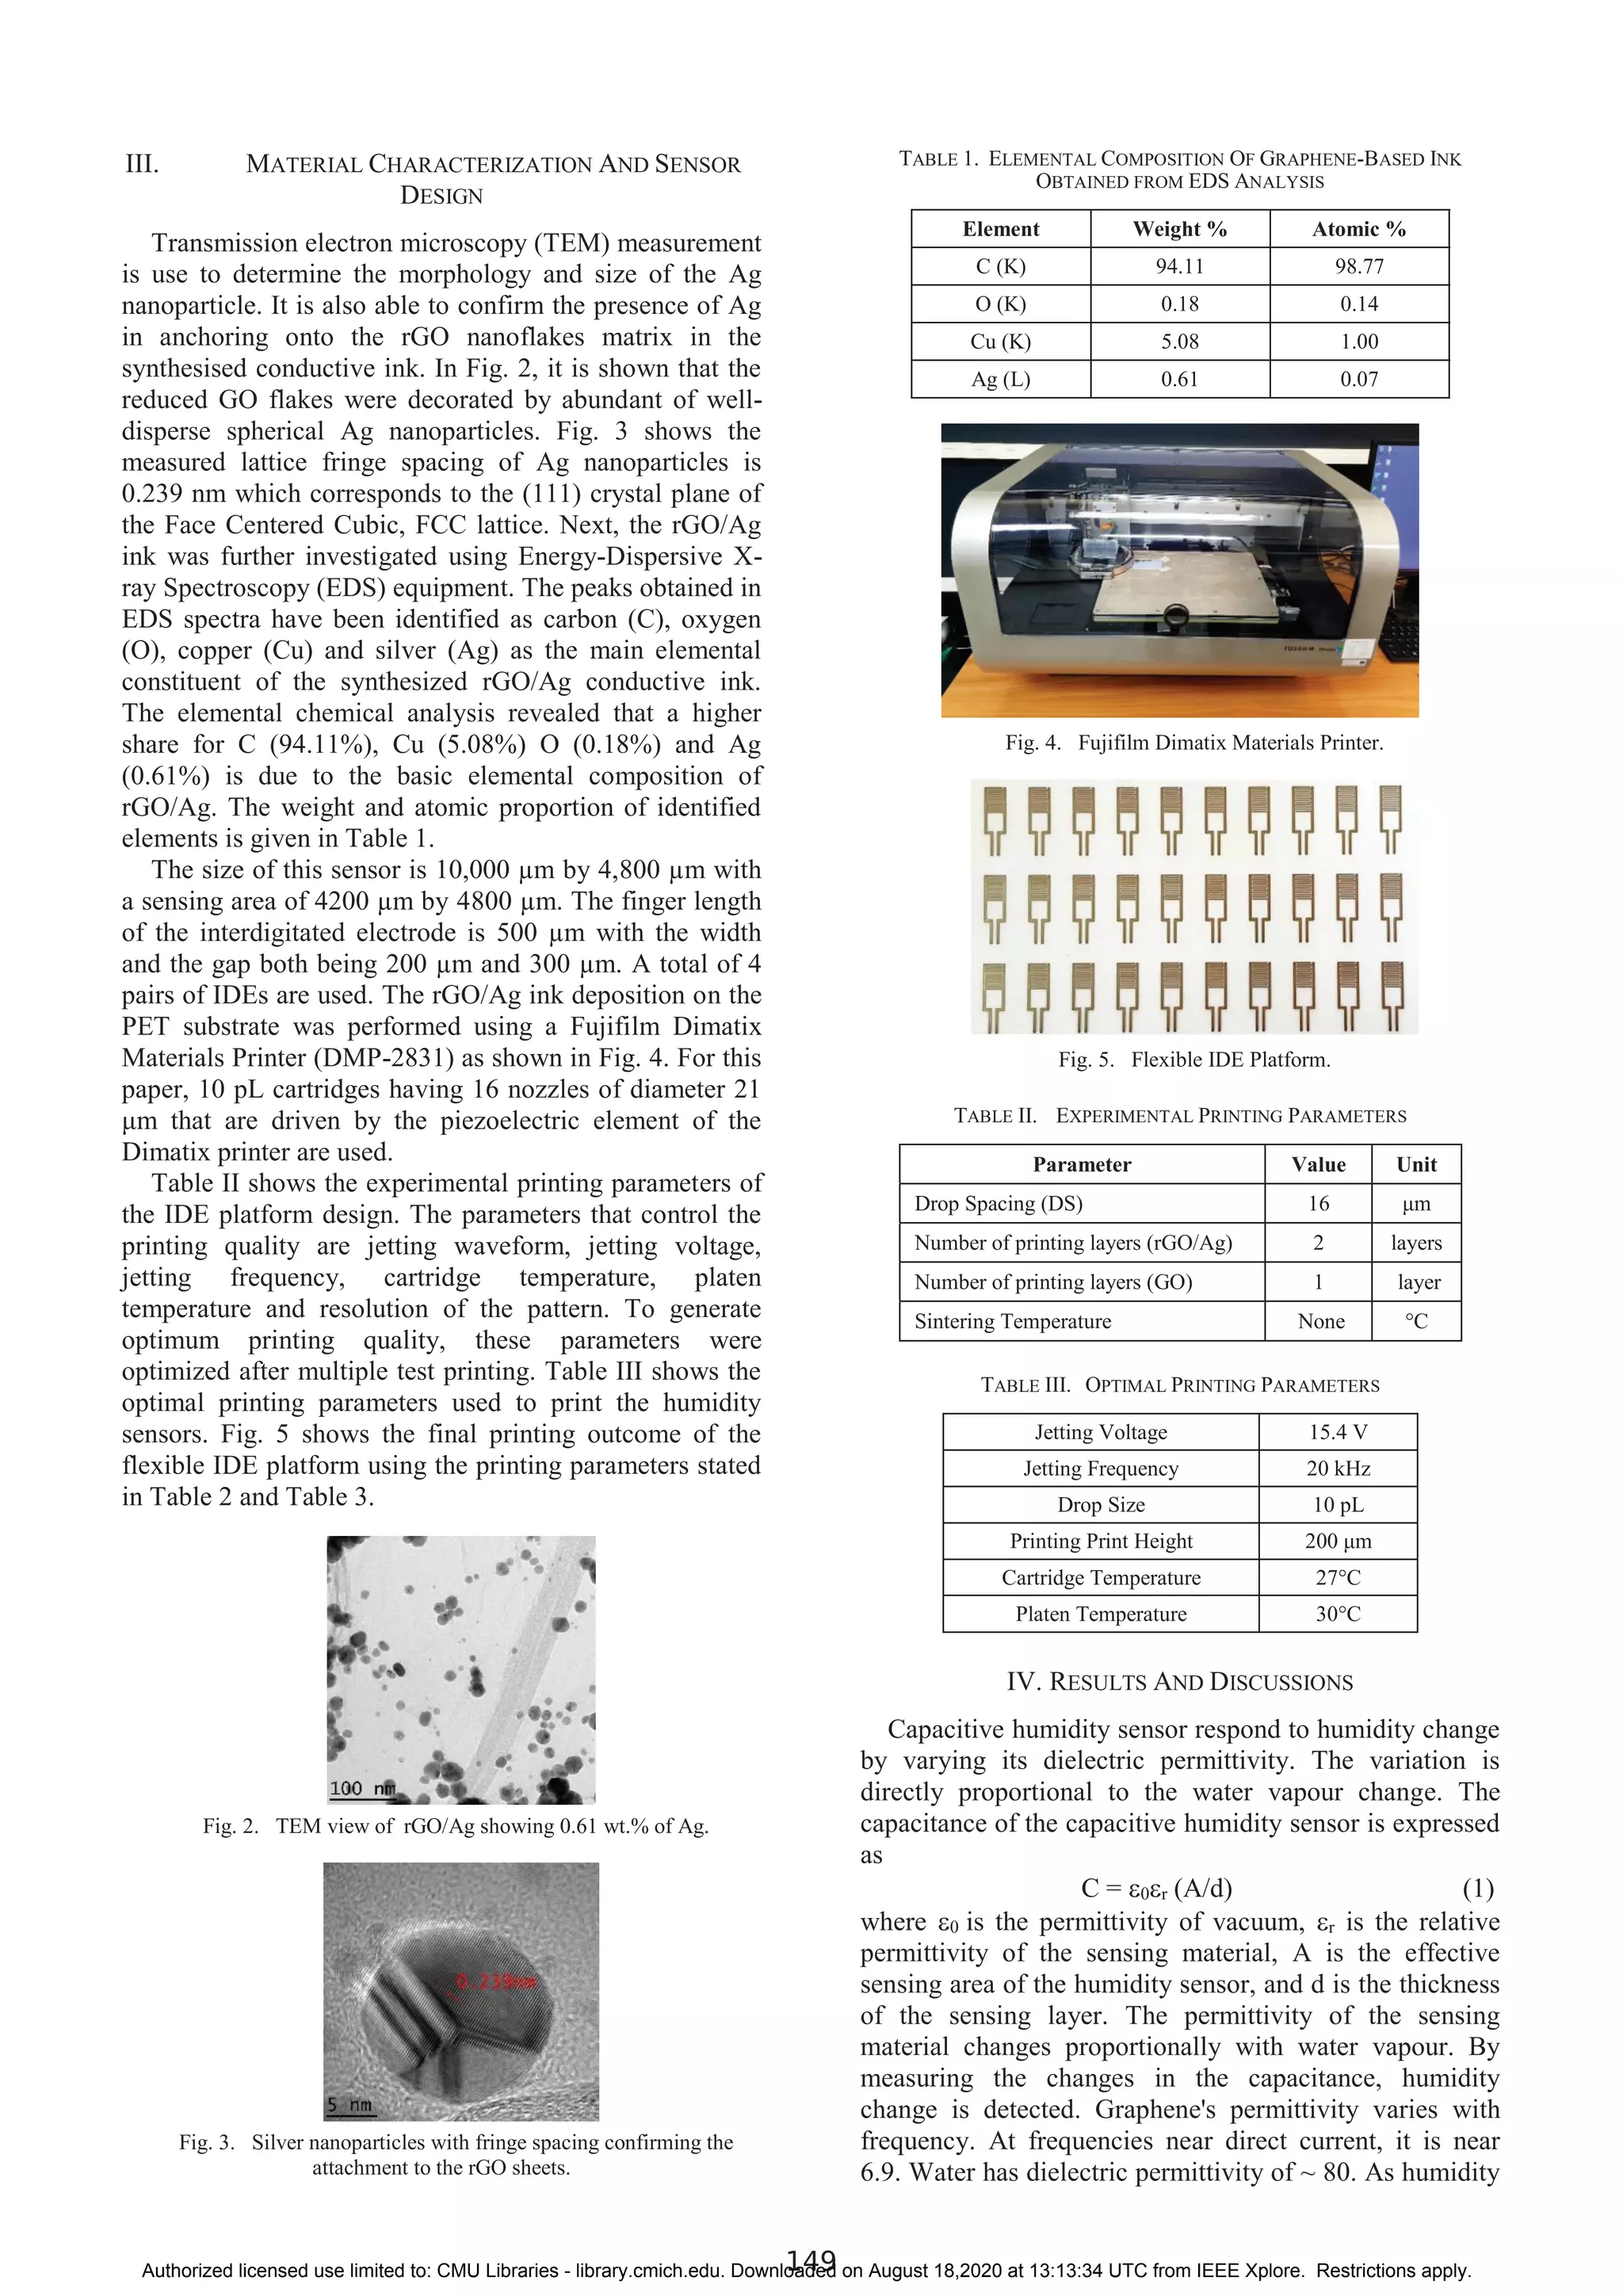
Abstract—In this study, a fully flexible inkjet-printed
graphene-based capacitive humidity sensor is investigated
using graphene oxide (GO) as sensing material mixed with
Polyacrylic Acid, PAA. The printed humidity sensor consists
of i) an optimally designed interdigitated electrode (IDE)
made from reduced graphene oxide conductive ink material
decorated with silver nanoparticle (rGO/Ag), ii) inkjet-
printed GO as sensing material and iii) polyethylene
terephthalate, PET as flexible substrate. The conductive ink
is synthesize in house with a stable and consistent
temperature setting which has successfully improve the yield
performance of the graphene-based inkjet and the method of
preparation has prevent the ink from agglomeration during
printing. The multilayer inkjet-printed GO on top of the
rGO/Ag IDE is employ to increase the contact area between
the sensing layer and water vapor, thus leading to a high
sensitivity sensor. The results shows that as the relative
humidity is varies in the range of 30%RH to 90%RH, the
proposed humidity sensor is able to achieve a highest
sensitivity of 0.15pF/%RH at 50°C. The sensor show a stable
capacitance value with a linear output at low humidity and
increase exponentially at above 60%RH. The developed
sensor also show a good temperature dependence at
temperature below 60°C and humidity lower than 70%RH.
Keywords—flexible; printed; multilayer; graphene;
humidity
I. INTRODUCTION
The high demand for future electronic devices,
particularly on wearable device, seek a huge demand for
new production and manufacturing methods beyond the
traditional semiconductor cleanroom processes, which are
typically achieved at vacuum and high temperature
condition. In view of that, inkjet printing with the use of
nano-based conductive inks offers a high potential to
support the development of the next generation wearable
electronic devices due to its lower cost, low temperature,
less complex and vacuum-less process technologies.
The development of printing technology with the
formulation of a new simple, low-cost conductive ink
material will enable the production of a range of functional
sensors and electronics devices including humidity
sensors. Humidity sensors have been widely used in our
daily lives and become increasingly important in many
applications such as meteorology, agriculture, smart
homes, medical equipment, and biotechnology [1–4].
Various types of humidity sensors are available, based on
different measurement principles such as resistive,
capacitive, optical, acoustic, and thermal techniques.
Among them all, the capacitive devices are preferred due
to their high sensitivity, linearity, accuracy, fast response
time, and negligible temperature dependent. Most of these
capacitive sensors are based on the dielectric changes in
the sensing layer upon water vapour uptake as a measure
of the water vapour content in the environment.
II. SENSING PRINCIPLES
This paper propose a flexible, high-sensitivity and low-
hysteresis printed capacitive humidity sensor consists of
inkjet-printed IDE and GO as the sensing materials. This
capacitive humidity sensors utilize GO as the sensing
material which reacts to the environmental changes when
the surfaces adsorb water molecules. The change in
capacitance is directly in relation to the water
concentration or humidity in the environment. The IDE,
acting as the electrical conductor, is printed using
conductive rGO/Ag materials while the sensing material is
printed on top of the IDE to form the high-sensitivity
flexible humidity sensor as shown in Fig. 1 below. Here,
the sensor platform is equipped by inserting the inkjet-
printed sensor into a connector which is soldered to PCB
board that was attached with Harwin connector for use in
sensing test later.
Fig. 1. Samples of inkjet-printed graphene-based flexible humidity
sensor.
148
Authorized licensed use limited to: CMU Libraries - library.cmich.edu. Downloaded on August 18,2020 at 13:13:34 UTC from IEEE Xplore. Restrictions apply.](https://image.slidesharecdn.com/inkjet-printedgraphene-basedflexiblehumiditysensorforenvironmentalapplications-211207073834/75/Inkjet-printed-graphene-based-flexible-humidity-sensor-for-environmental-applications-1-2048.jpg)
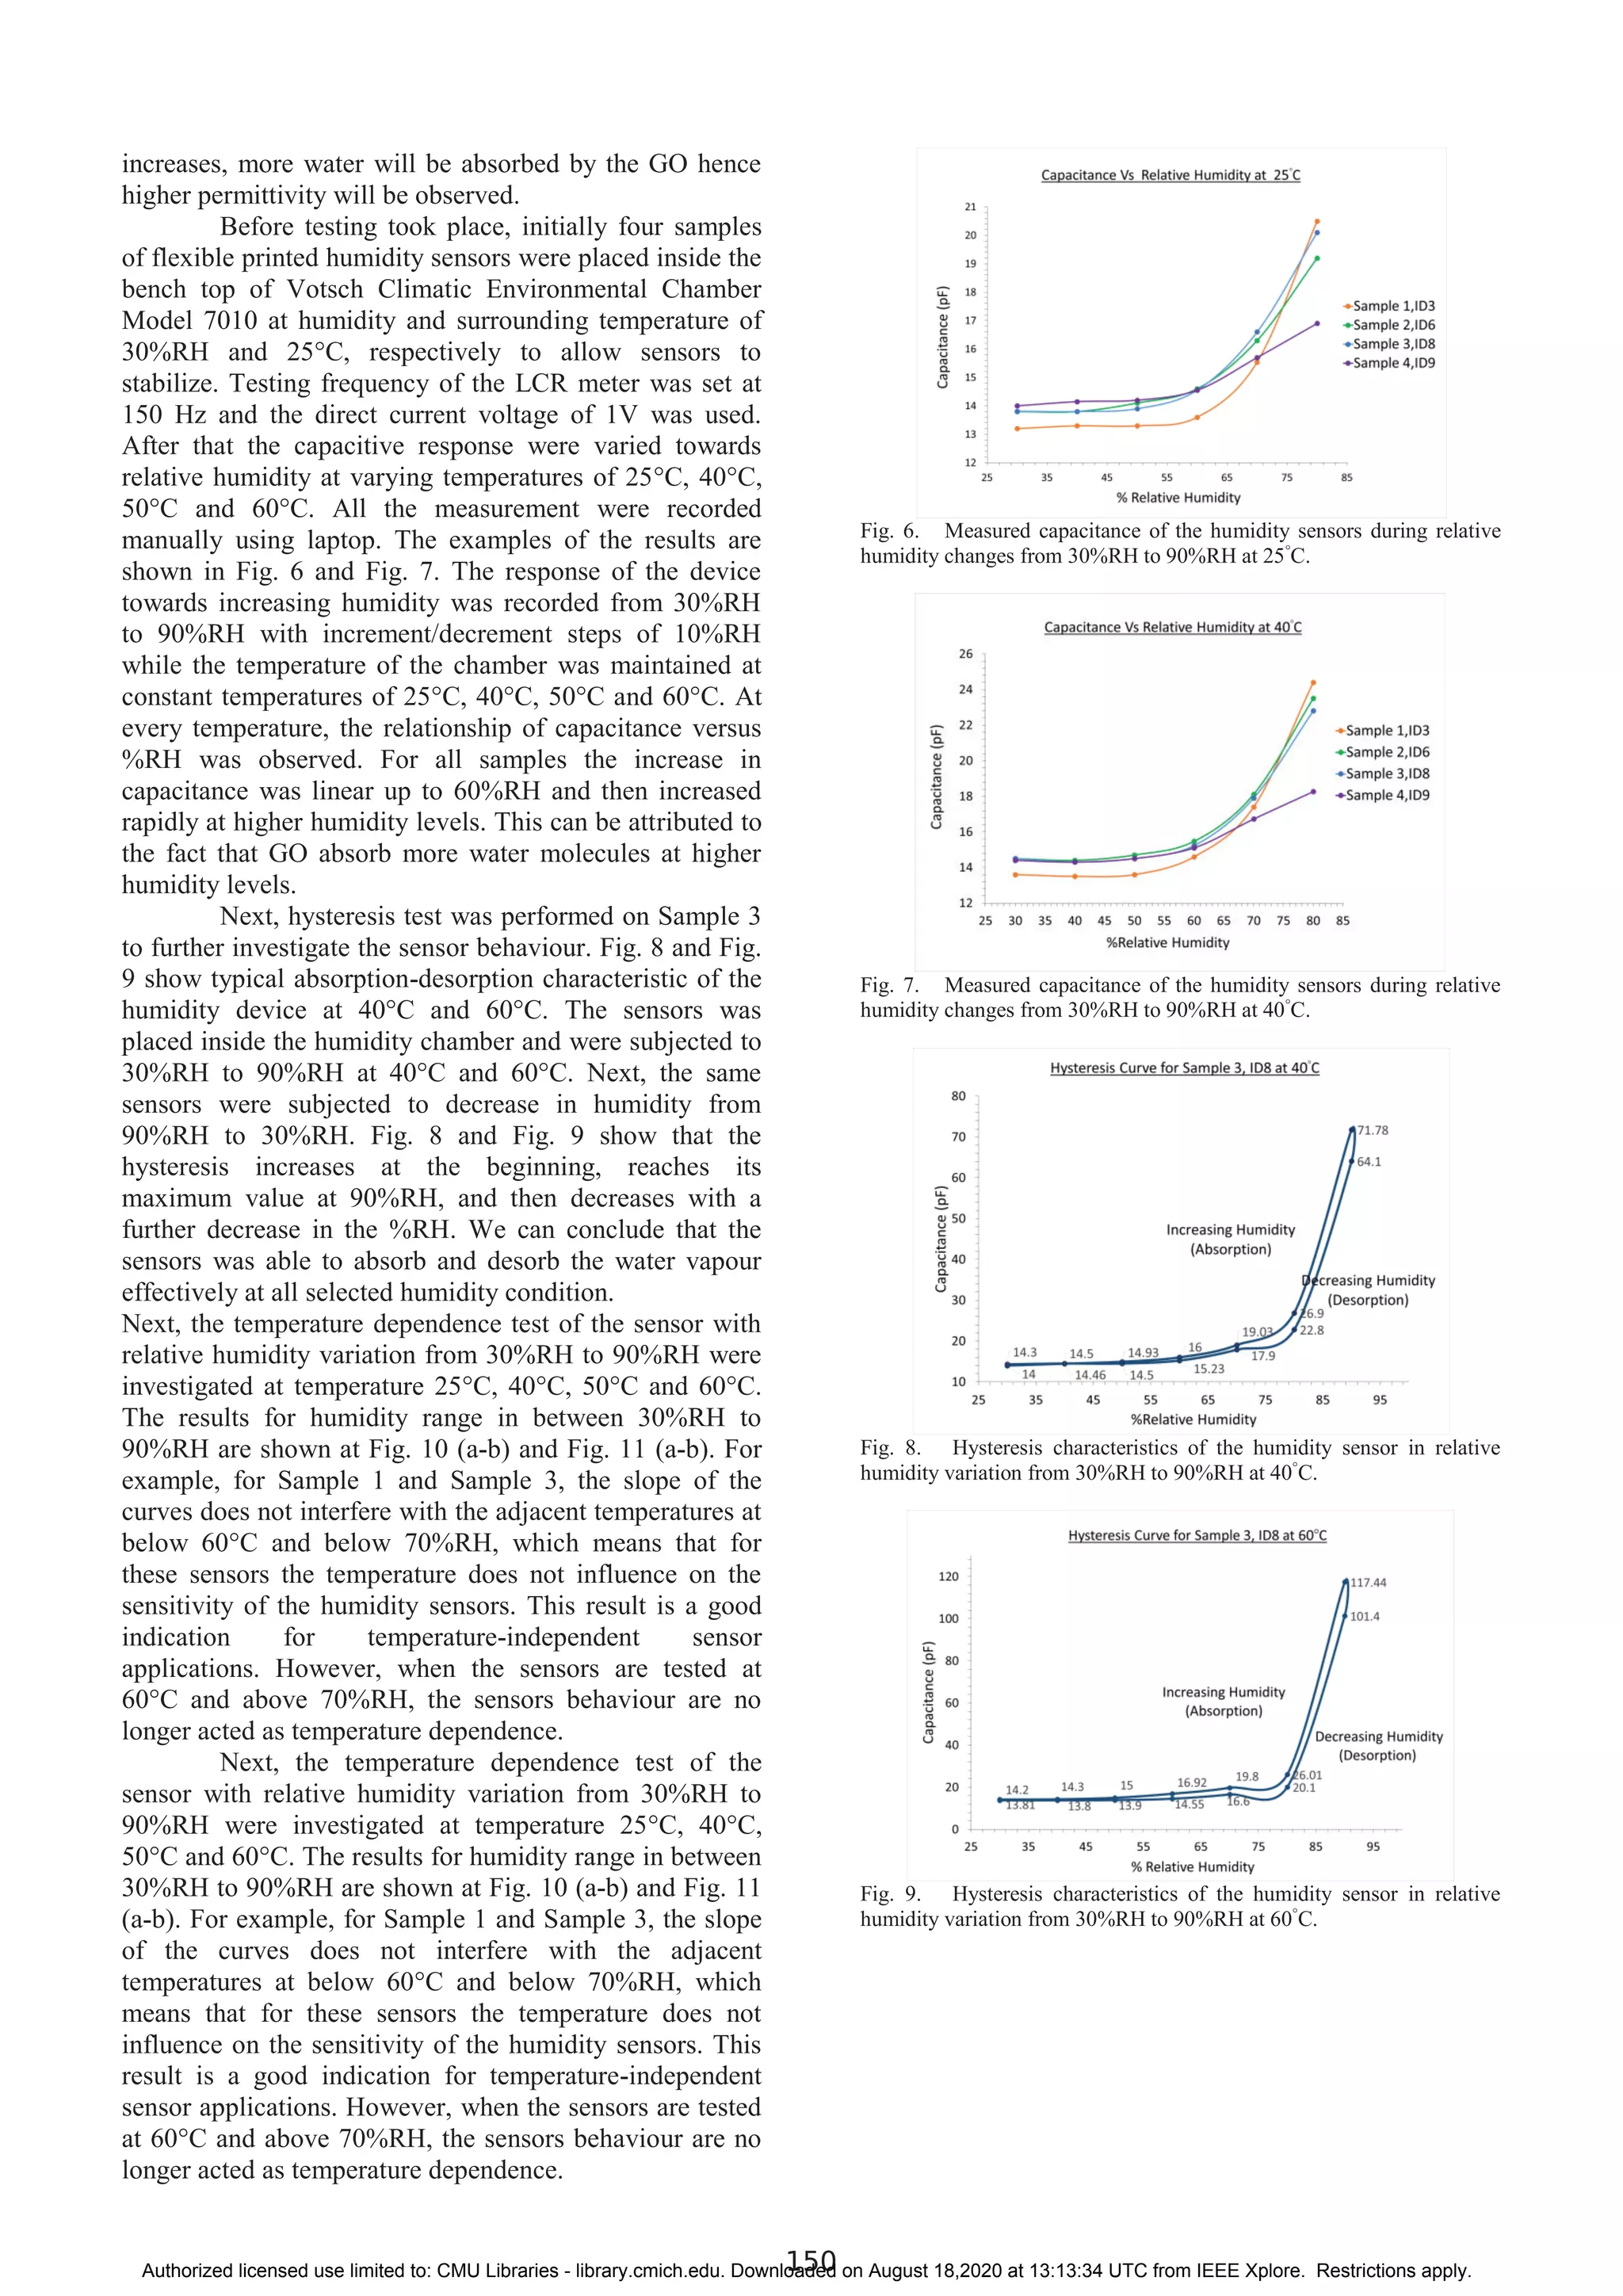
![Fig. 10 (a)
Fig. 10 (b)
Fig.10. (a) Temperature dependence of the humidity sensor measured at
below 70%RH, at 25°C, 40°C, 50°C and 60°C for Sample 1 and (b)
Temperature dependence of the humidity sensor measured at below
70%RH, at 25°C, 40°C, 50°C and 60°C for Sample 3.
Fig. 11 (a)
Fig. 11 (b)
Fig.11. (a) Temperature dependence of the humidity sensor measured
over 70%RH, at 25°C, 40°C, 50°C and 60°C for Sample 1 and (b)
Temperature dependence of the humidity sensor measured over 70%RH,
at 25°C, 40°C, 50°C and 60°C for Sample 3.
Next, the sensitivity, S of the humidity sensors can be
expressed as;
S = C90 – C30 (pF/%RH) (2)
90 – 30
where C90 and C30 denote the capacitance obtained at
90%RH and 30%RH, respectively [5]. The 90 and 30
values are the highest and lowest relative humidity values
in the variation range, respectively. Fig. 12 shows the
sensitivity of humidity sensors at different temperature
variation for all sensors. From the histogram, sample 4
can be concluded as the most sensitive sensor. The results
show that as the relative humidity ranges from 30%RH to
90%RH, the proposed humidity sensors are able to
achieve a high sensitivity of 0.15pF/%RH at 50°C.
Fig. 12. Sensitivity of humidity sensor at temperature range between
25°C to 60°C.
V. CONCLUSIONS
In summary, a fully flexible ink-jet printed graphene-
based capacitive humidity sensor is investigated and
successfully demonstrated working at certain humidity
and temperature range. The humidity-sensitive layer
composed of a GO layer is successfully printed on IDE
platform which manage to simplify the fabrication process
of a conventional humidity sensor. During actual testing,
this paper demonstrated a sensor with a high sensitivity of
0.15pF/%RH at 50°C for Sample 4 with stable
capacitance value with an exponential output ranging
from 30%RH to 90%RH. It has been shown that the
developed sensor is also independent of temperature
change at temperature less than 60°C and humidity level
below 70%RH. More process optimization and
investigation need to be carried out later to improve the
sensor performance which include sensing thickness
optimization and optimum printing quality.
REFERENCES
[1] Chen, Z.; Lu, C. Humidity sensors: a review08p of materials and
mechanisms. Sensor Lett. 2005, 3, 274–295.[CrossRef]
[2] Lee, C.W.; Lee, S.J.; Kim, M.; Kyung, Y.; Eom, K. Capacitive
humidity sensor tag smart refrigerator system using the capacitive to
voltage converter. Int. J. Adv. Sci. Technol. 2011, 36, 15–25.
[3] Farahani, H.; Wagiran, R.; Hamidon, M.N. Humidity sensors
principle, mechanism, and fabrication technologies: a comprehensive
review. Sensors 2014, 14, 7881–7939. [CrossRef]
[4] Feng, Y.; Xie, L.; Chen, Q.; Zheng, L.R. Low-cost printed chipless
RFID humidity sensor tag for intelligent packaging. IEEE Sens. J. 2015,
15, 3201–3208. [CrossRef]
[5] Liu, M.Q; Wang, C.; Kim N.Y.; High-Sensitivity and Low-
Hysteresis Porous MIM-Type Capacitive Hum idity Sensor Using
Functional Polymer Mixed with TiO2 Microparticles. Sensors 2017, 17,
284, 1-11.
151
Authorized licensed use limited to: CMU Libraries - library.cmich.edu. Downloaded on August 18,2020 at 13:13:34 UTC from IEEE Xplore. Restrictions apply.](https://image.slidesharecdn.com/inkjet-printedgraphene-basedflexiblehumiditysensorforenvironmentalapplications-211207073834/75/Inkjet-printed-graphene-based-flexible-humidity-sensor-for-environmental-applications-4-2048.jpg)


![Review of different approach in humidity sensing [Autosaved].pptx](https://cdn.slidesharecdn.com/ss_thumbnails/reviewofdifferentapproachinhumiditysensingautosaved-230129064137-34f33641-thumbnail.jpg?width=640&height=640&fit=bounds)


![Coded Agents – with UiPath SDK + LangGraph [Virtual Hands-on Workshop]](https://cdn.slidesharecdn.com/ss_thumbnails/codedagentsdeck-251215155422-5497c599-thumbnail.jpg?width=640&height=640&fit=bounds)


