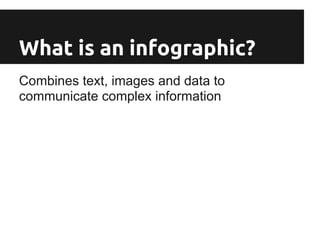
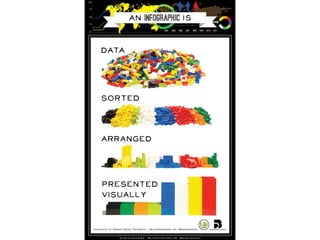
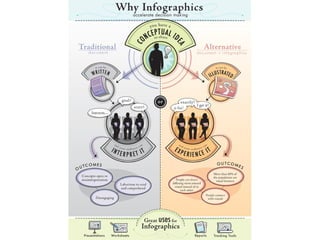
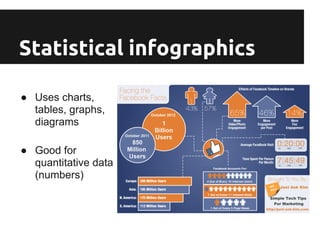
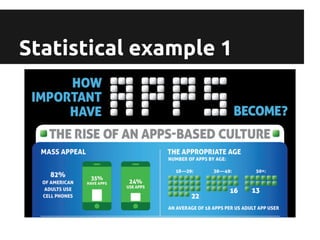
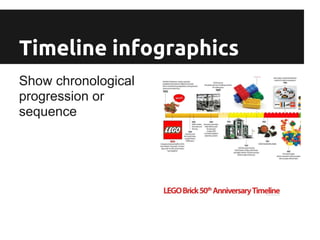
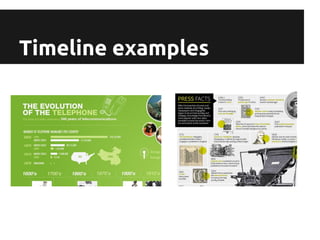
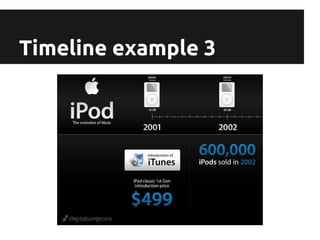
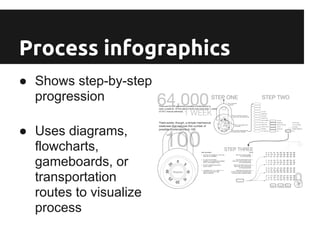
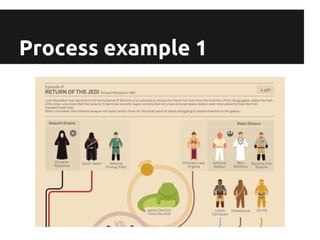
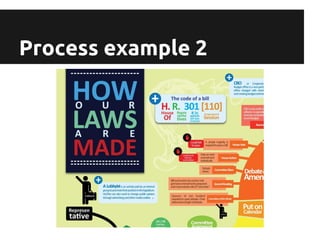
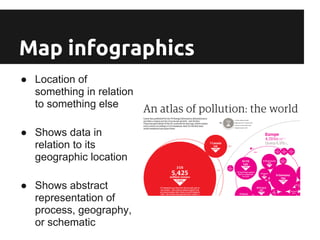
Information
Graphics
a.k.a. Infographics
What is an infographic?
Combines text, images and data to
communicate complex information
Why use infographics?
●   explain intricate information clearly
●   communicate message in appealing way
●   present large amounts of data meaningfully
●   reveal hidden data for the viewer
Types of infographics
●   statistical
●   timelines
●   process
●   map
●   wordcloud
●   infoposter
Statistical infographics

● Uses charts,
  tables, graphs,
  diagrams

● Good for
  quantitative data
  (numbers)
Statistical example 1
Statistical example 2
Timeline infographics
Show chronological
progression or
sequence
Timeline examples
Timeline example 3
Process infographics
● Shows step-by-step
  progression

● Uses diagrams,
  flowcharts,
  gameboards, or
  transportation
  routes to visualize
  process
Process example 1
Process example 2
Map infographics
● Location of
  something in relation
  to something else

● Shows data in
  relation to its
  geographic location

● Shows abstract
  representation of
  process, geography,
  or schematic
Map example 1
Map example 2
Wordcloud infographics
● Analyze
  content of
  speech or
  document

● Can be
  shaped to
  reflect subject
Wordcloud example
Infoposter infographics
●   Uses words and
    numbers to tell a story

●   Incorporates simple
    infographics

●   Collects a variety of
    facts and information in
    one location

●   Represents
    quantitative data
Infoposter example 1
Infoposter example 2
For fun
Analyzing

Infographics introduction