Downloaded 168 times

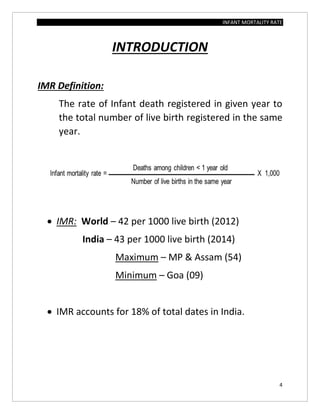

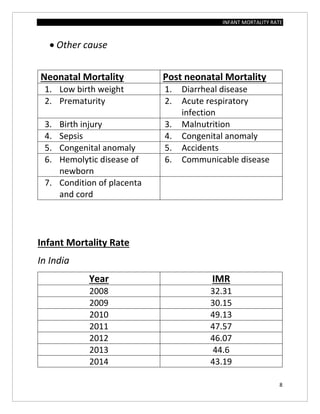
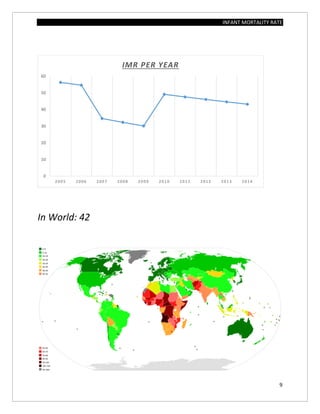
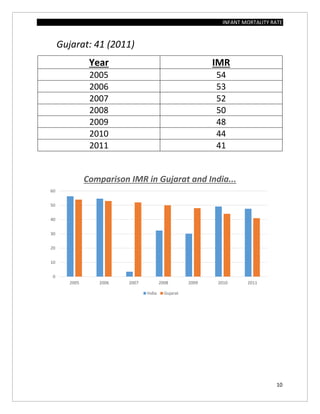
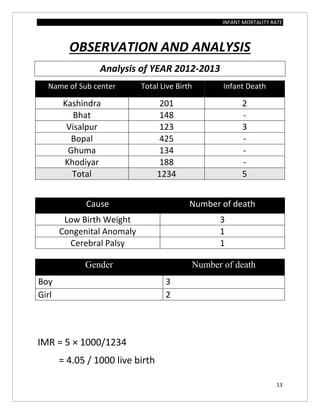
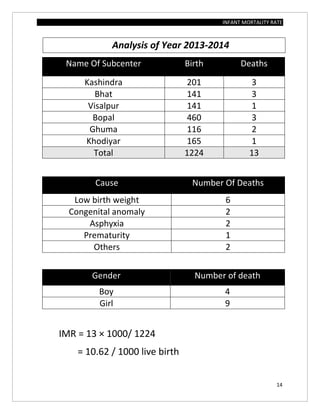
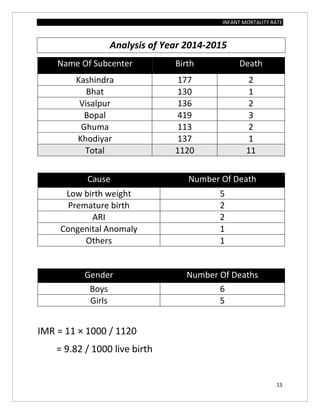
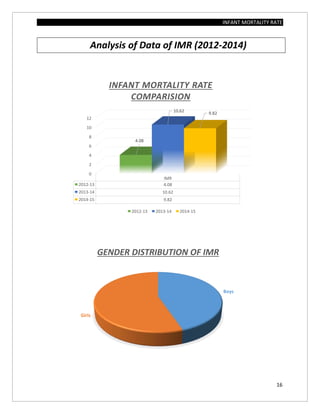
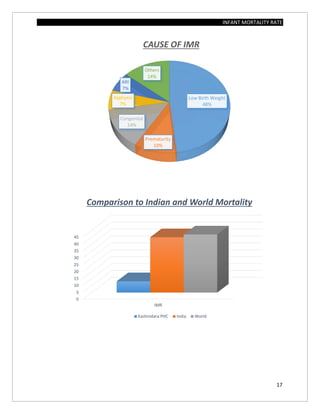

The document assesses the infant mortality rate (IMR) in the PHC area of Kashindra from 2012 to 2014, highlighting various factors contributing to IMR and the effectiveness of government programs aimed at its reduction. It notes the highest IMR in 2013-14 and identifies low birth weight as the most common cause of infant mortality in the area. Recommendations for improvement include better obstetric care, quality of life enhancements, and nutrition.