Downloaded 118 times
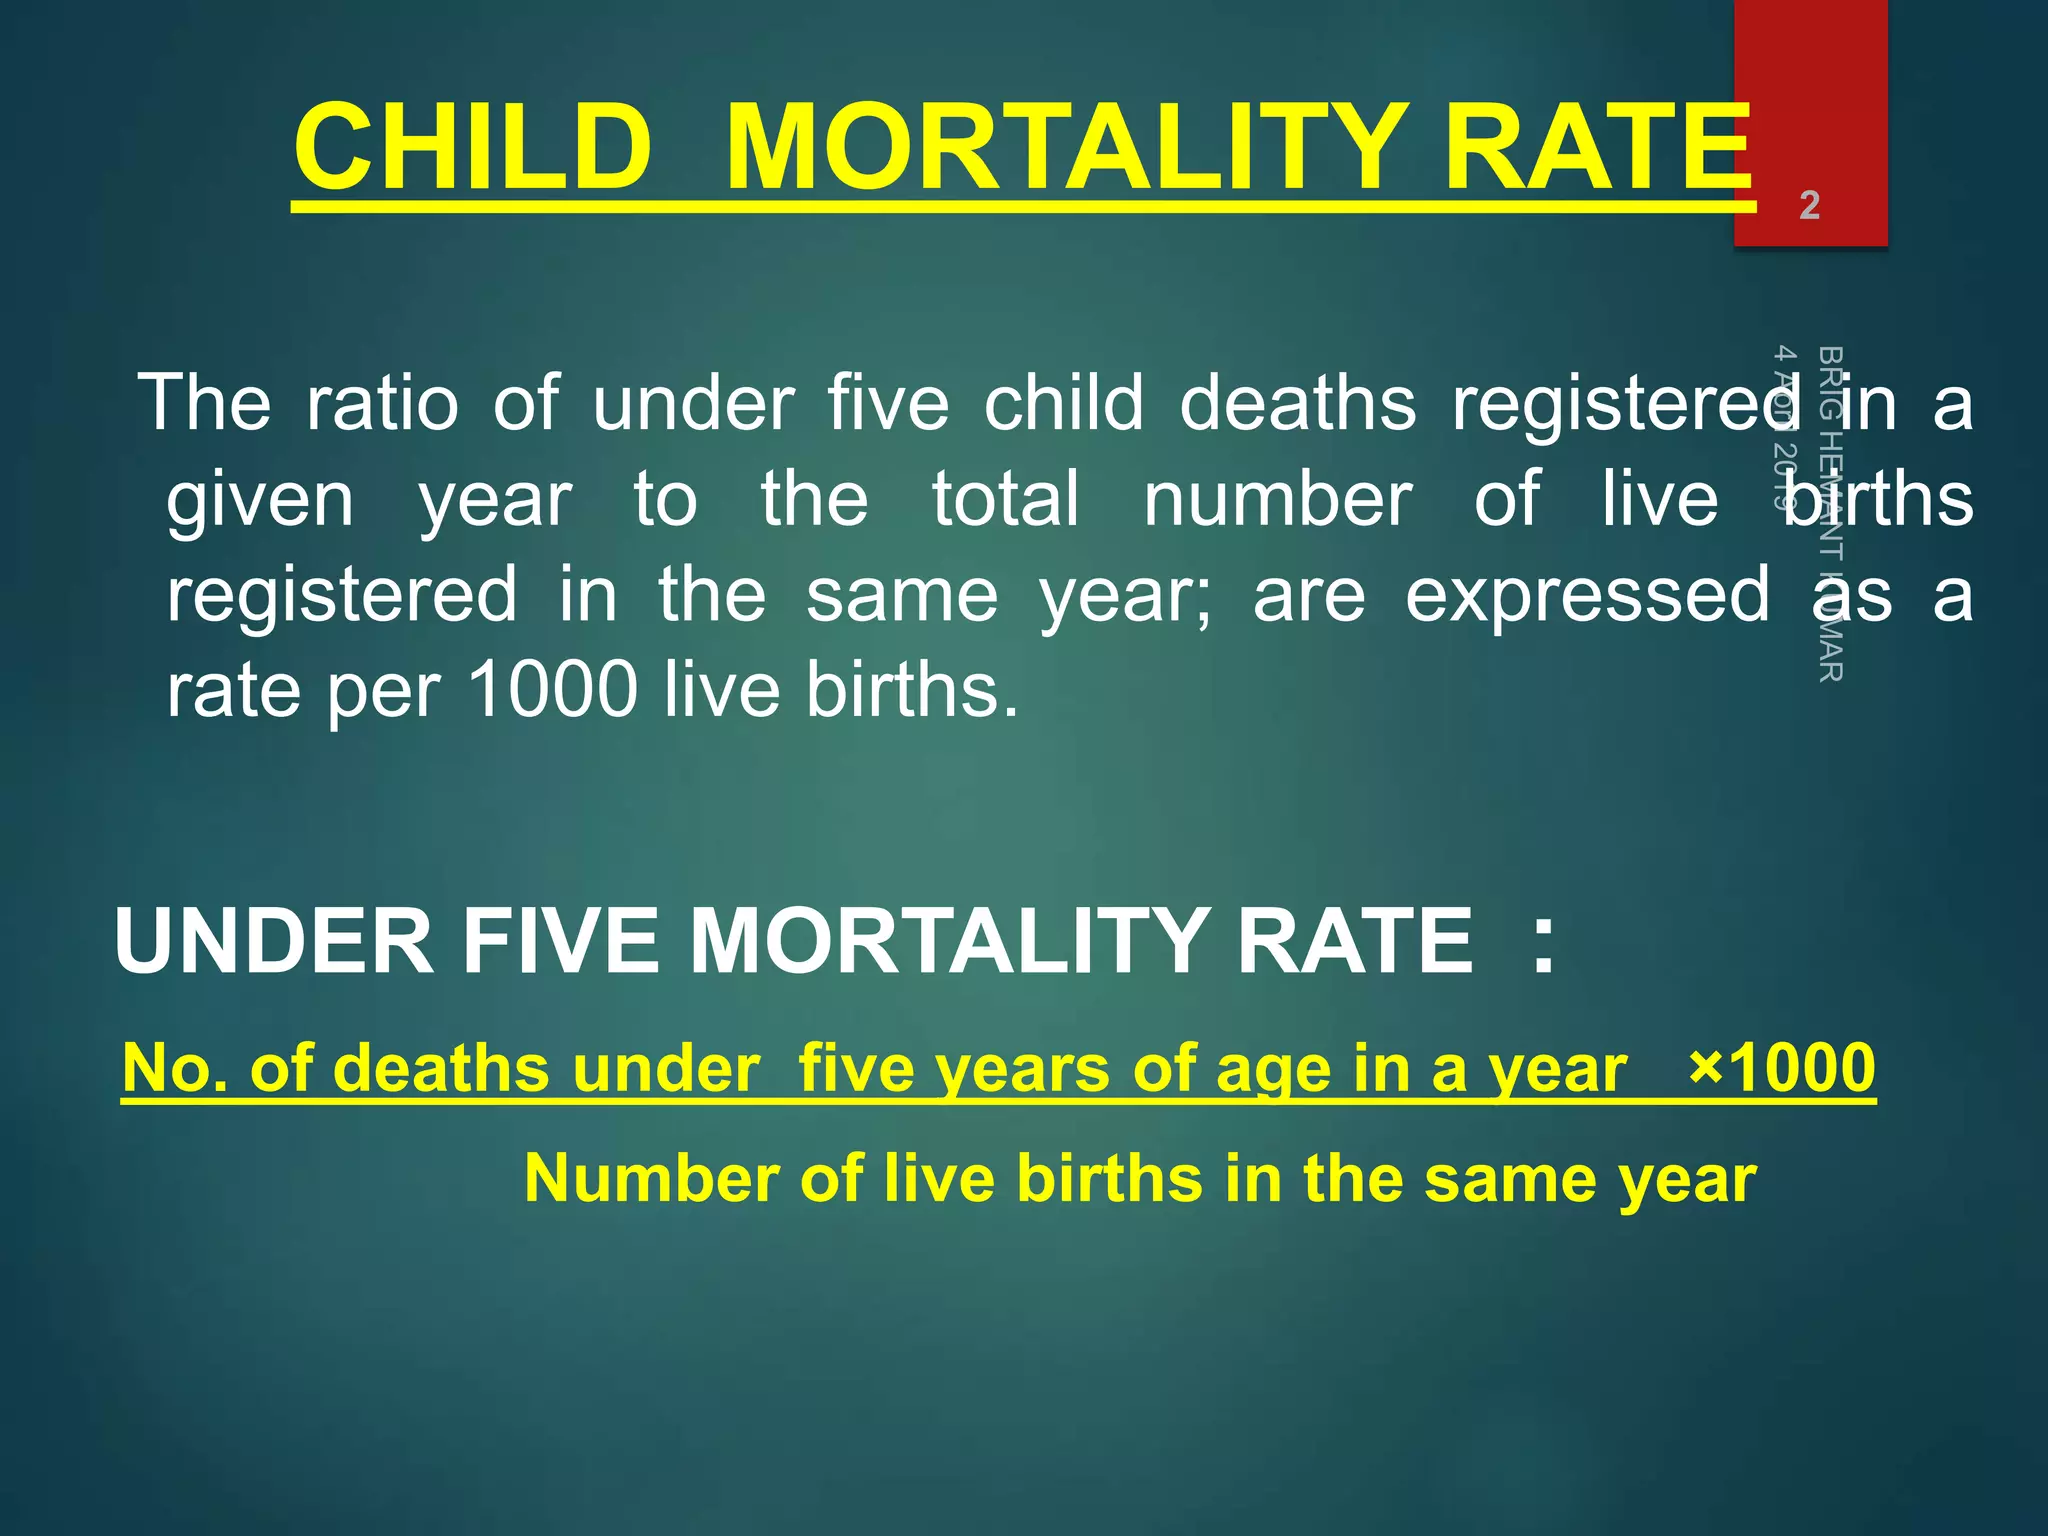
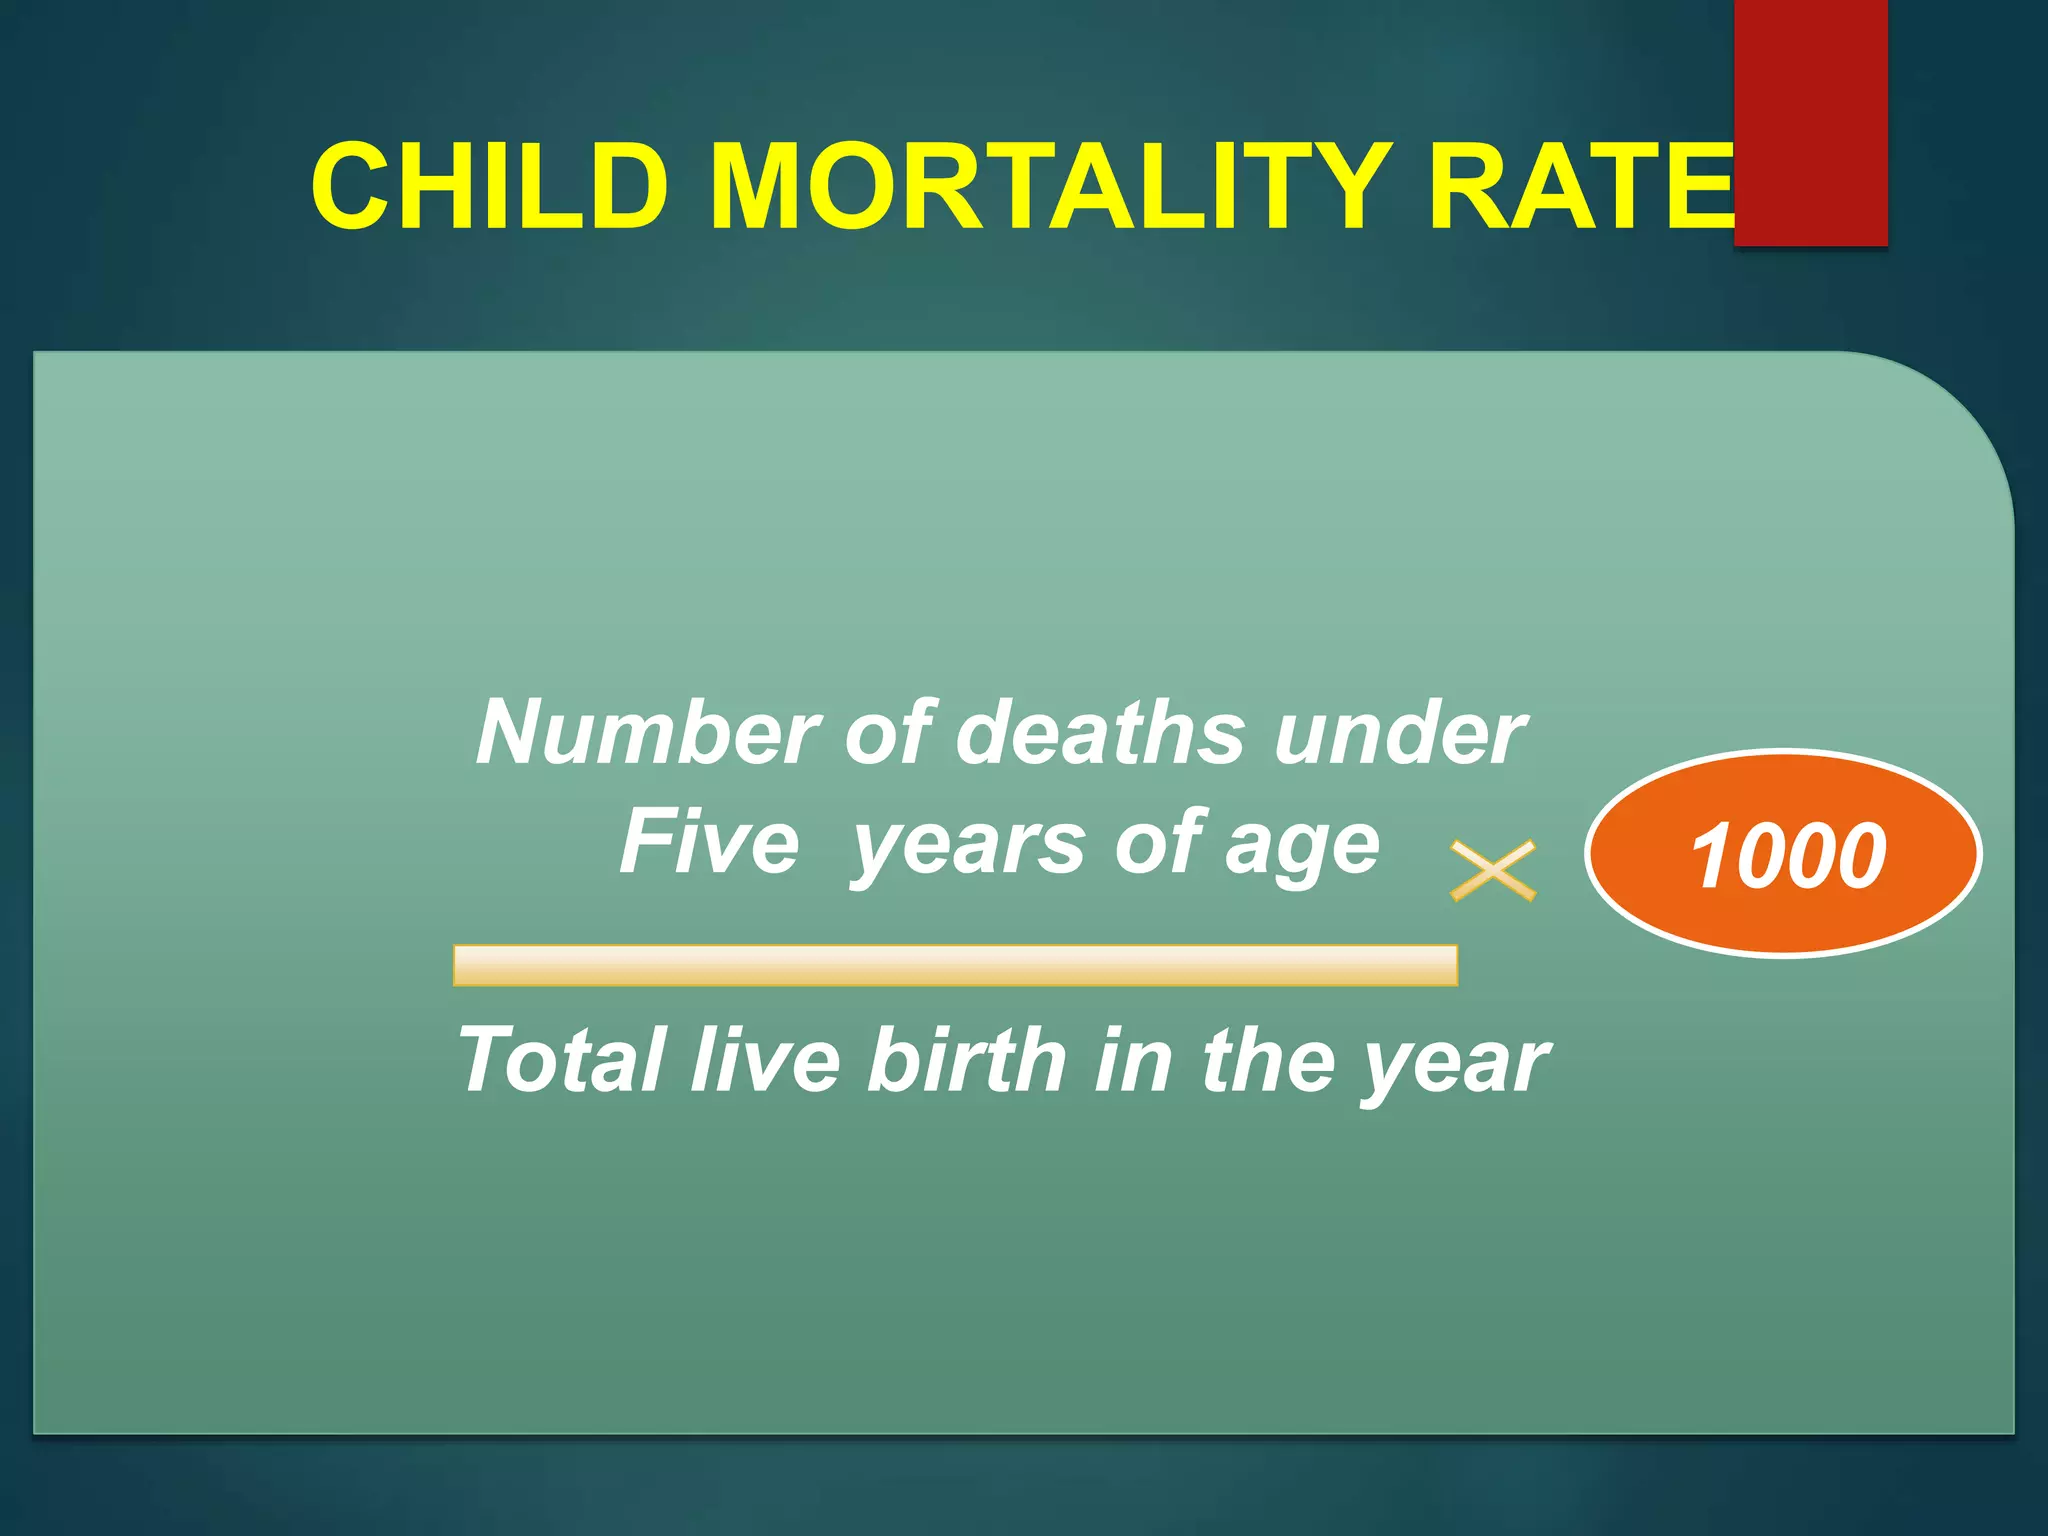

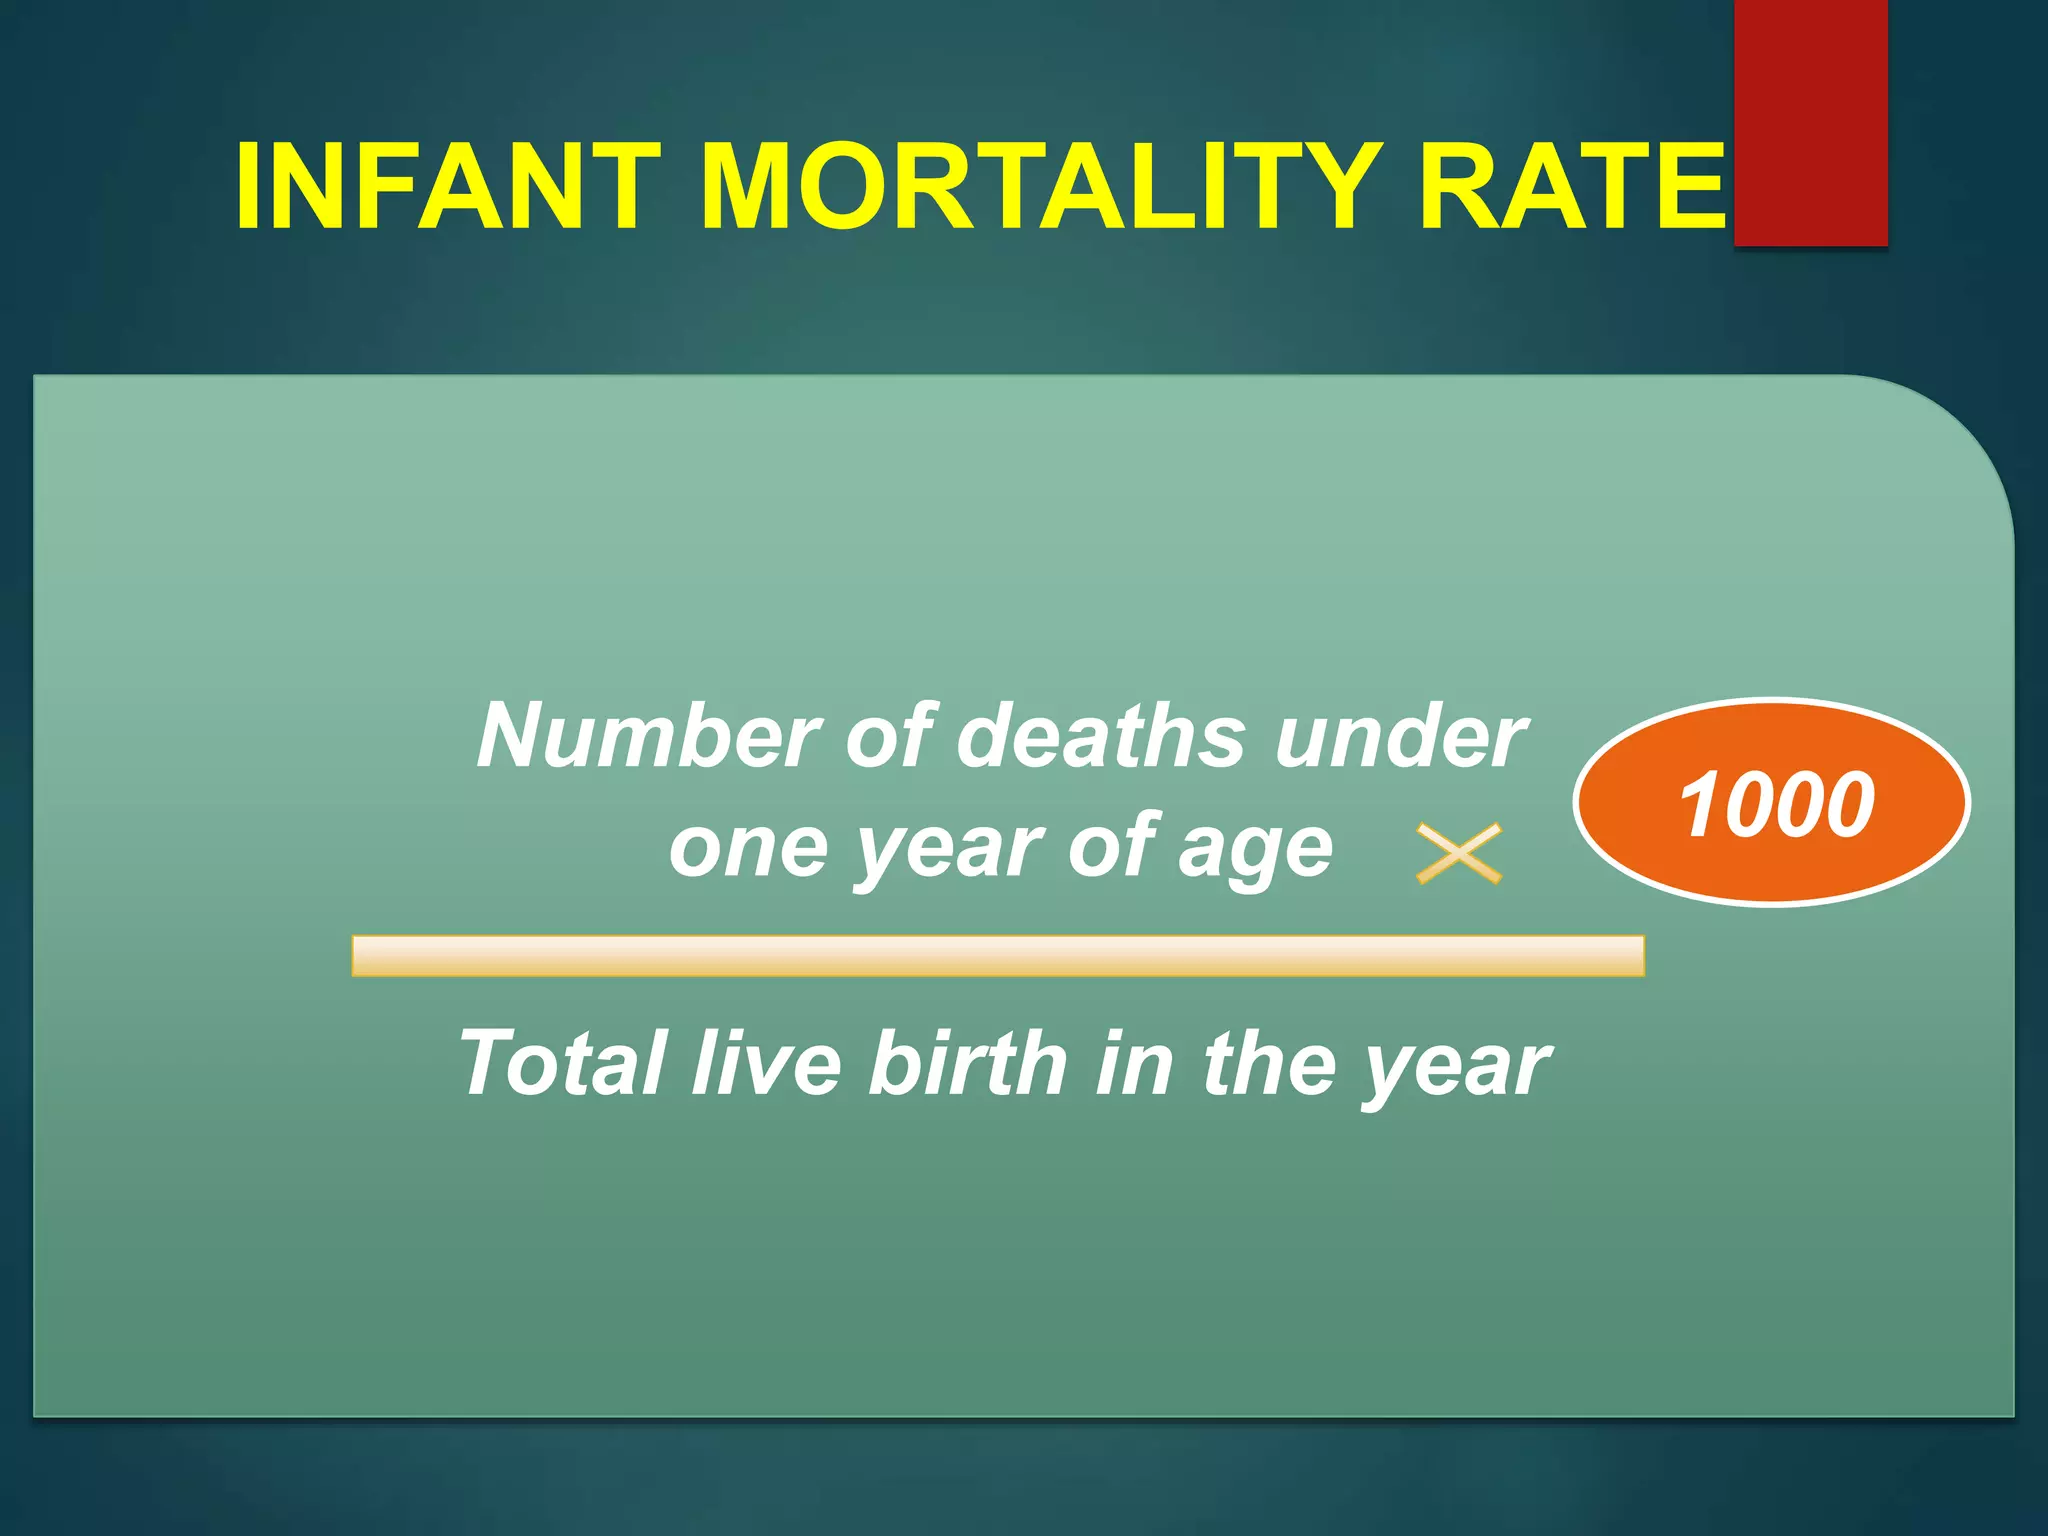
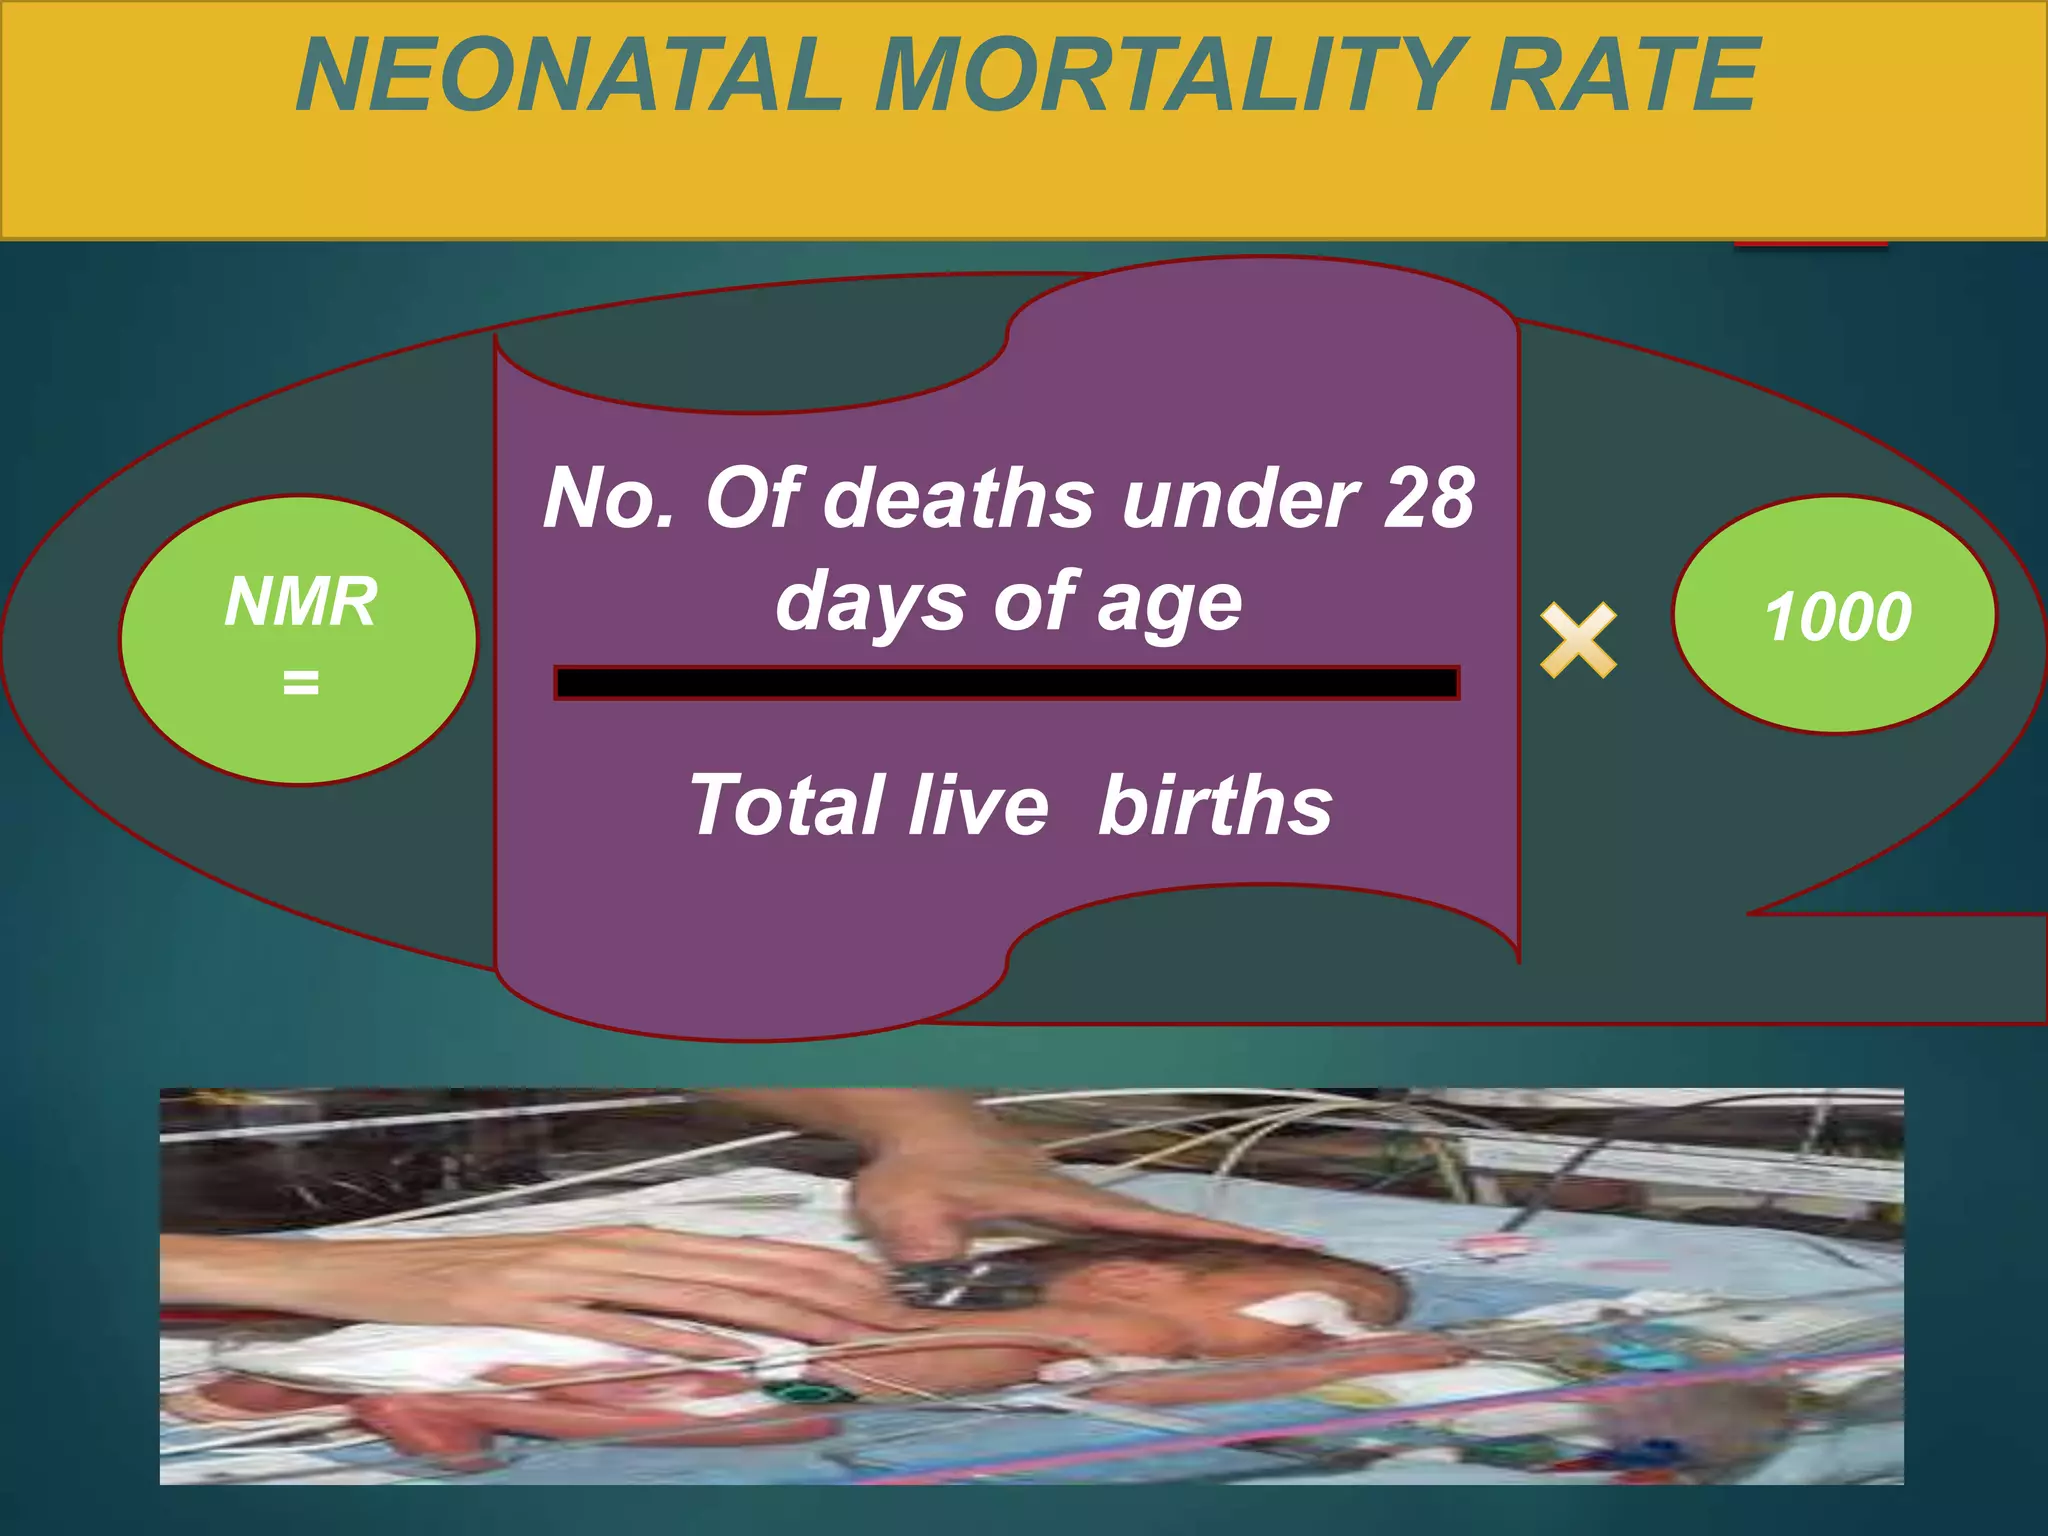


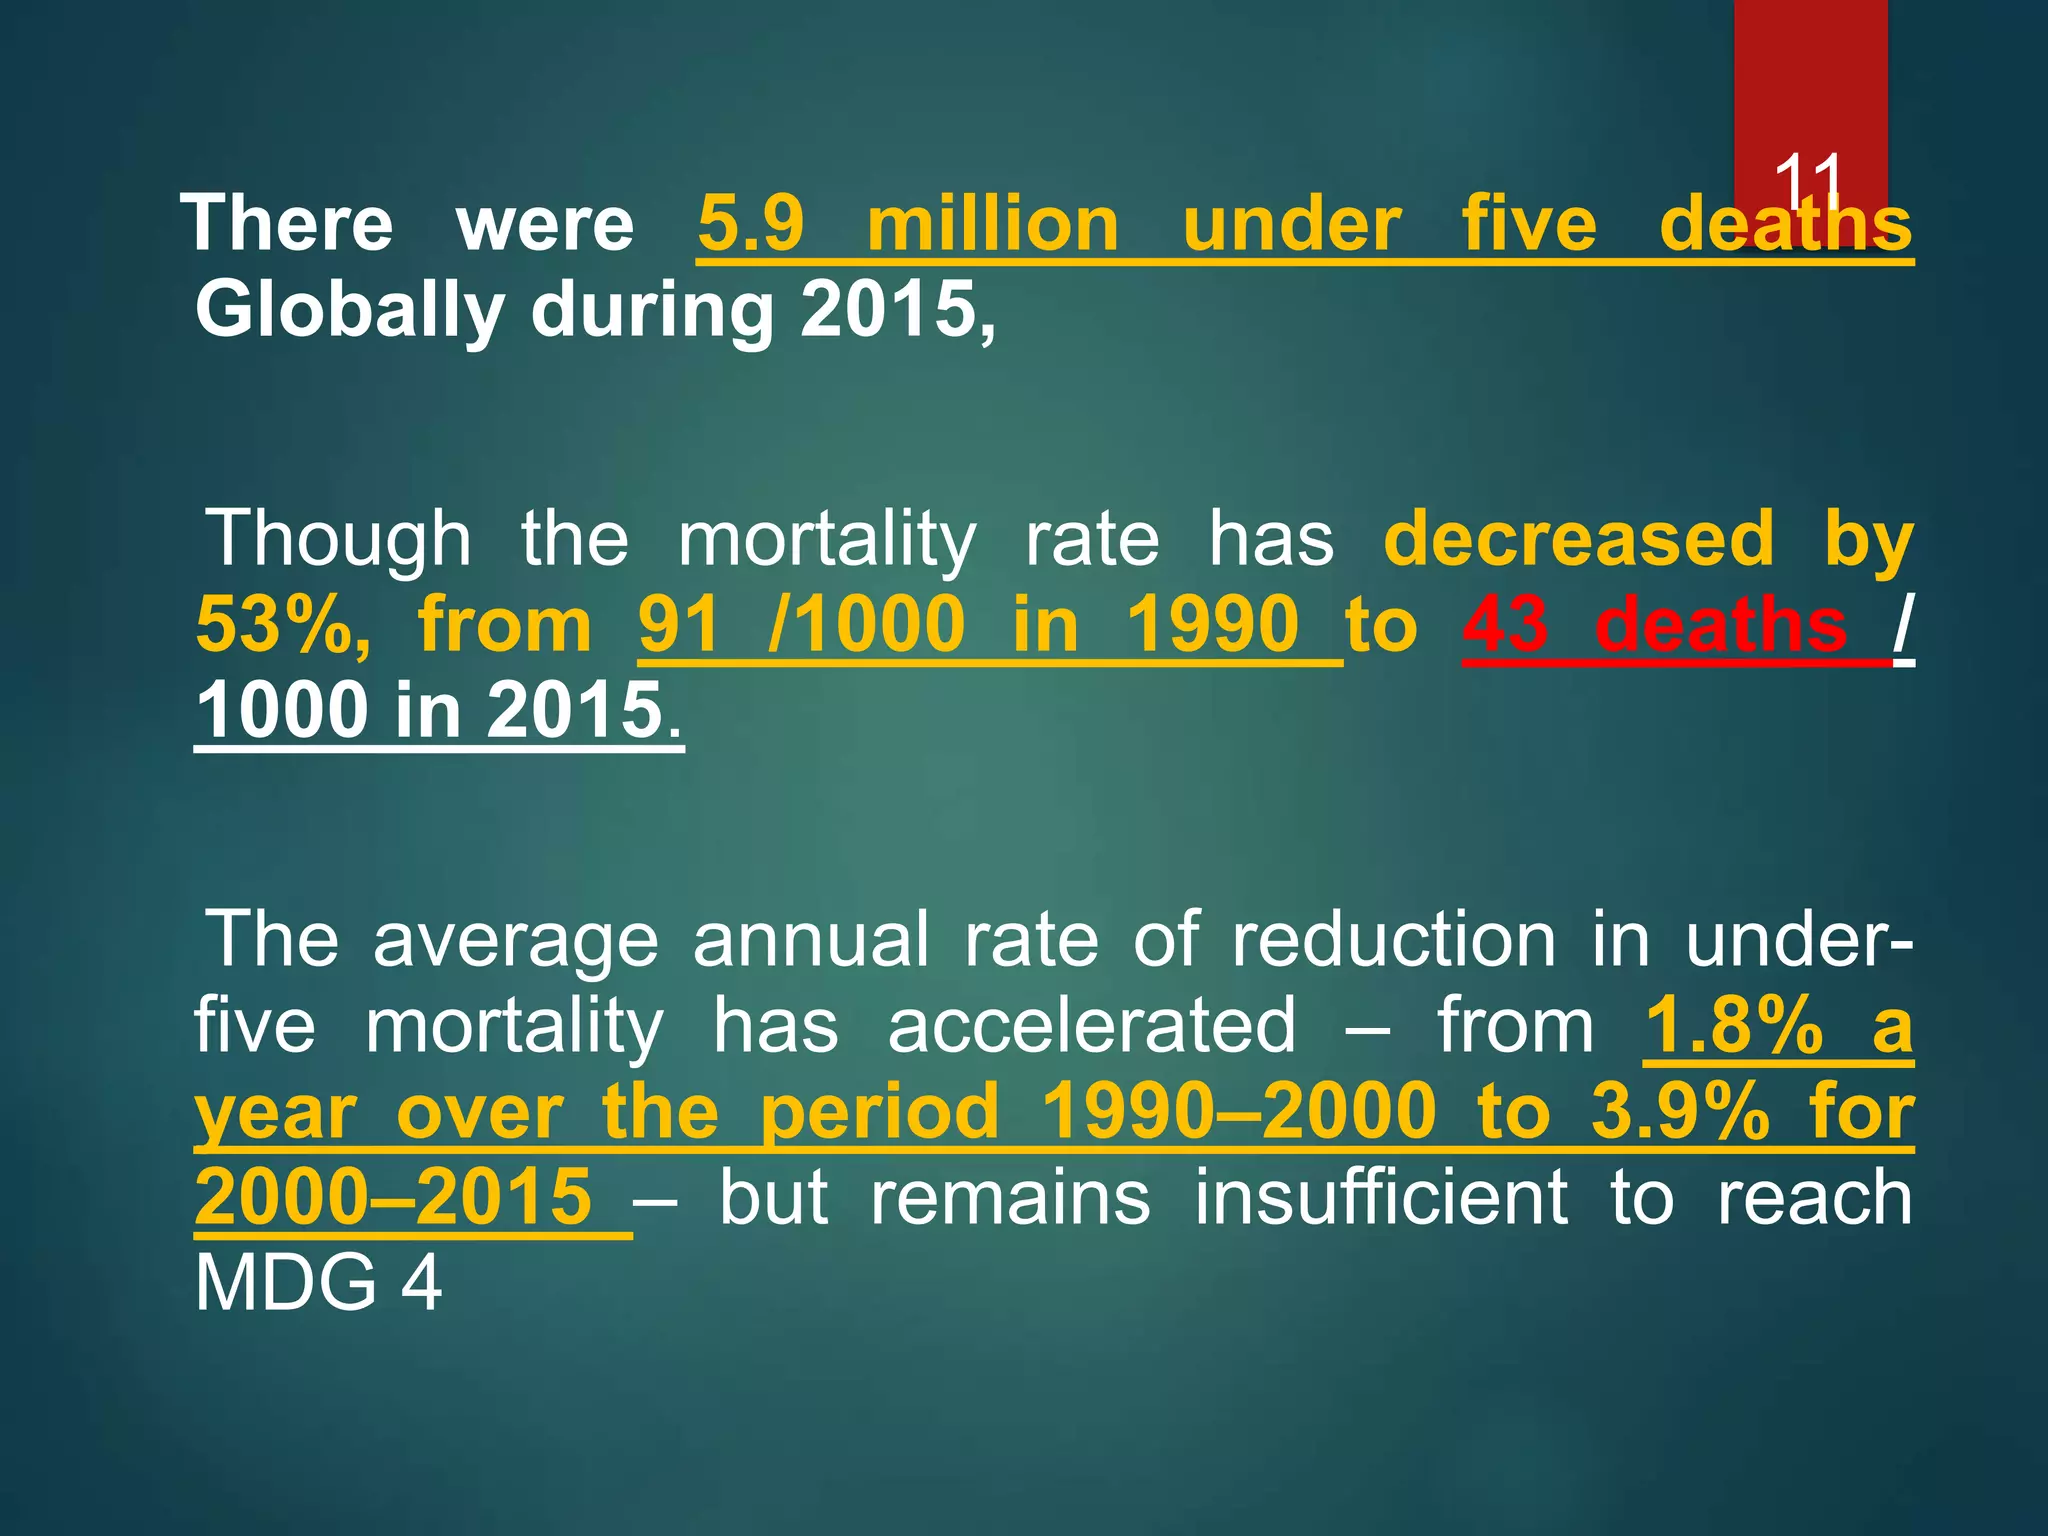


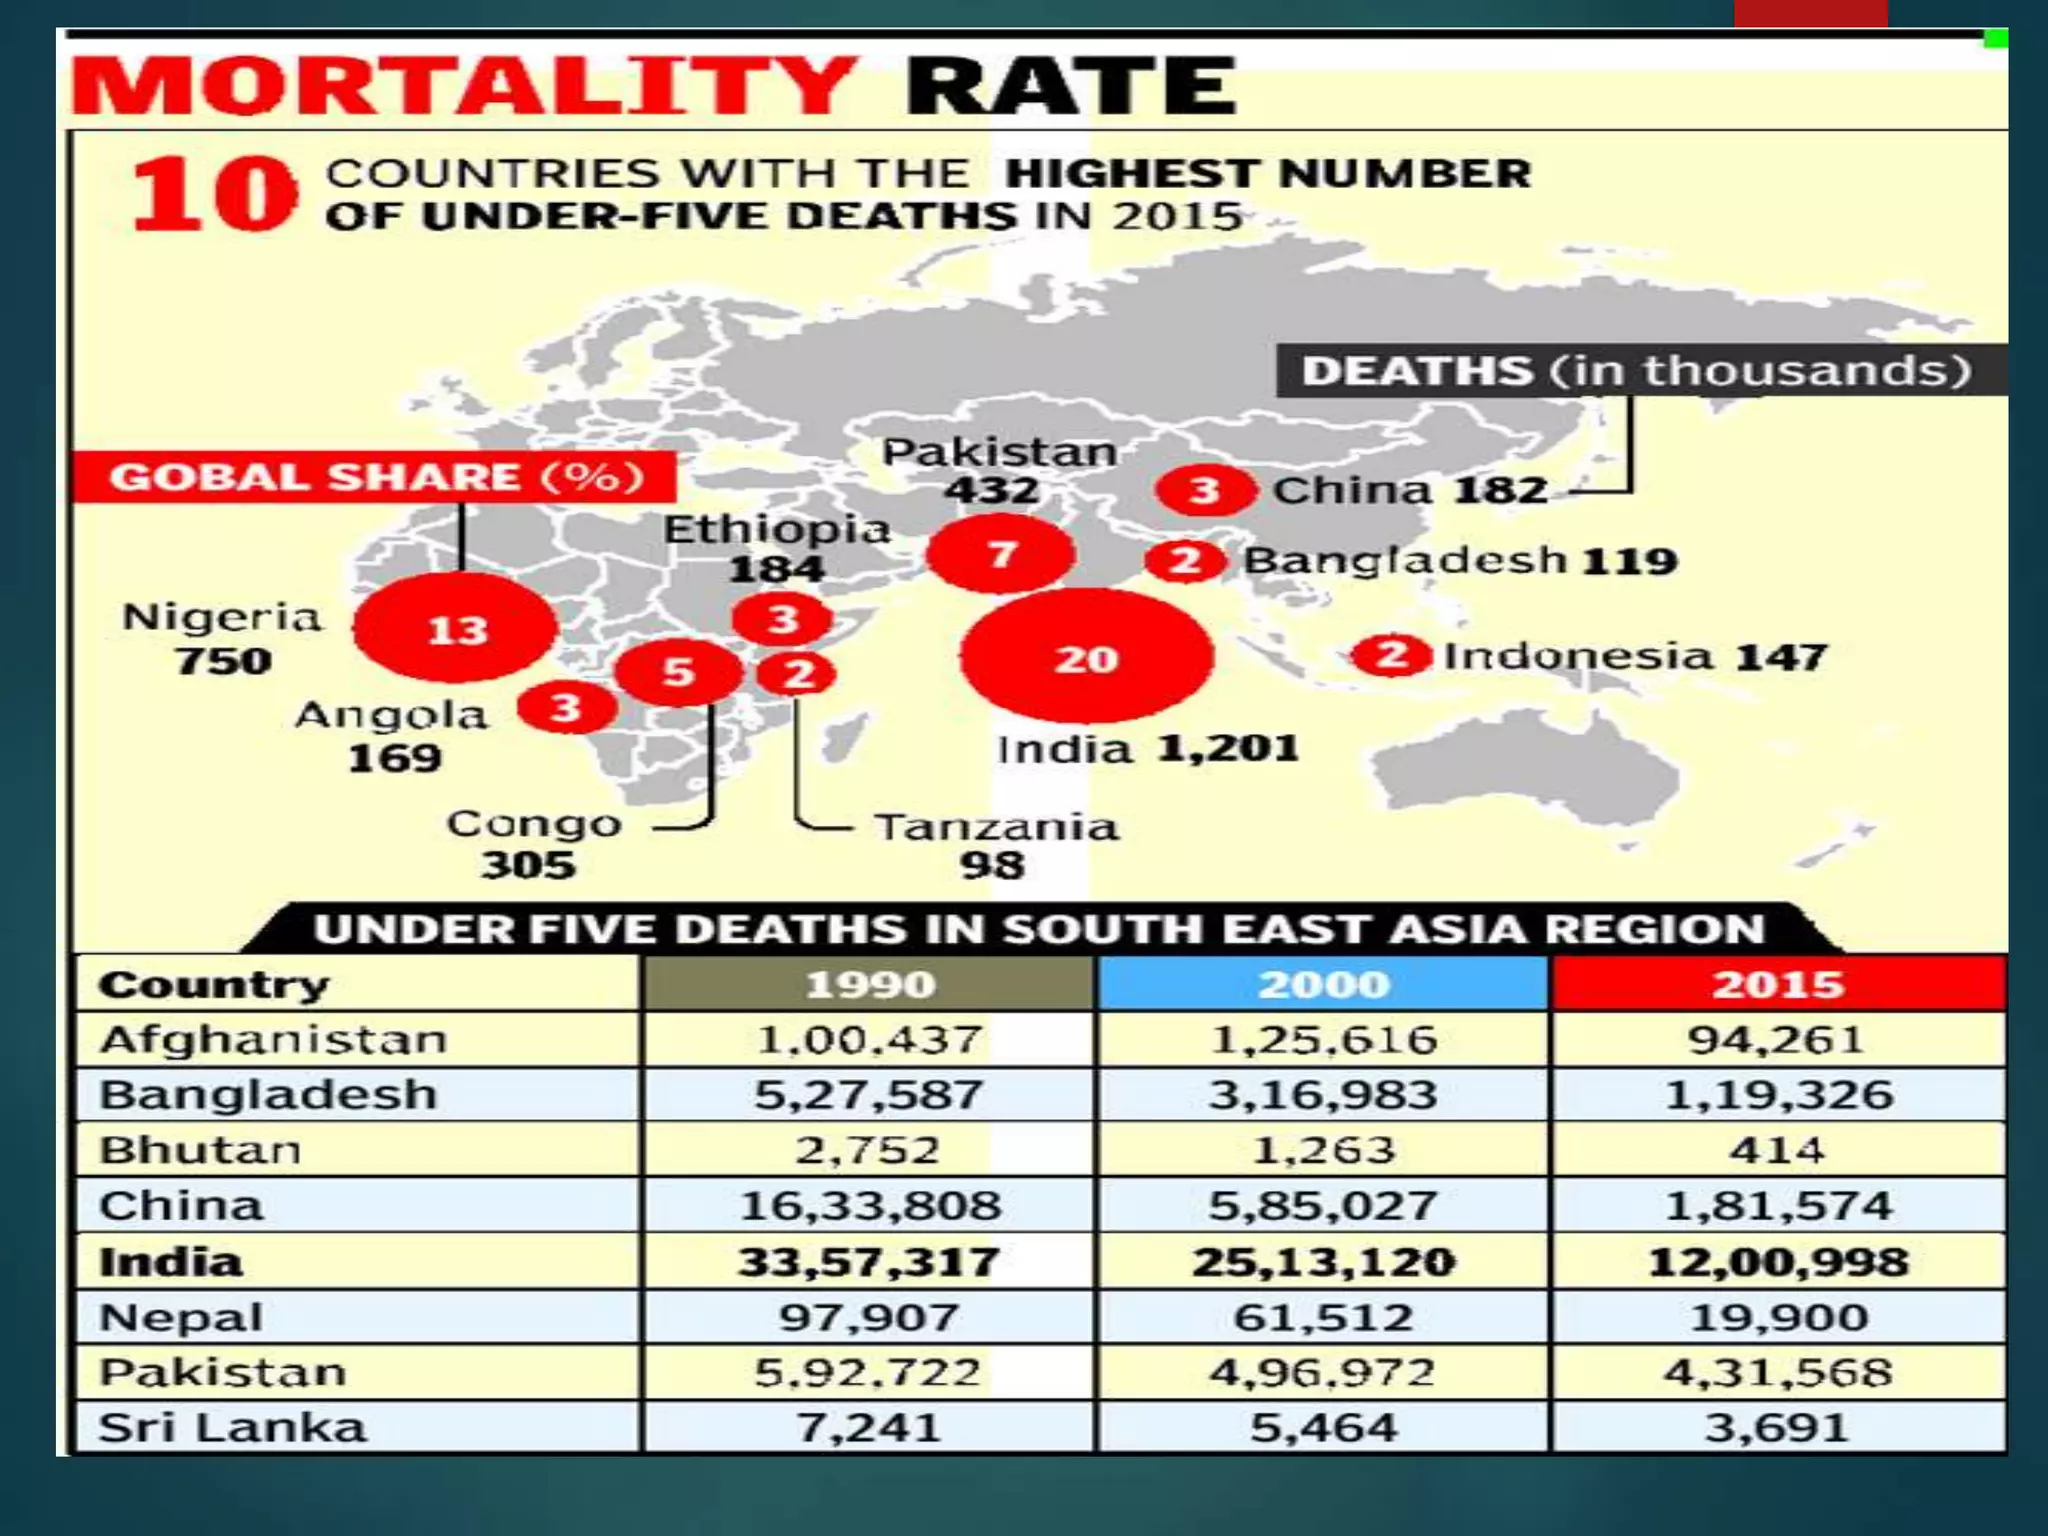
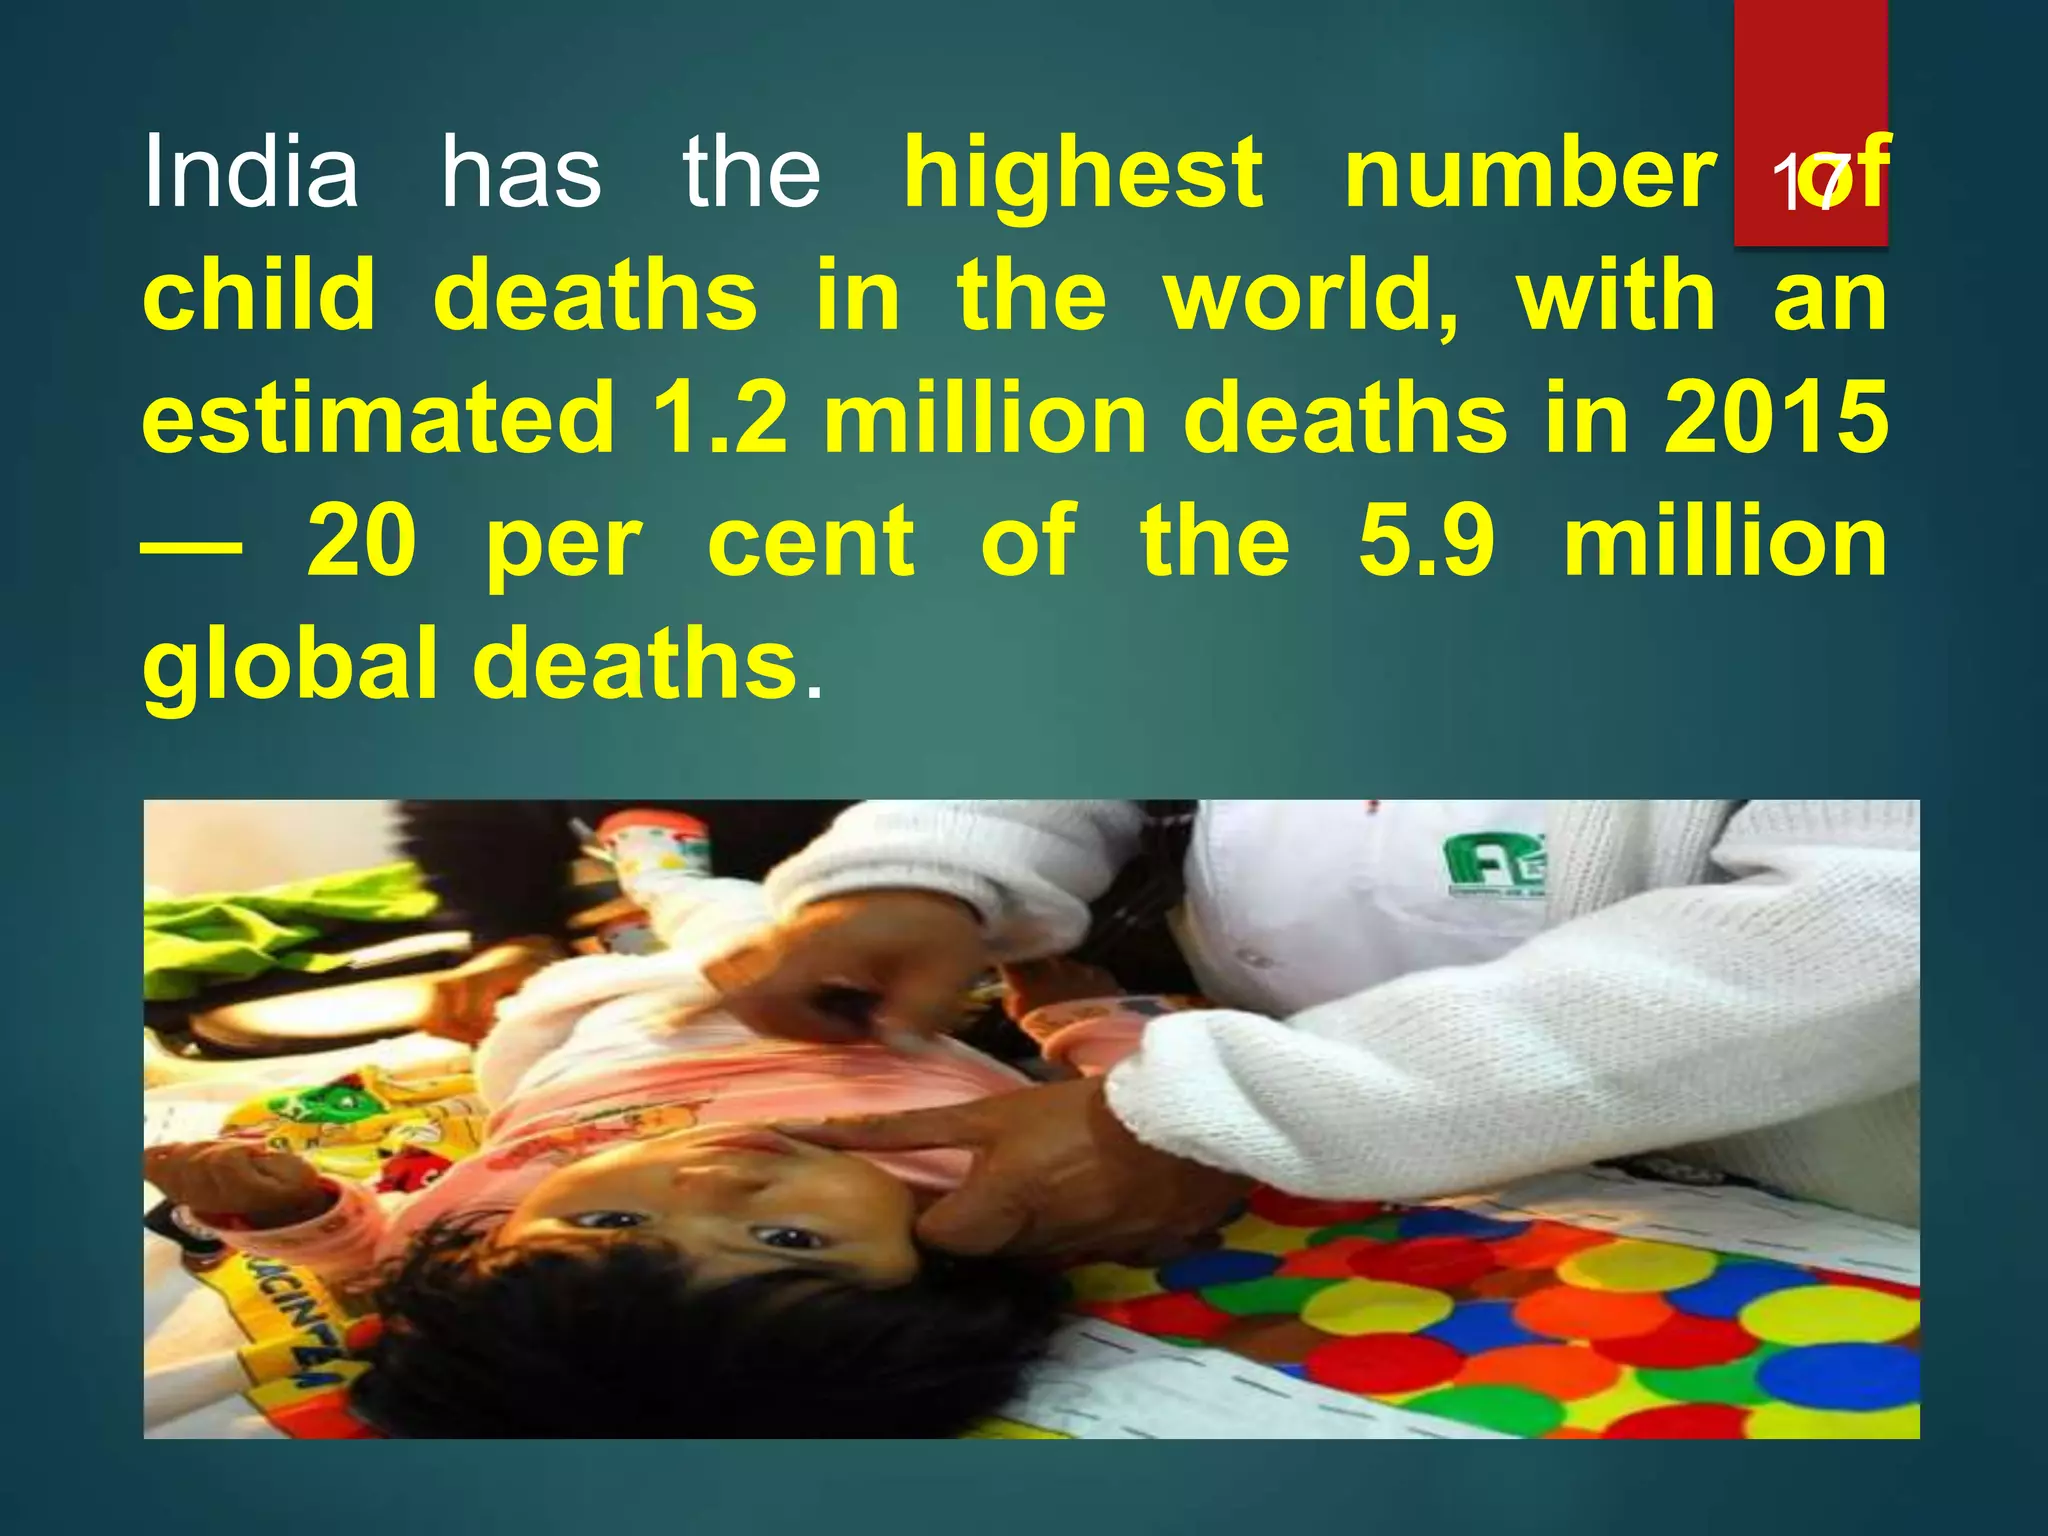


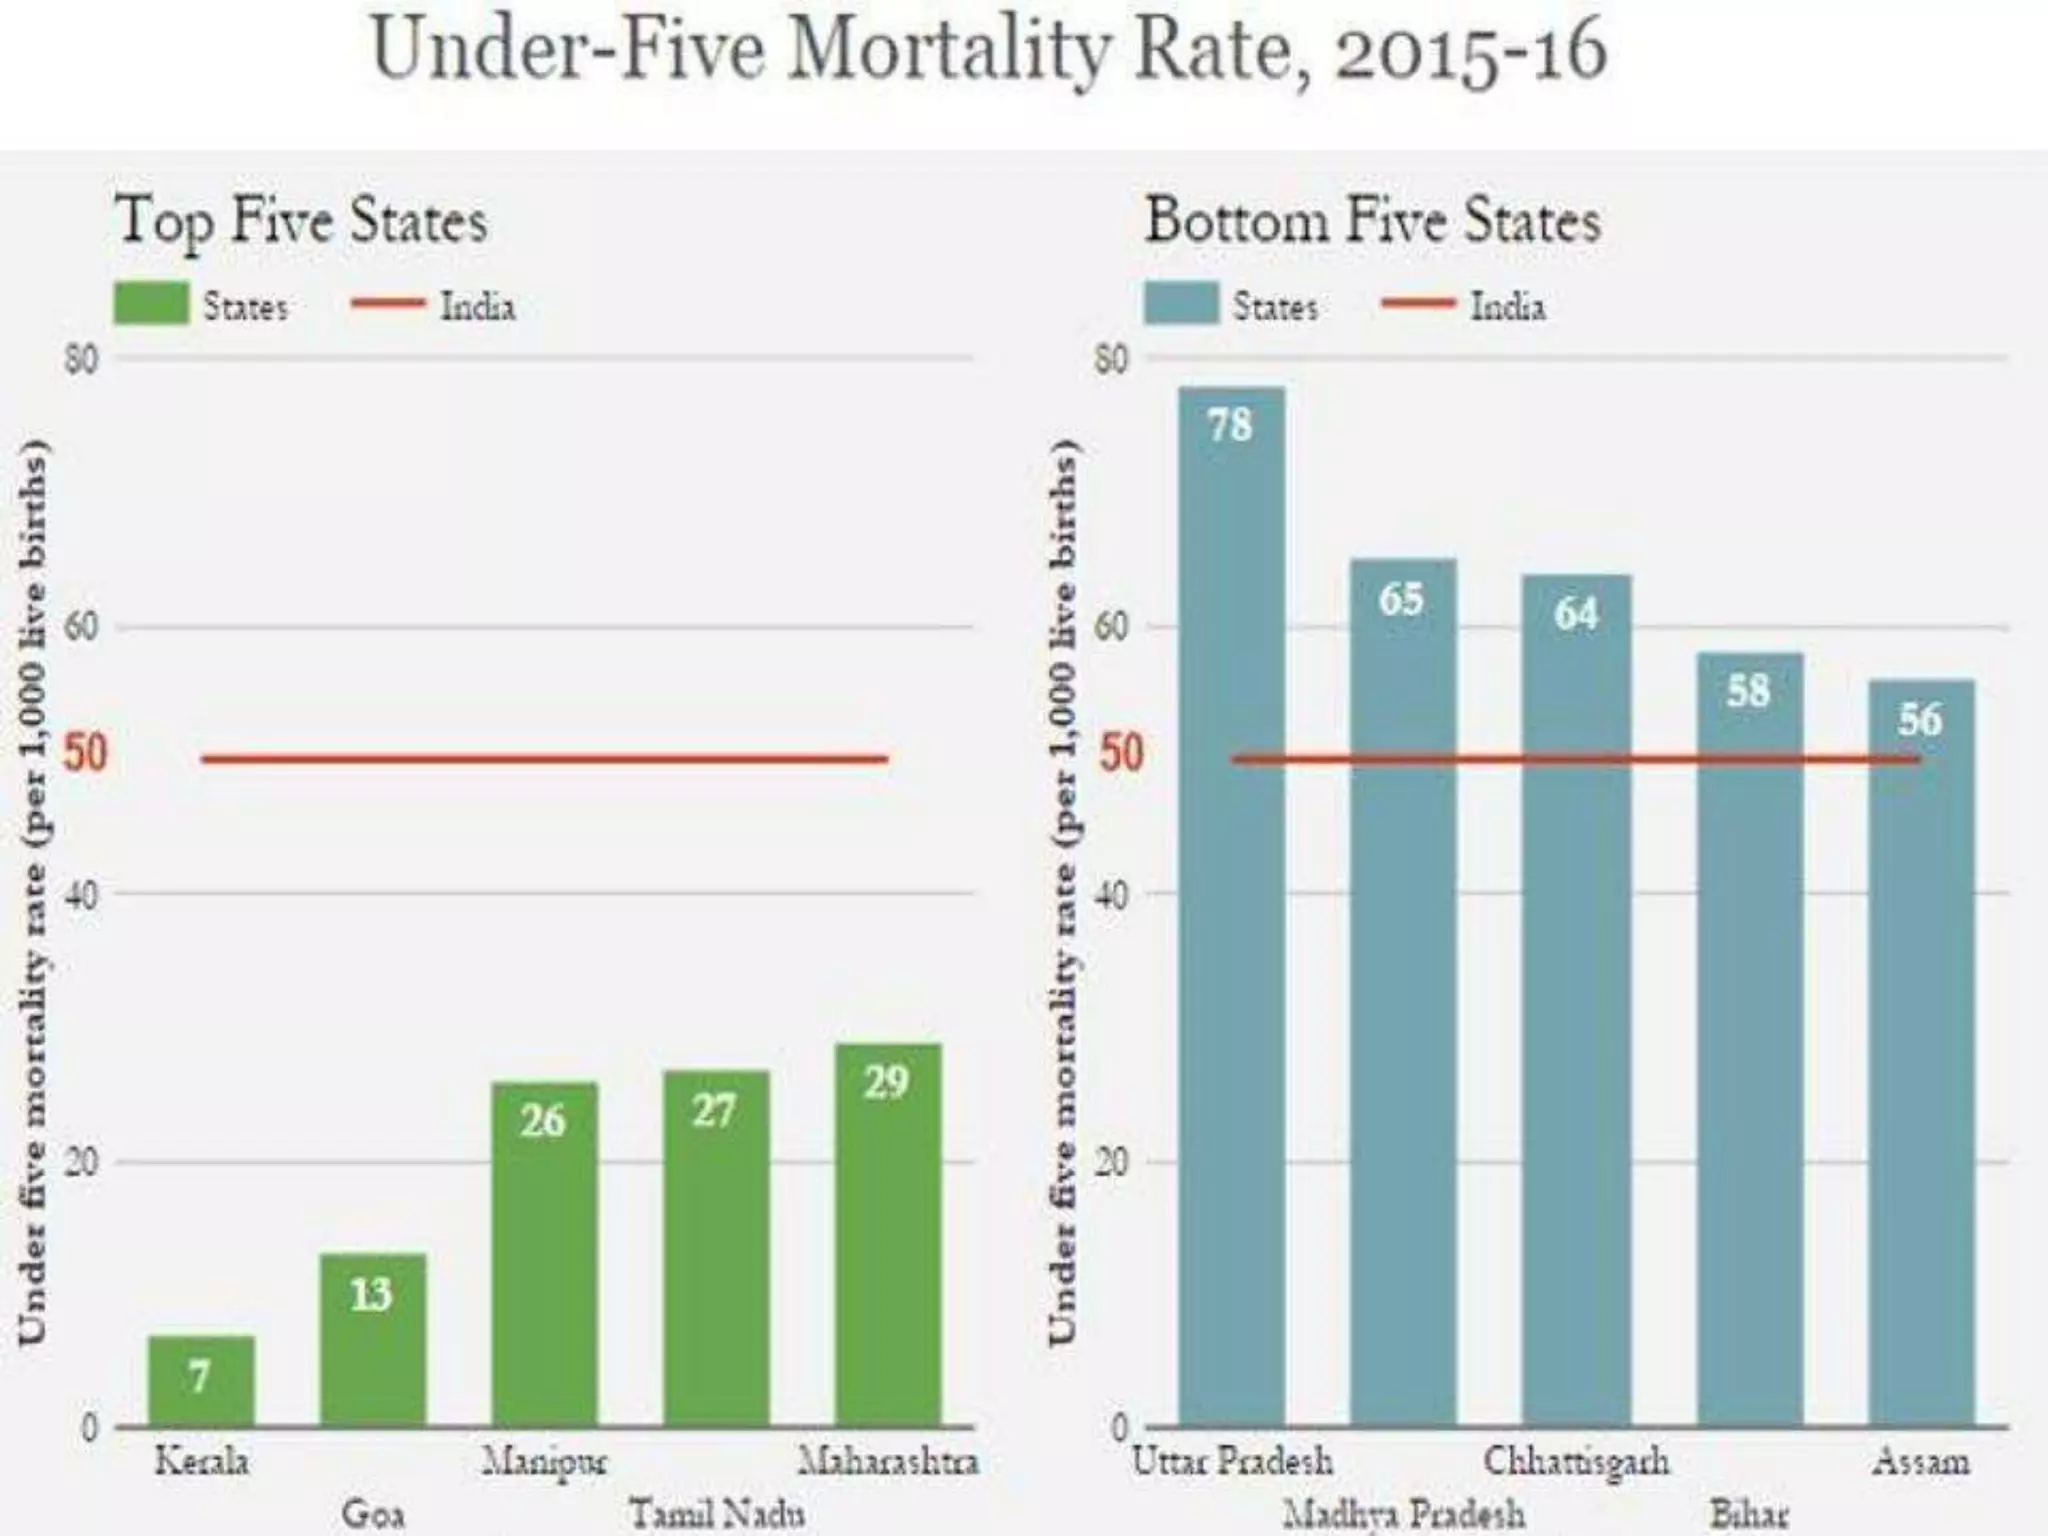


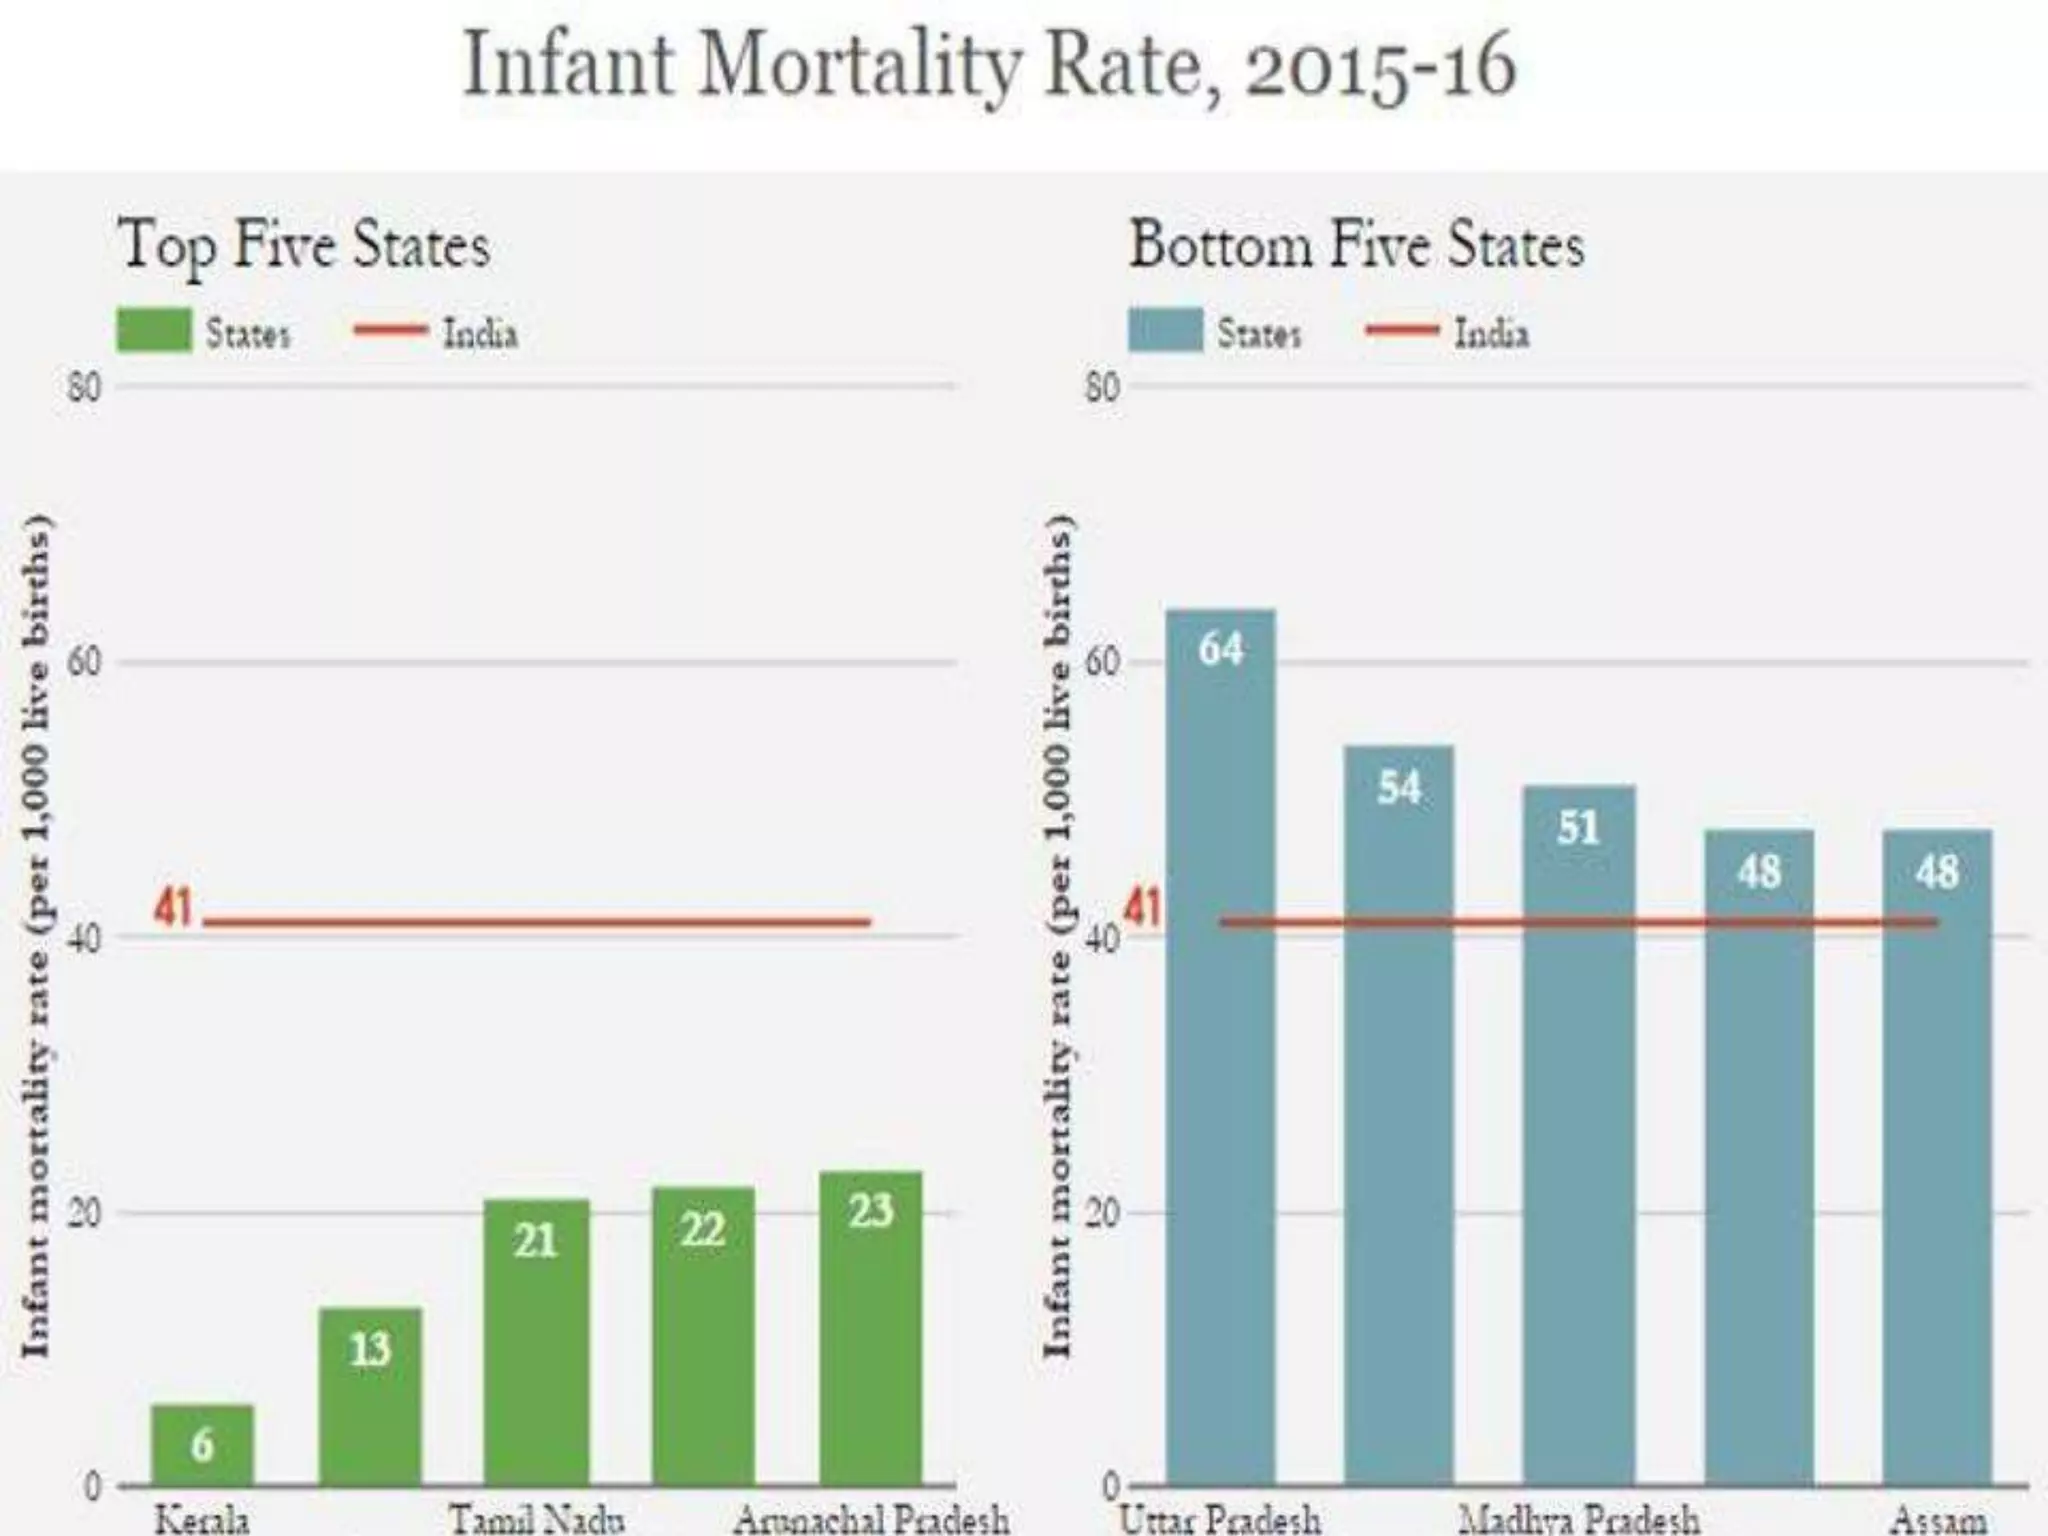

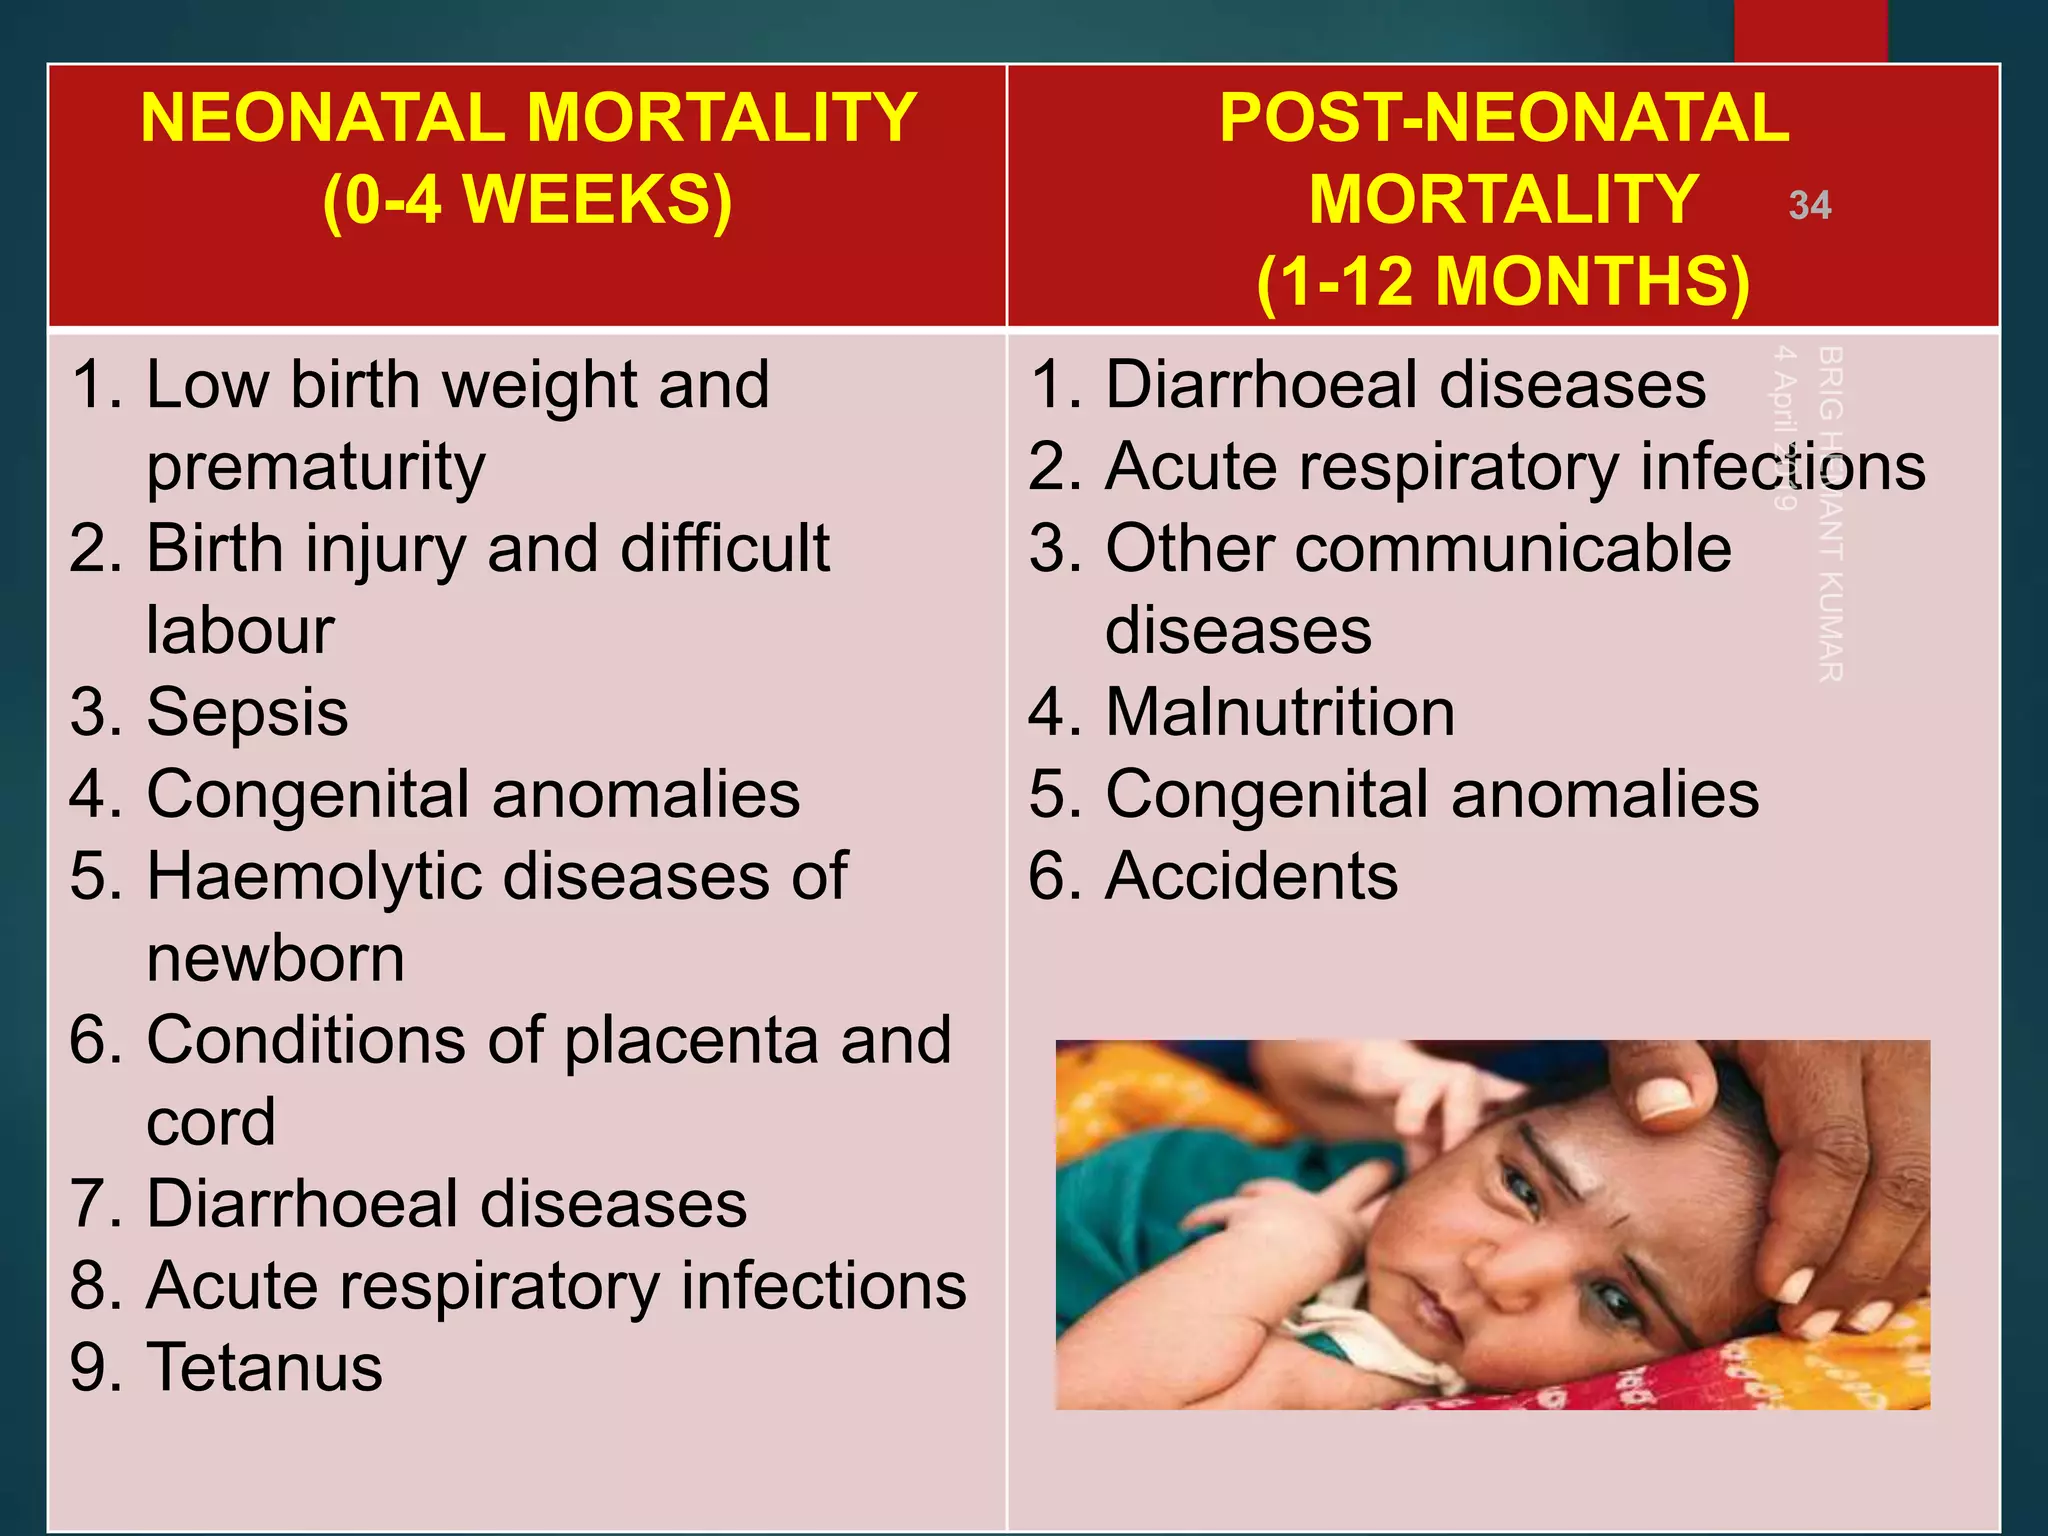


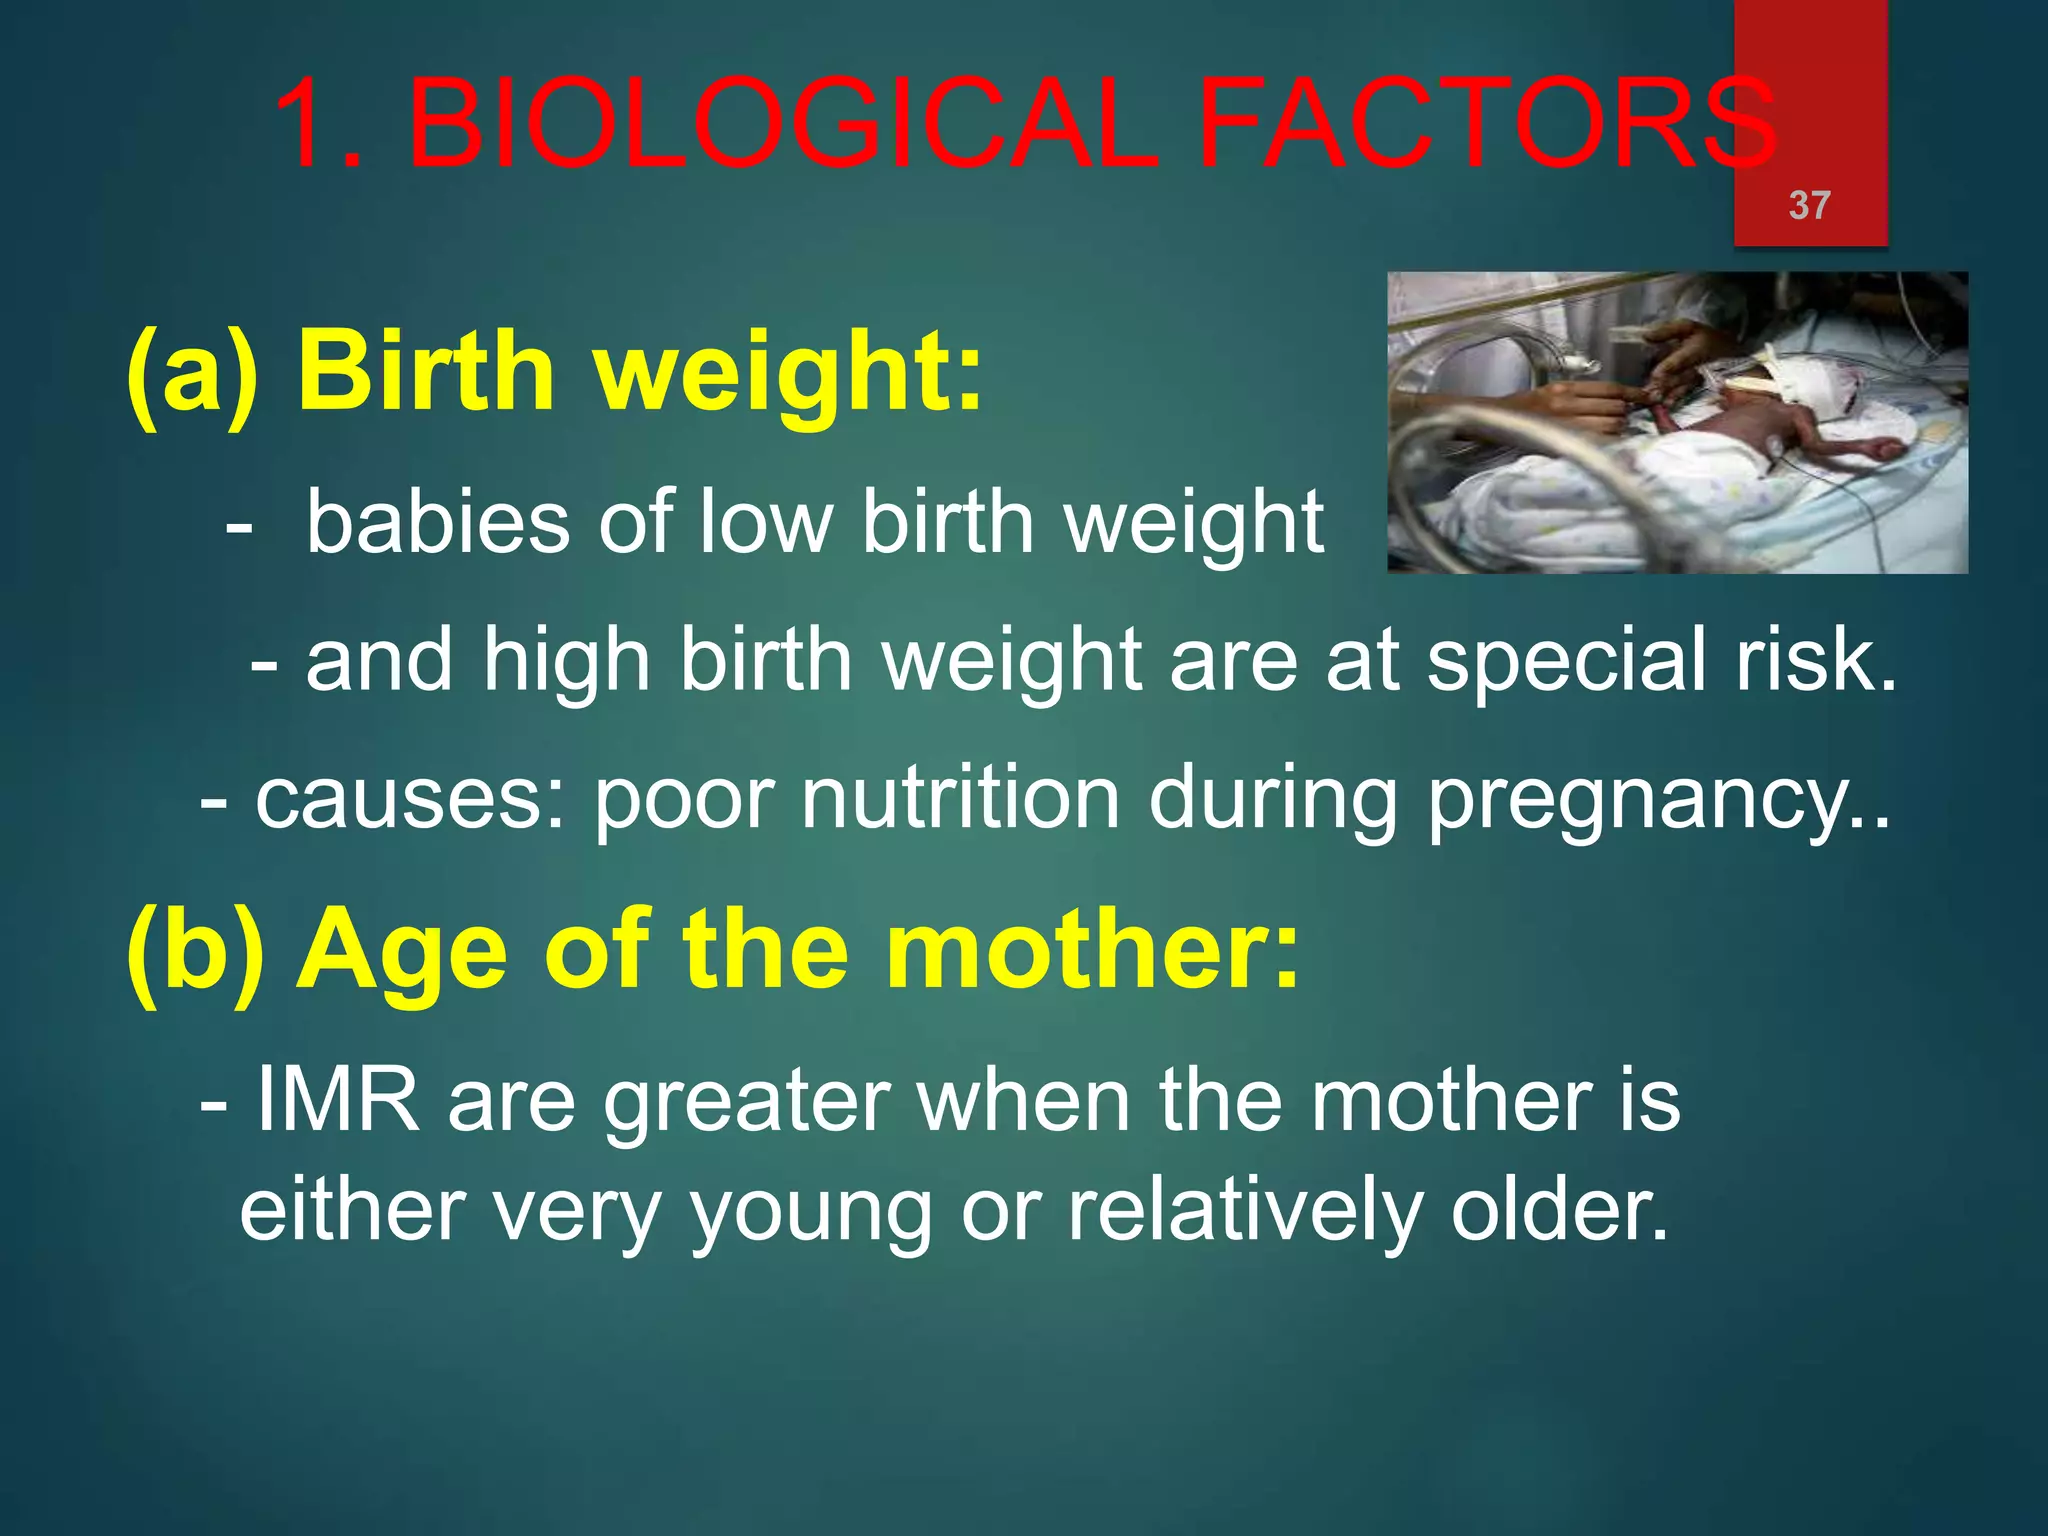


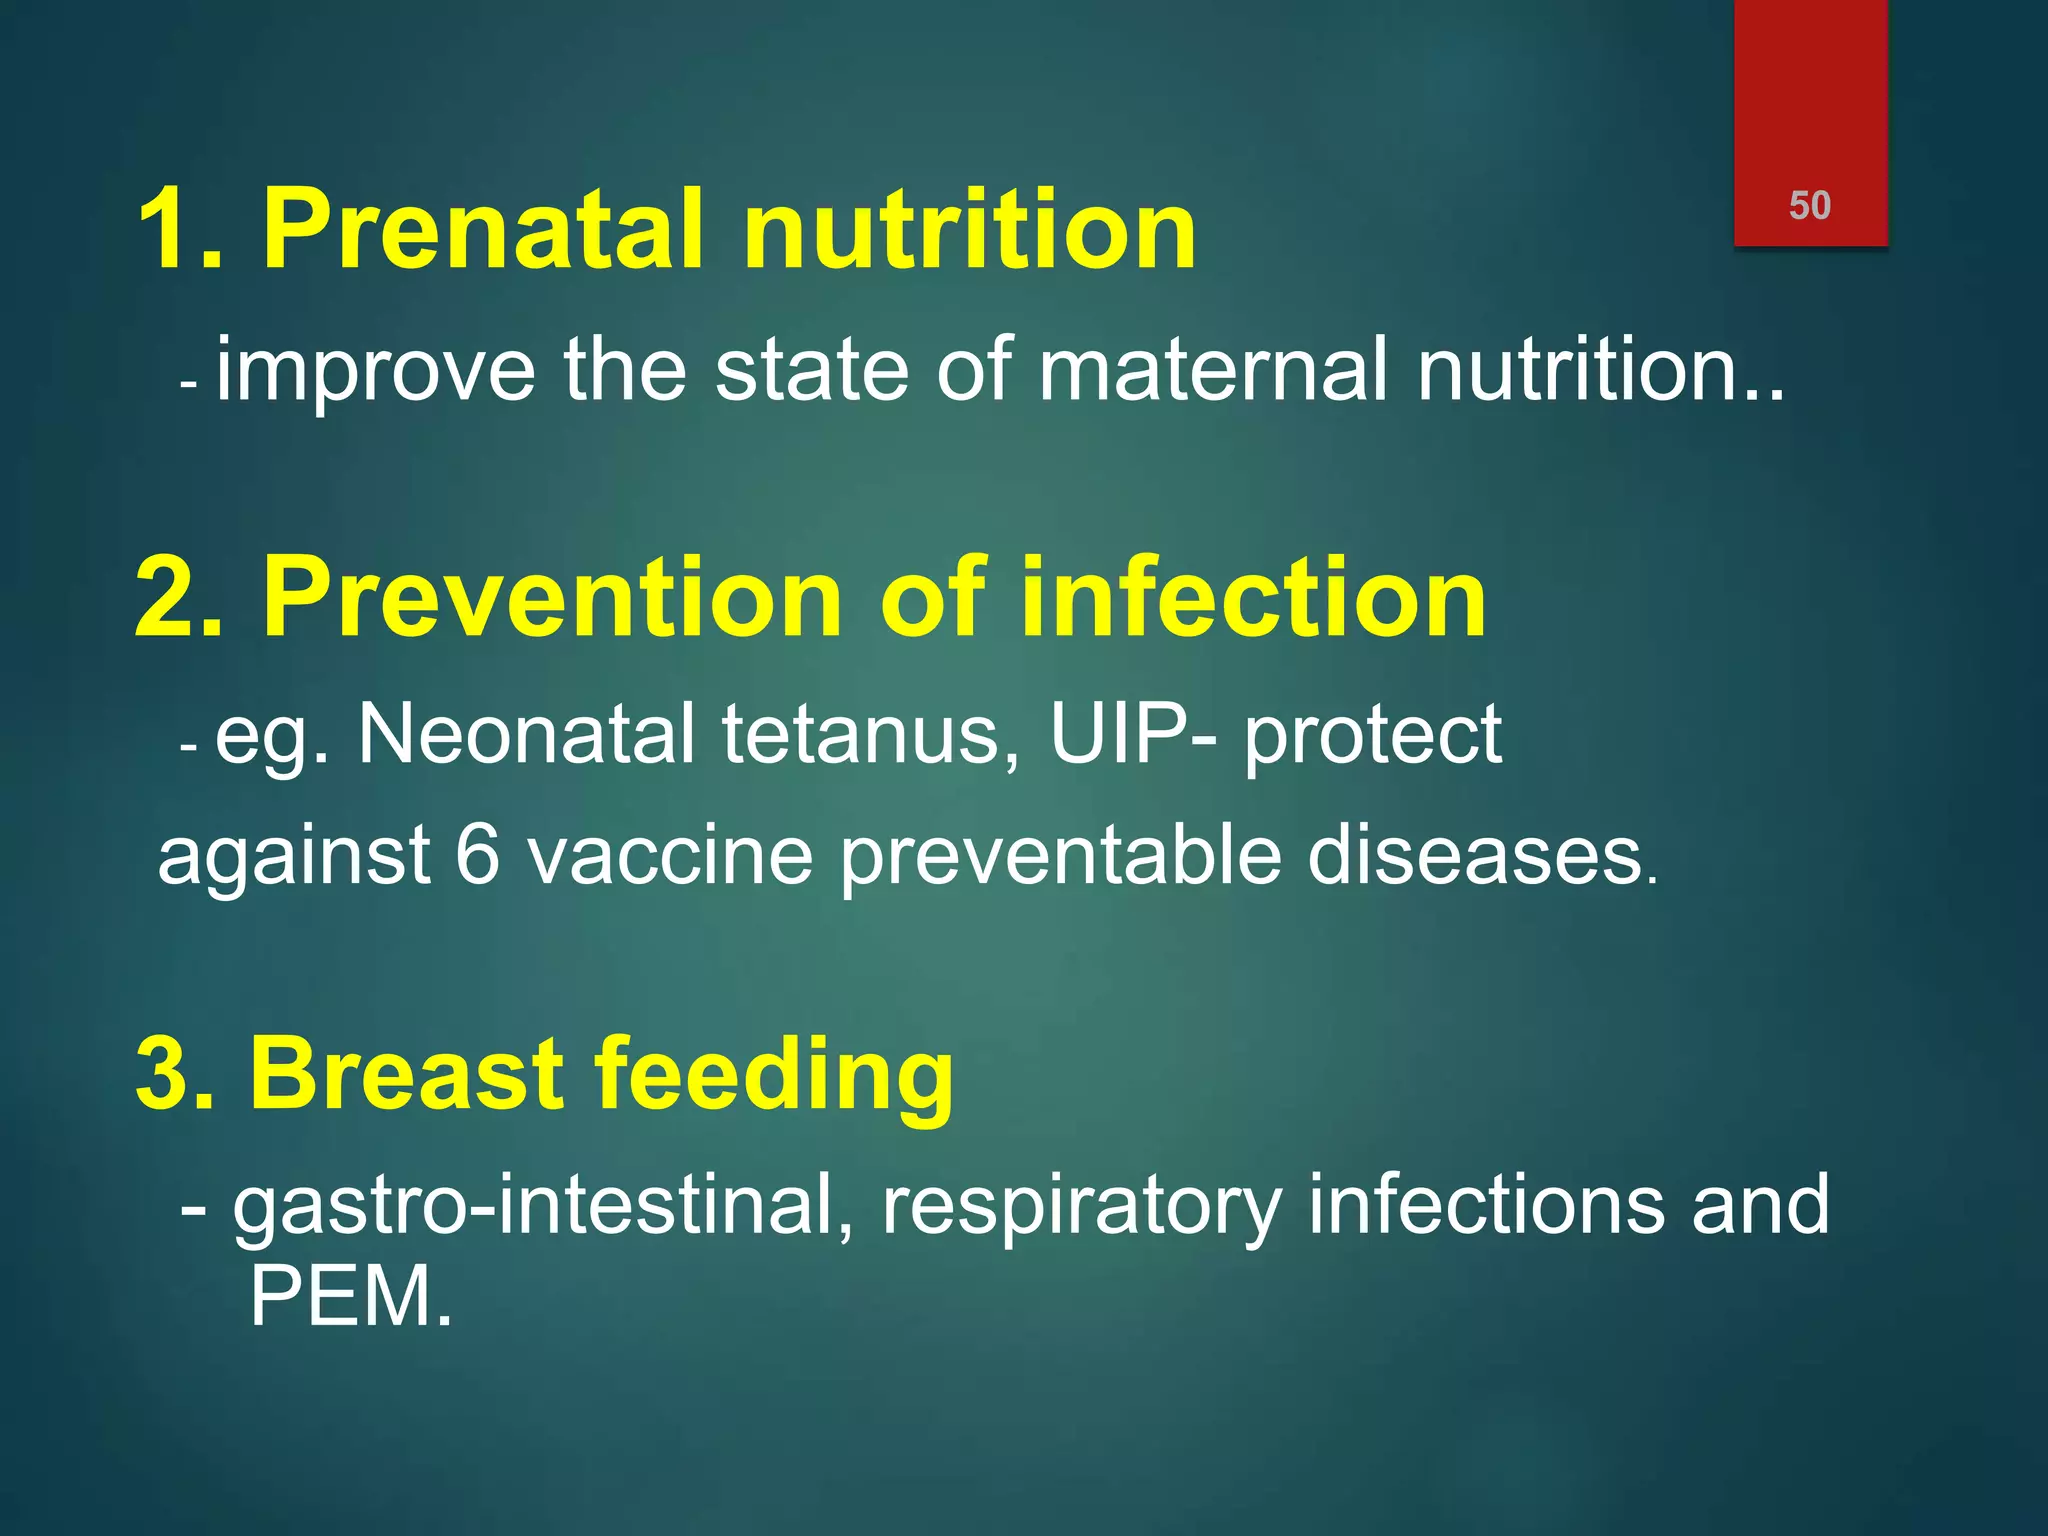


The document discusses child and infant mortality rates globally and in India. It provides definitions for under-five mortality rate, infant mortality rate, and neonatal mortality rate. The three main causes of under-five mortality are neonatal mortality (0-4 weeks), post-neonatal mortality (1-12 months), and factors like low birth weight, prematurity, and infectious diseases. While global under-five mortality has decreased 53% from 1990-2015, Africa still has the highest rate. India accounts for 20% of global under-five deaths despite its rate decreasing 61% from 1990-2015. Preventive measures discussed include prenatal nutrition, immunizations, breastfeeding, and improved access to primary healthcare.