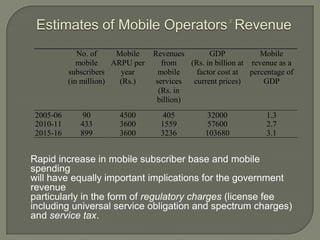
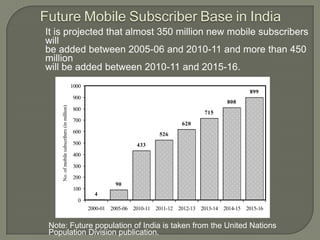
By GROUP
    9
 Rahul Singh
 Gaurav Kumar
 Ravindra Vishwakarma
 Manish Kumar Gupta
 Sumit Kumar
 Rahul Chawla
 The  Indian telecom industry has witnessed
  phenomenal growth.
 The Indian telecom services can be
  divided predominantly into
  • Basic
  • Mobile
  • Internet services
 Fifthlargest telecom network in the world;
  second largest among the emerging
  economies after China
 On an average, about 6–7 million new users
  added per month, making India the world’s
  fastest growing wireless services market
 The government promoting telecom
  manufacturing by providing tax benefits and
  establishing telecom specific Special
  Economic Zones
 The  telecom companies are booming with
  the effect of the growing telecom industry
 Large number of mobile handsets are
  been sold every year providing a growth
  for the handset industry
 AIRTEL
 BSNL
 IDEA
 UNINOR
 VODAFONE
 MTNL
 AIRCEL
 TATA INDICOM
 TATA DOCOMO
 RELIANCE
MARKET SHARE OF DIFFERENT COMPANIES
Estimates of Mobile Operators’ Revenue
              No. of     Mobile    Revenues        GDP            Mobile
              mobile    ARPU per      from   (Rs. in billion at revenue as a
           subscribers    year       mobile    factor cost at percentage of
           (in million)   (Rs.)     services  current prices)      GDP
                                     (Rs. in
                                    billion)
 2005-06      90         4500        405          32000             1.3
 2010-11      433        3600        1559         57600             2.7
 2015-16      899        3600        3236         103680            3.1


Rapid increase in mobile subscriber base and mobile
spending
will have equally important implications for the government
revenue
particularly in the form of regulatory charges (license fee
including universal service obligation and spectrum charges)
and service tax.
STRENGTH     WEAKNESS


OPPORTUNITY    THREAT
•   Huge Customer potential
•   High Growth Rate
•   Allowed FDI limit ranging from 74% to
    100%
•   High return on Investment
•   Liberalization efforts by Govt.
•   Lower capital expenditure
WEAKNESS
•   Poor Telecommunication Infrastructure
•   Late adopters of New Technology
•   Most competitive market
•   A market strongly regulated by
    Government.
•   Difficult to enter because of requirement of
    huge financial resources.
•   3G Telecom services and 4G services
•   More Quality Service
•   Value added Services (VAS)
•   Boost to Telecom Manufacturing
    Companies
•   Telecom Equipment Exports
•   Telecommunication Policies
•   Declining ARPU (average Revenue per
    user)
•   Partiality on the part of the Govt.
•   Content Piracy
Future Mobile Subscriber Base in India
It is projected that almost 350 million new mobile subscribers
will
be added between 2005-06 and 2010-11 and more than 450
million
will be added between 2010-11 and 2015-16.
                                              1000
                                                                                                               899
                                              900
                                                                                                       808
     No. of mobile subscribers (in million)


                                              800
                                                                                              715
                                              700
                                                                                      620
                                              600                             526
                                              500                     433
                                              400

                                              300

                                              200
                                                              90
                                              100
                                                       4
                                                0
                                                     2000-01 2005-06 2010-11 2011-12 2012-13 2013-14 2014-15 2015-16


 Note: Future population of India is taken from the United Nations
 Population Division publication.
Indian telecom industry

Indian telecom industry

  • 1.
  • 2.
     Rahul Singh Gaurav Kumar  Ravindra Vishwakarma  Manish Kumar Gupta  Sumit Kumar  Rahul Chawla
  • 4.
     The Indian telecom industry has witnessed phenomenal growth.  The Indian telecom services can be divided predominantly into • Basic • Mobile • Internet services
  • 5.
     Fifthlargest telecomnetwork in the world; second largest among the emerging economies after China  On an average, about 6–7 million new users added per month, making India the world’s fastest growing wireless services market  The government promoting telecom manufacturing by providing tax benefits and establishing telecom specific Special Economic Zones
  • 6.
     The telecom companies are booming with the effect of the growing telecom industry  Large number of mobile handsets are been sold every year providing a growth for the handset industry
  • 7.
     AIRTEL  BSNL IDEA  UNINOR  VODAFONE  MTNL  AIRCEL  TATA INDICOM  TATA DOCOMO  RELIANCE
  • 9.
    MARKET SHARE OFDIFFERENT COMPANIES
  • 10.
    Estimates of MobileOperators’ Revenue No. of Mobile Revenues GDP Mobile mobile ARPU per from (Rs. in billion at revenue as a subscribers year mobile factor cost at percentage of (in million) (Rs.) services current prices) GDP (Rs. in billion) 2005-06 90 4500 405 32000 1.3 2010-11 433 3600 1559 57600 2.7 2015-16 899 3600 3236 103680 3.1 Rapid increase in mobile subscriber base and mobile spending will have equally important implications for the government revenue particularly in the form of regulatory charges (license fee including universal service obligation and spectrum charges) and service tax.
  • 11.
    STRENGTH WEAKNESS OPPORTUNITY THREAT
  • 12.
    Huge Customer potential • High Growth Rate • Allowed FDI limit ranging from 74% to 100% • High return on Investment • Liberalization efforts by Govt. • Lower capital expenditure
  • 13.
    WEAKNESS • Poor Telecommunication Infrastructure • Late adopters of New Technology • Most competitive market • A market strongly regulated by Government. • Difficult to enter because of requirement of huge financial resources.
  • 14.
    3G Telecom services and 4G services • More Quality Service • Value added Services (VAS) • Boost to Telecom Manufacturing Companies • Telecom Equipment Exports
  • 15.
    Telecommunication Policies • Declining ARPU (average Revenue per user) • Partiality on the part of the Govt. • Content Piracy
  • 16.
    Future Mobile SubscriberBase in India It is projected that almost 350 million new mobile subscribers will be added between 2005-06 and 2010-11 and more than 450 million will be added between 2010-11 and 2015-16. 1000 899 900 808 No. of mobile subscribers (in million) 800 715 700 620 600 526 500 433 400 300 200 90 100 4 0 2000-01 2005-06 2010-11 2011-12 2012-13 2013-14 2014-15 2015-16 Note: Future population of India is taken from the United Nations Population Division publication.