Downloaded 184 times
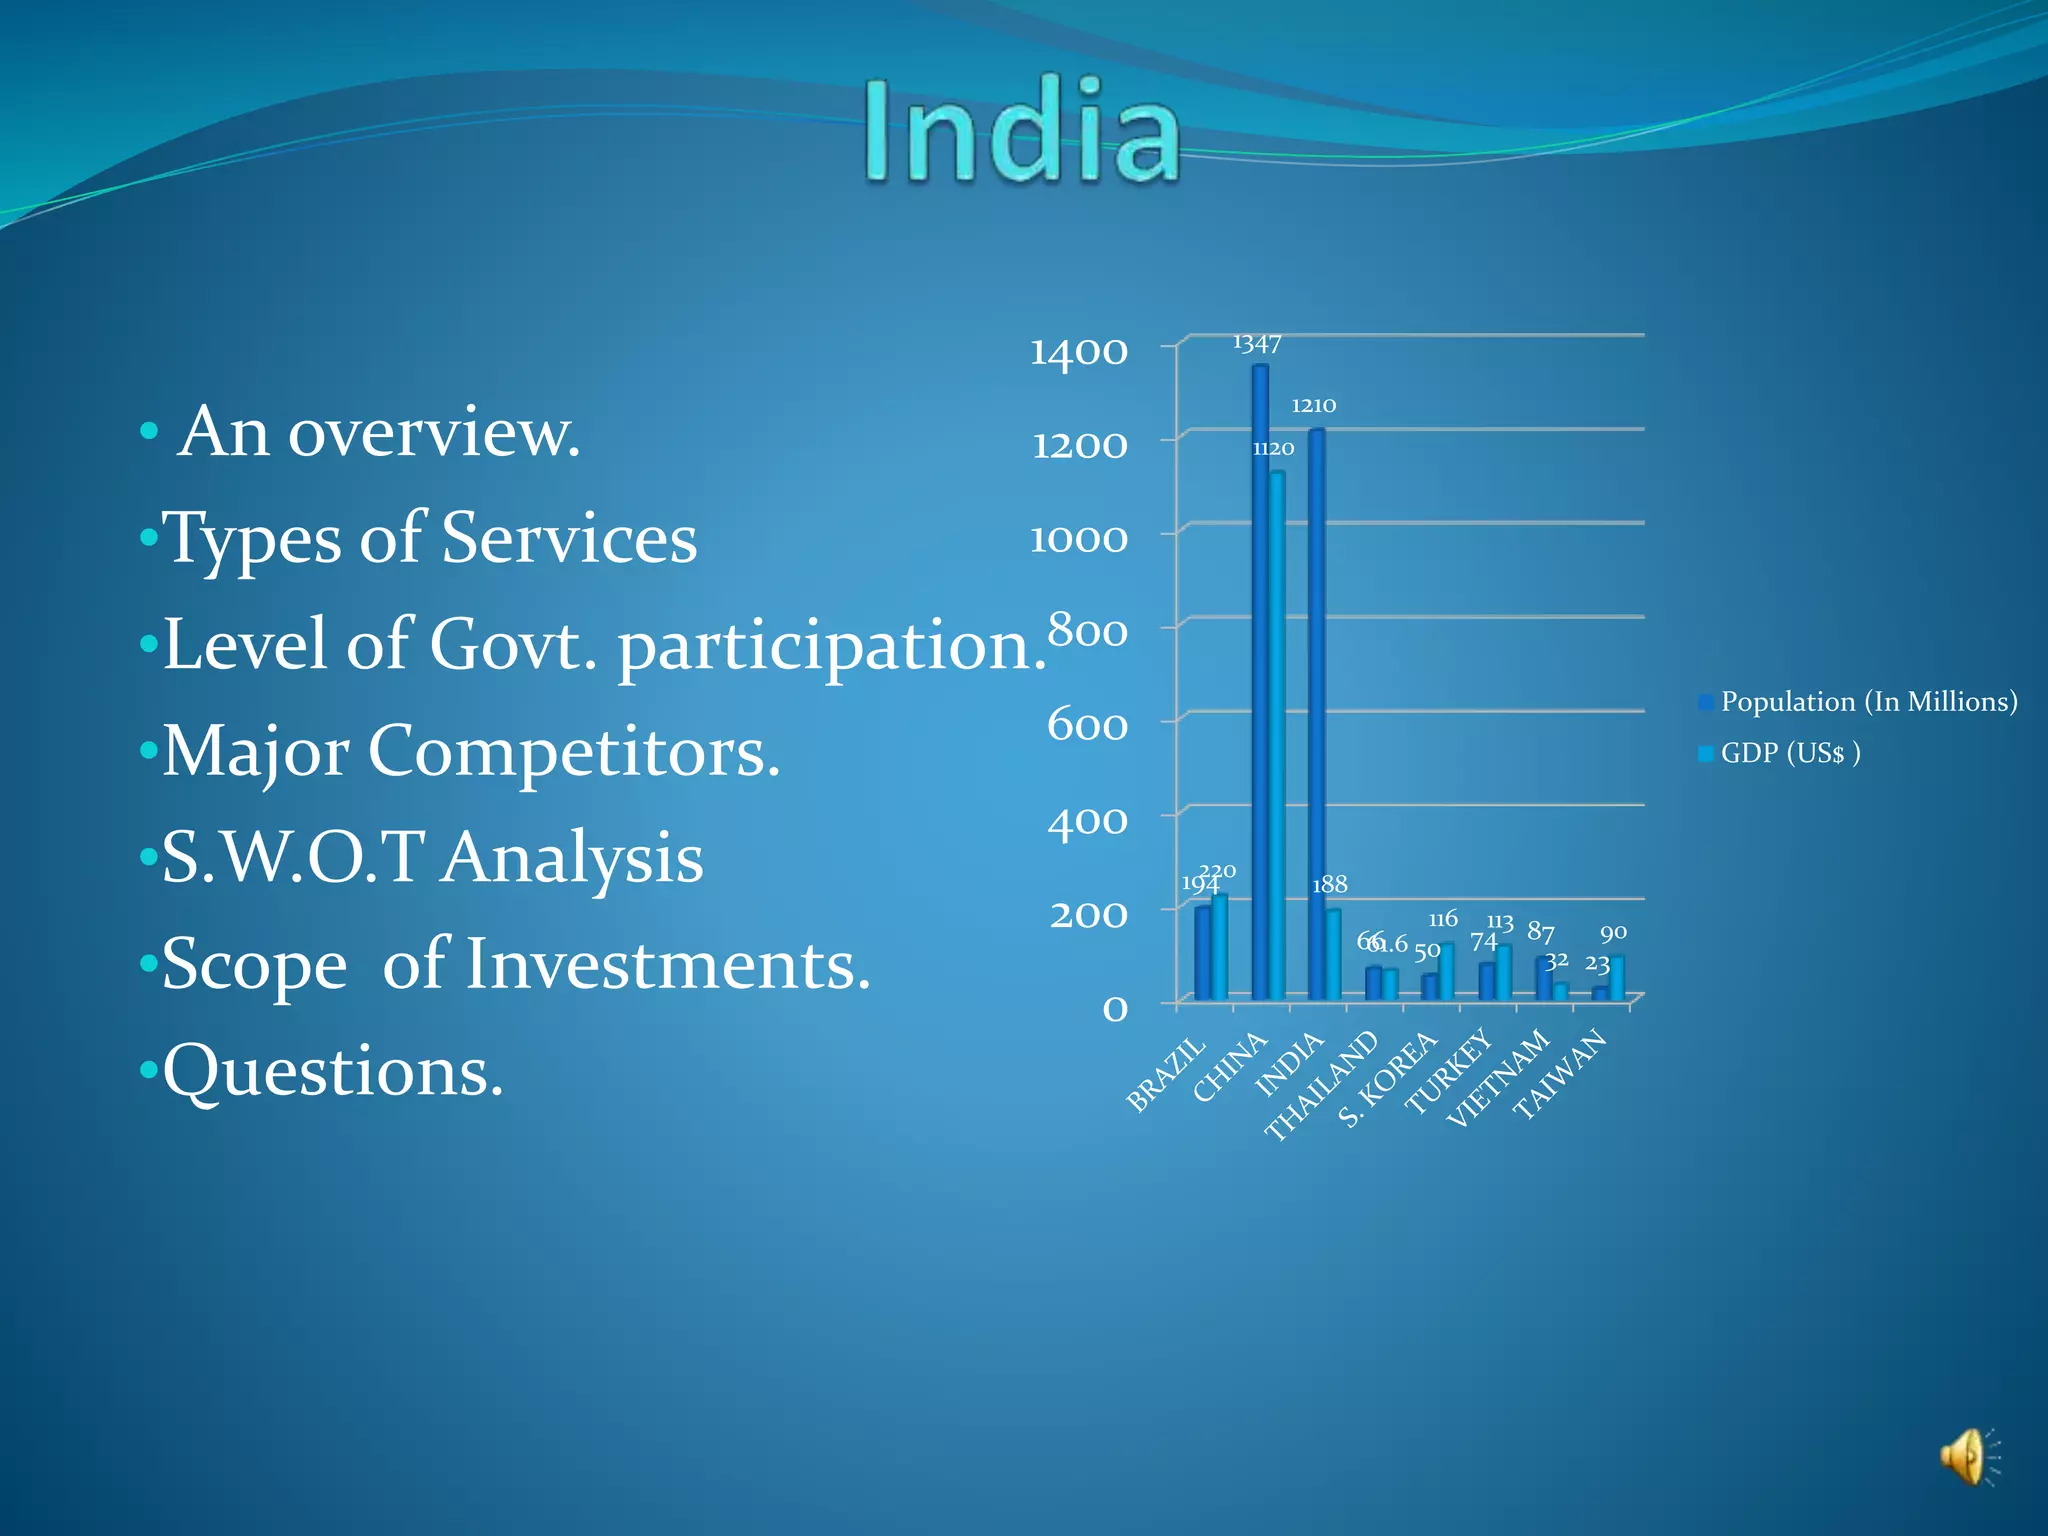
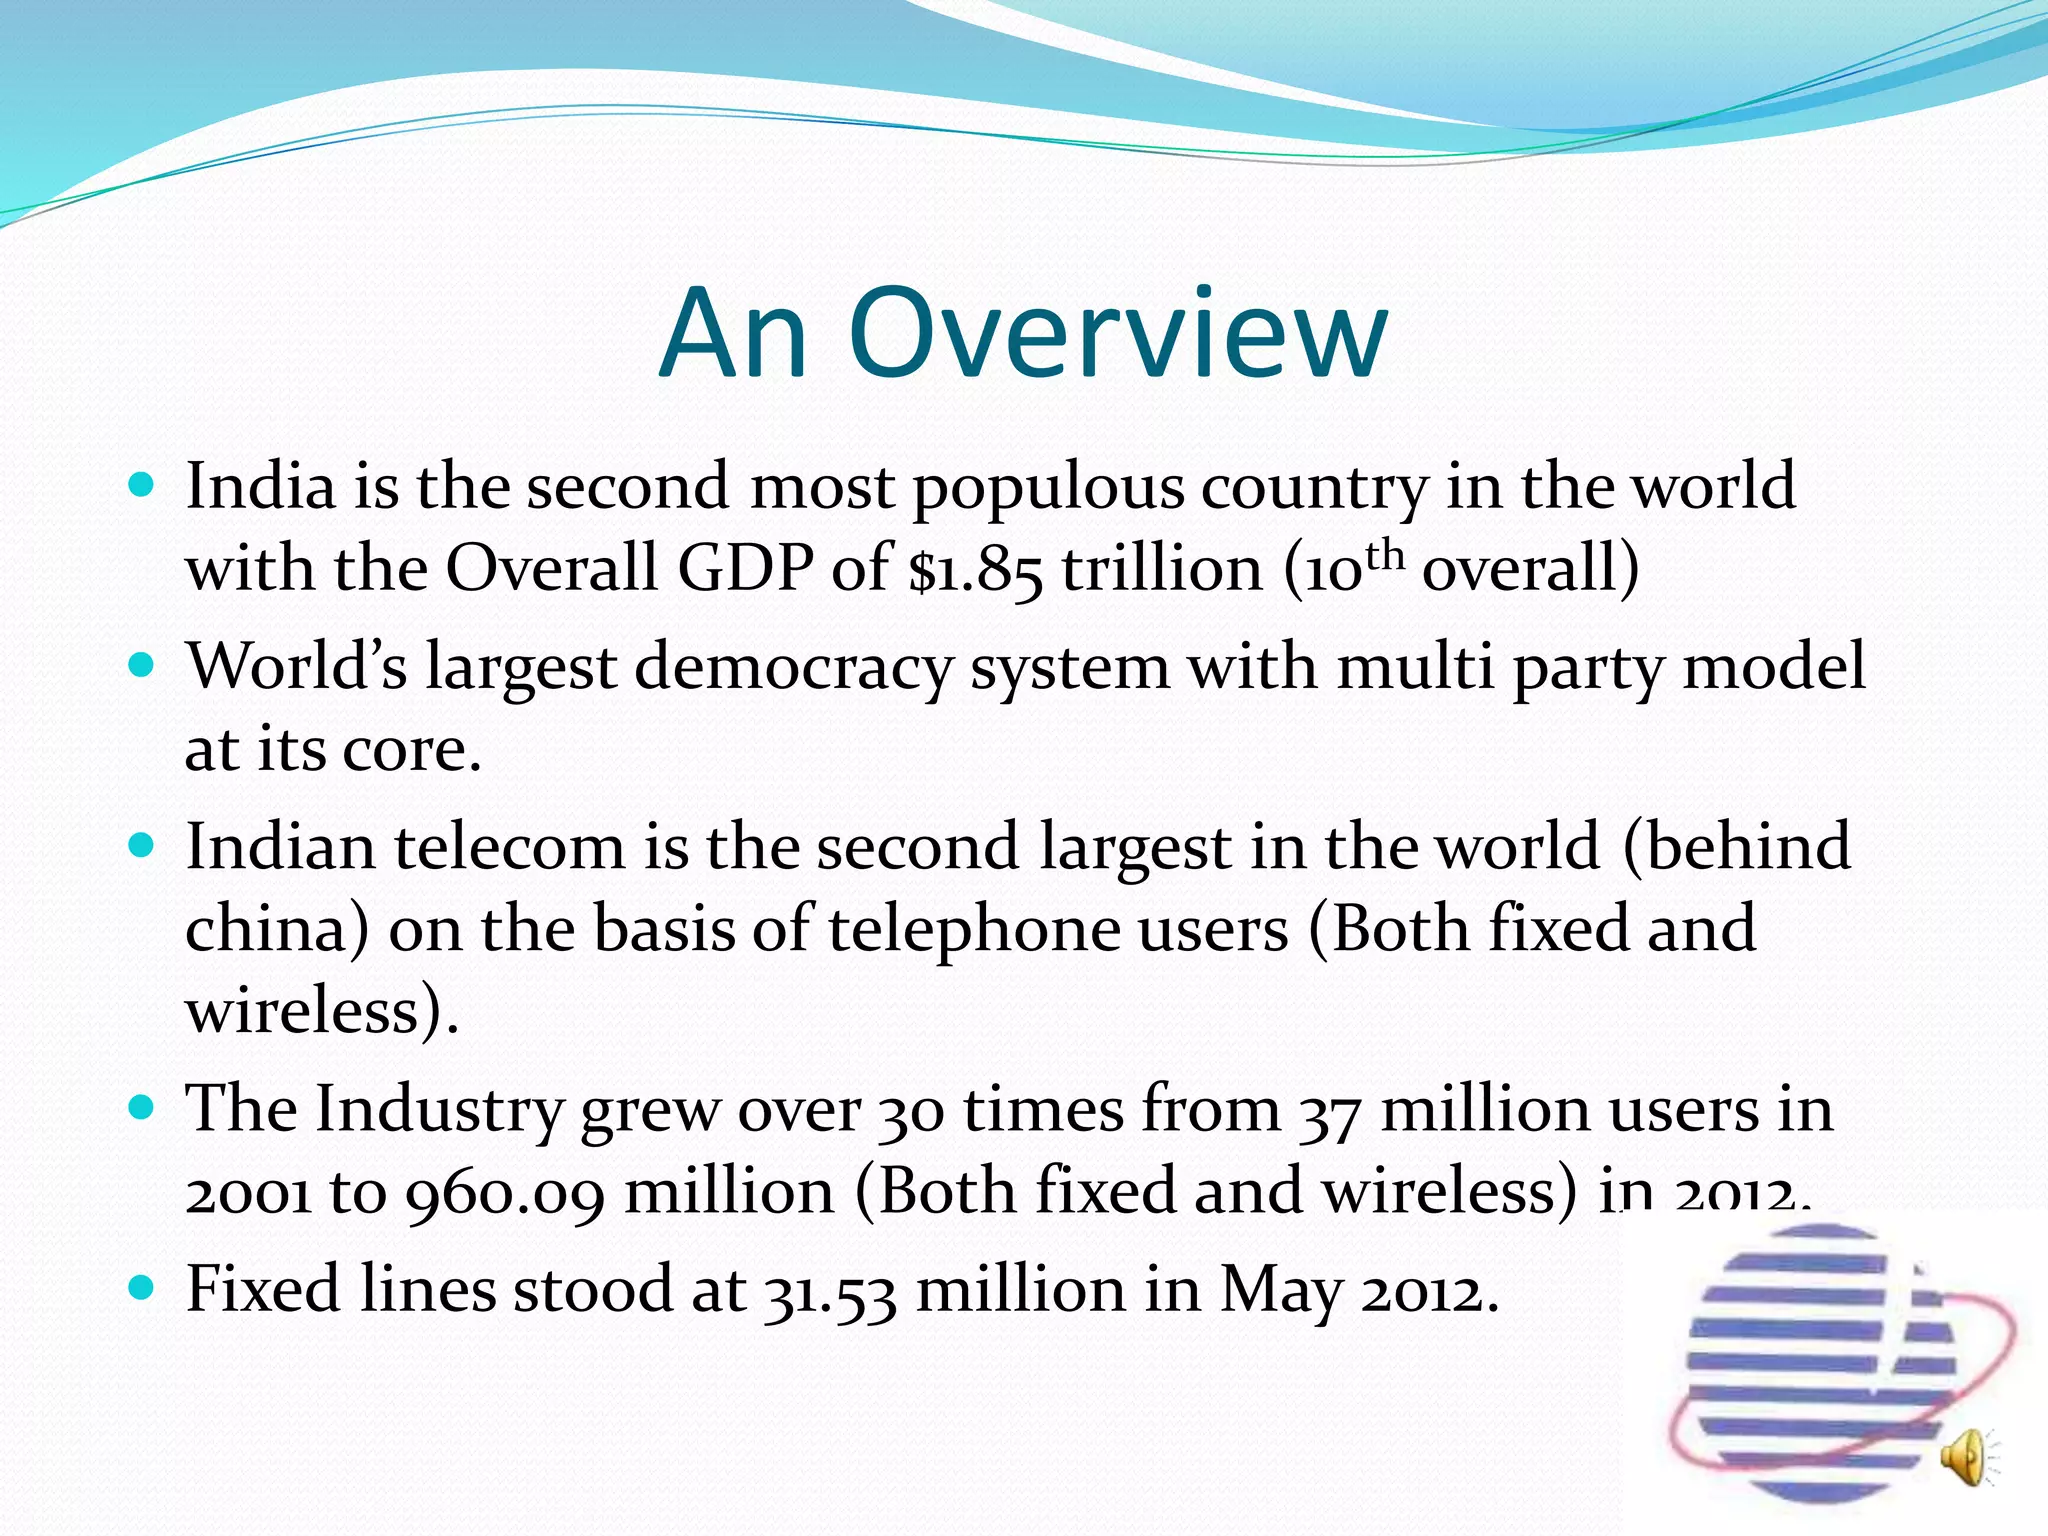
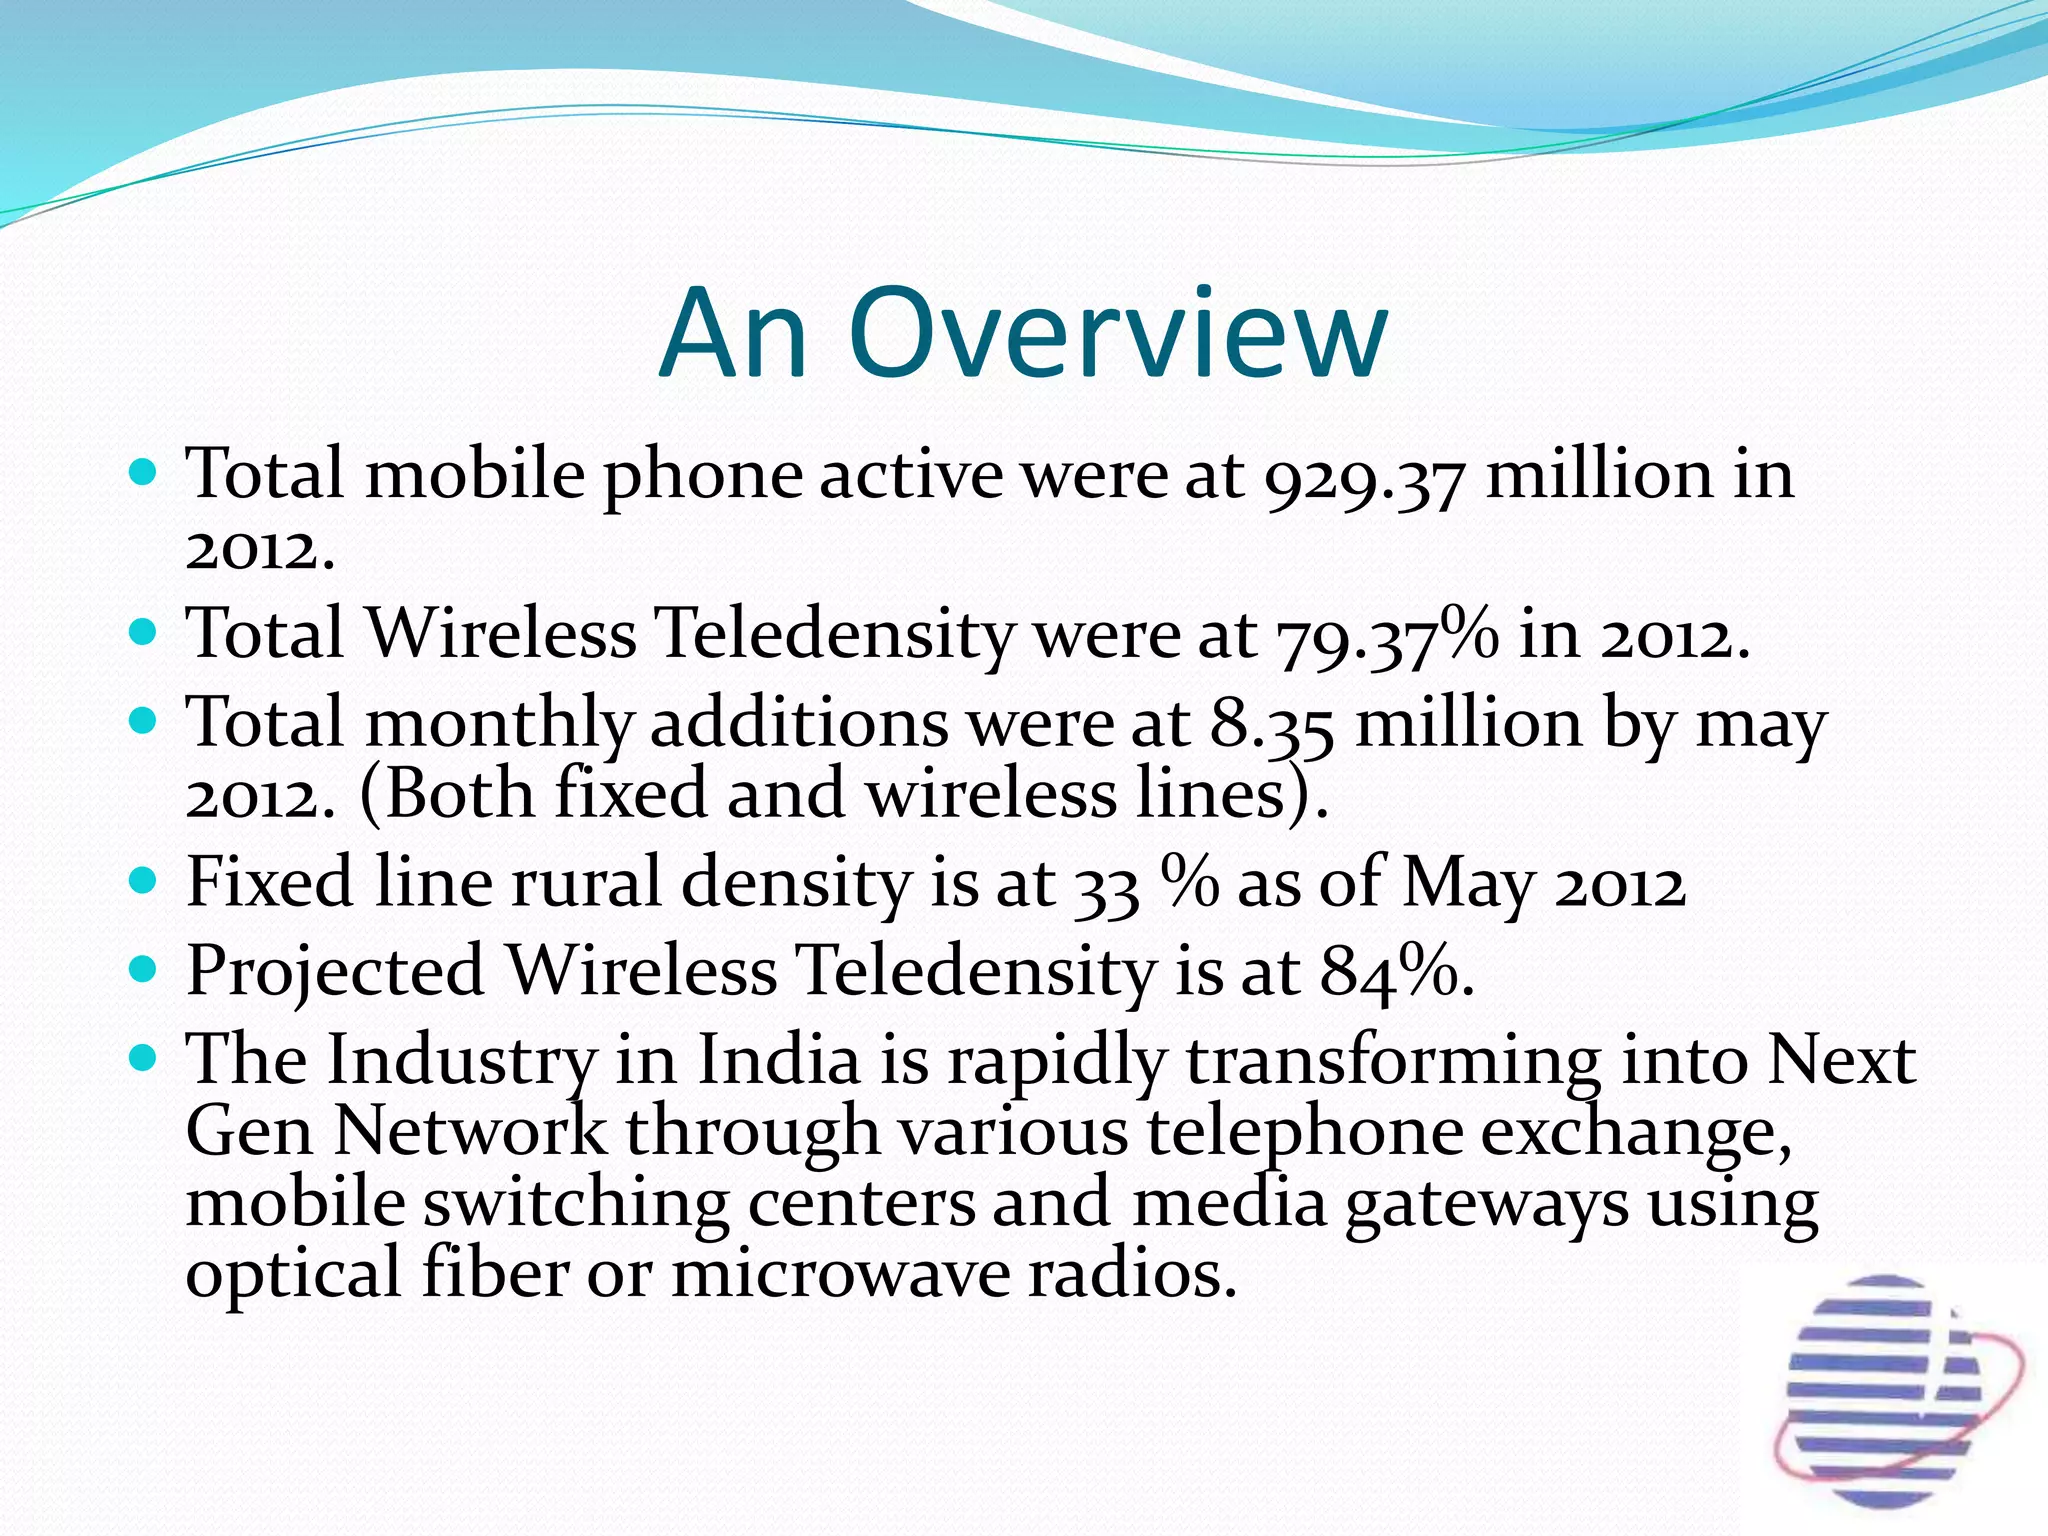


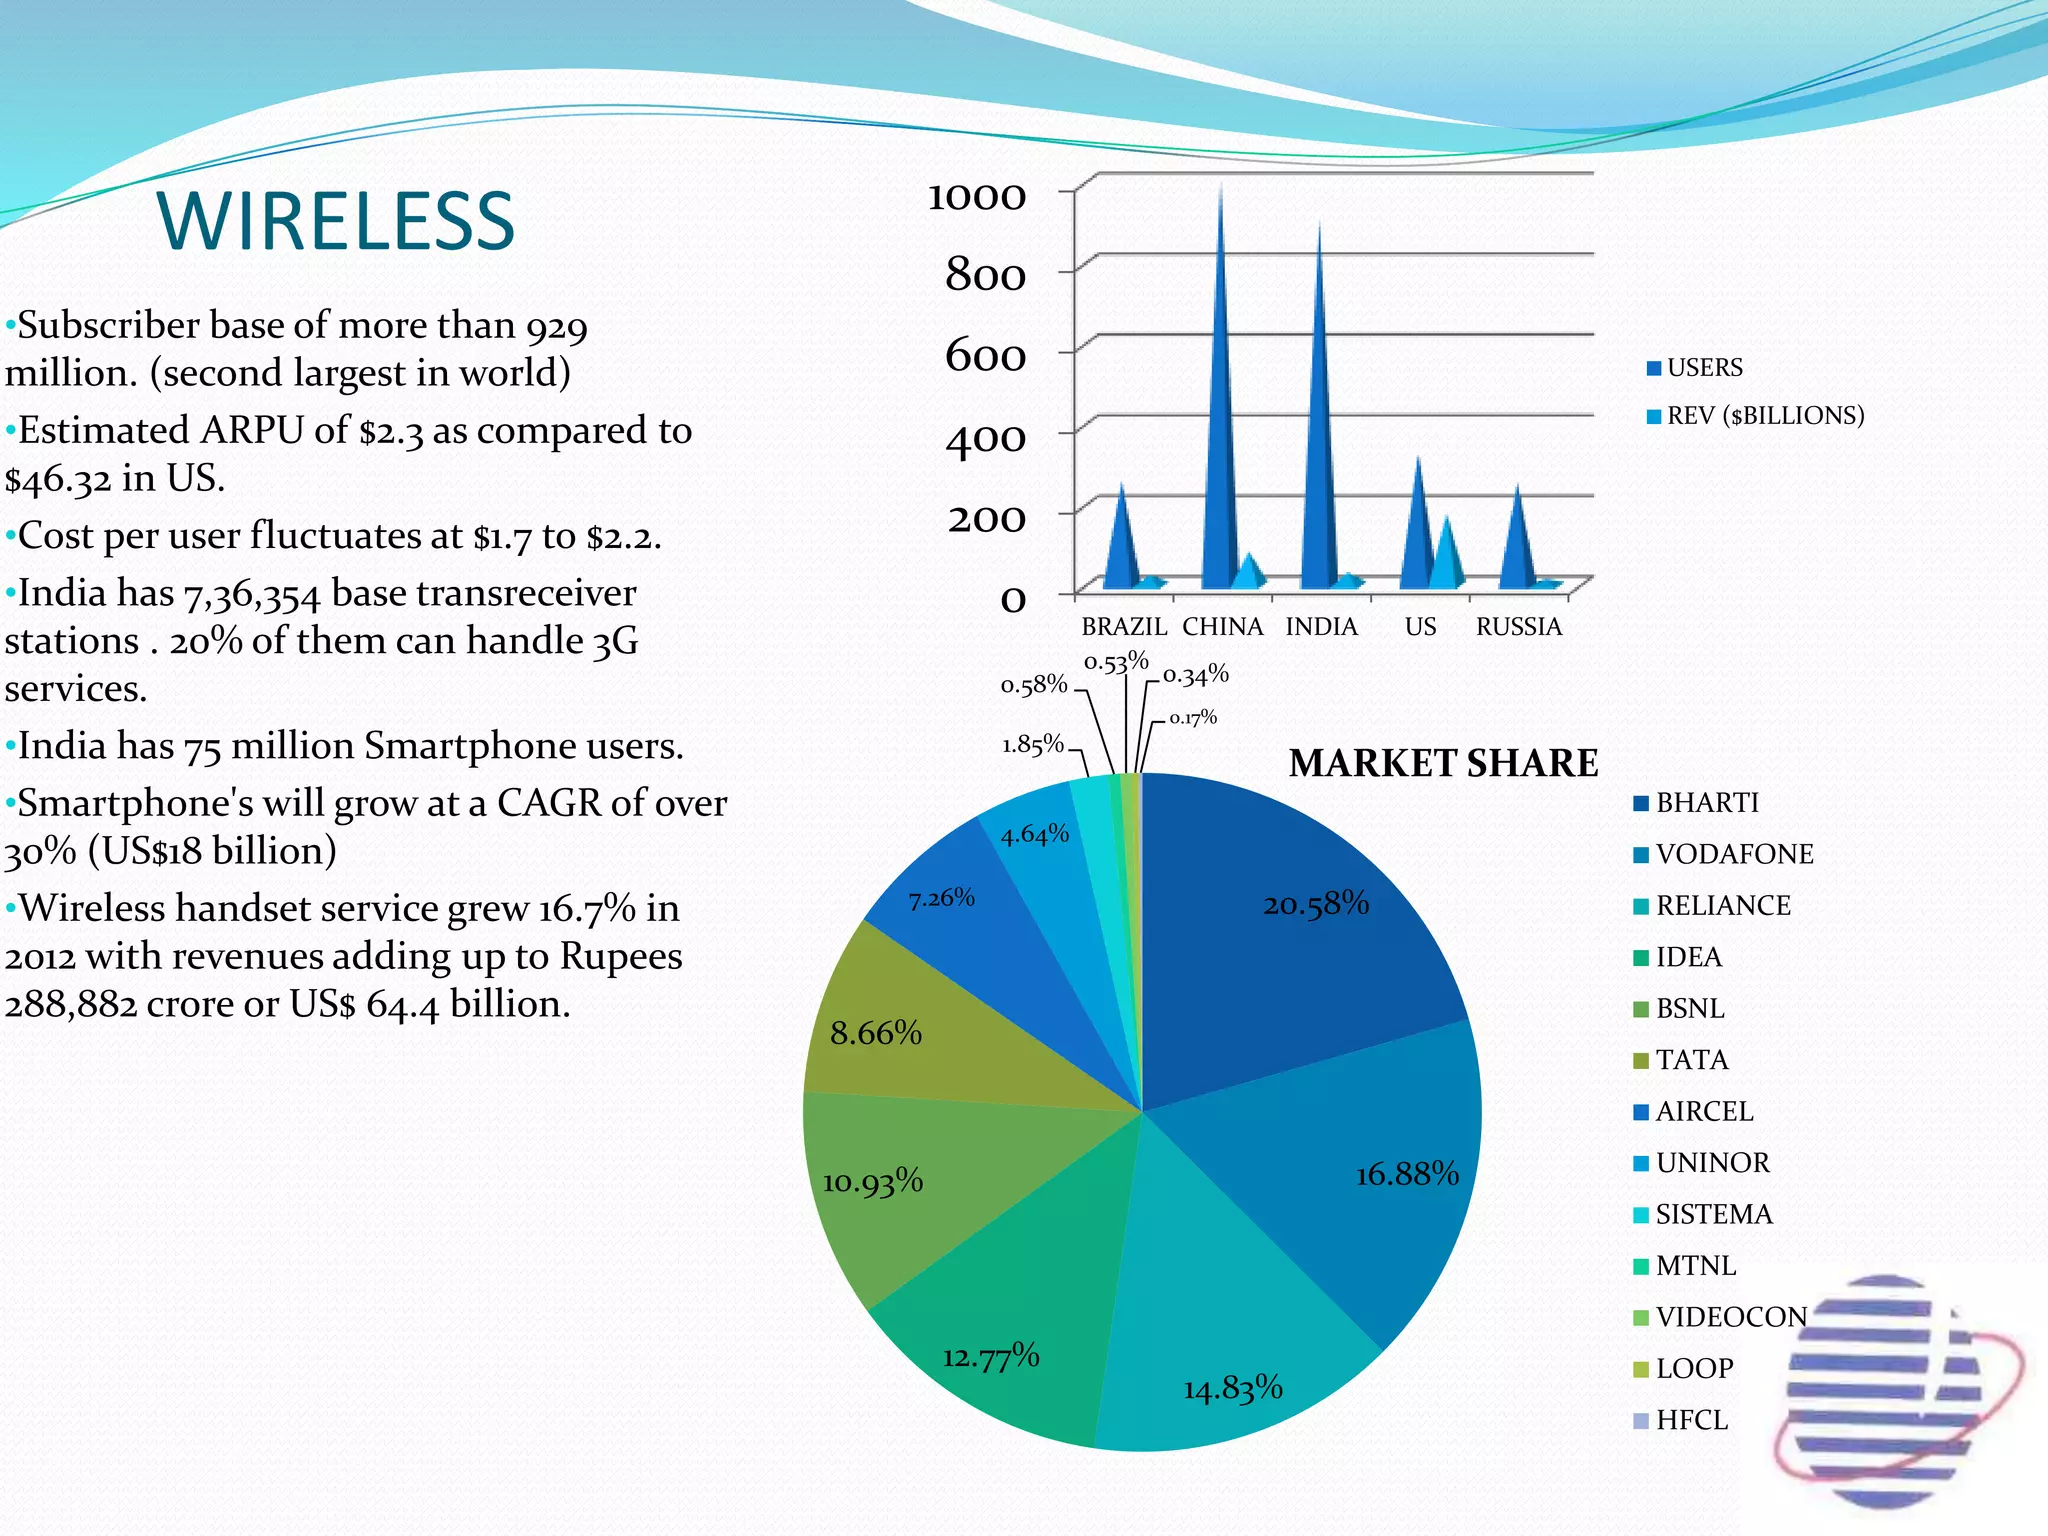
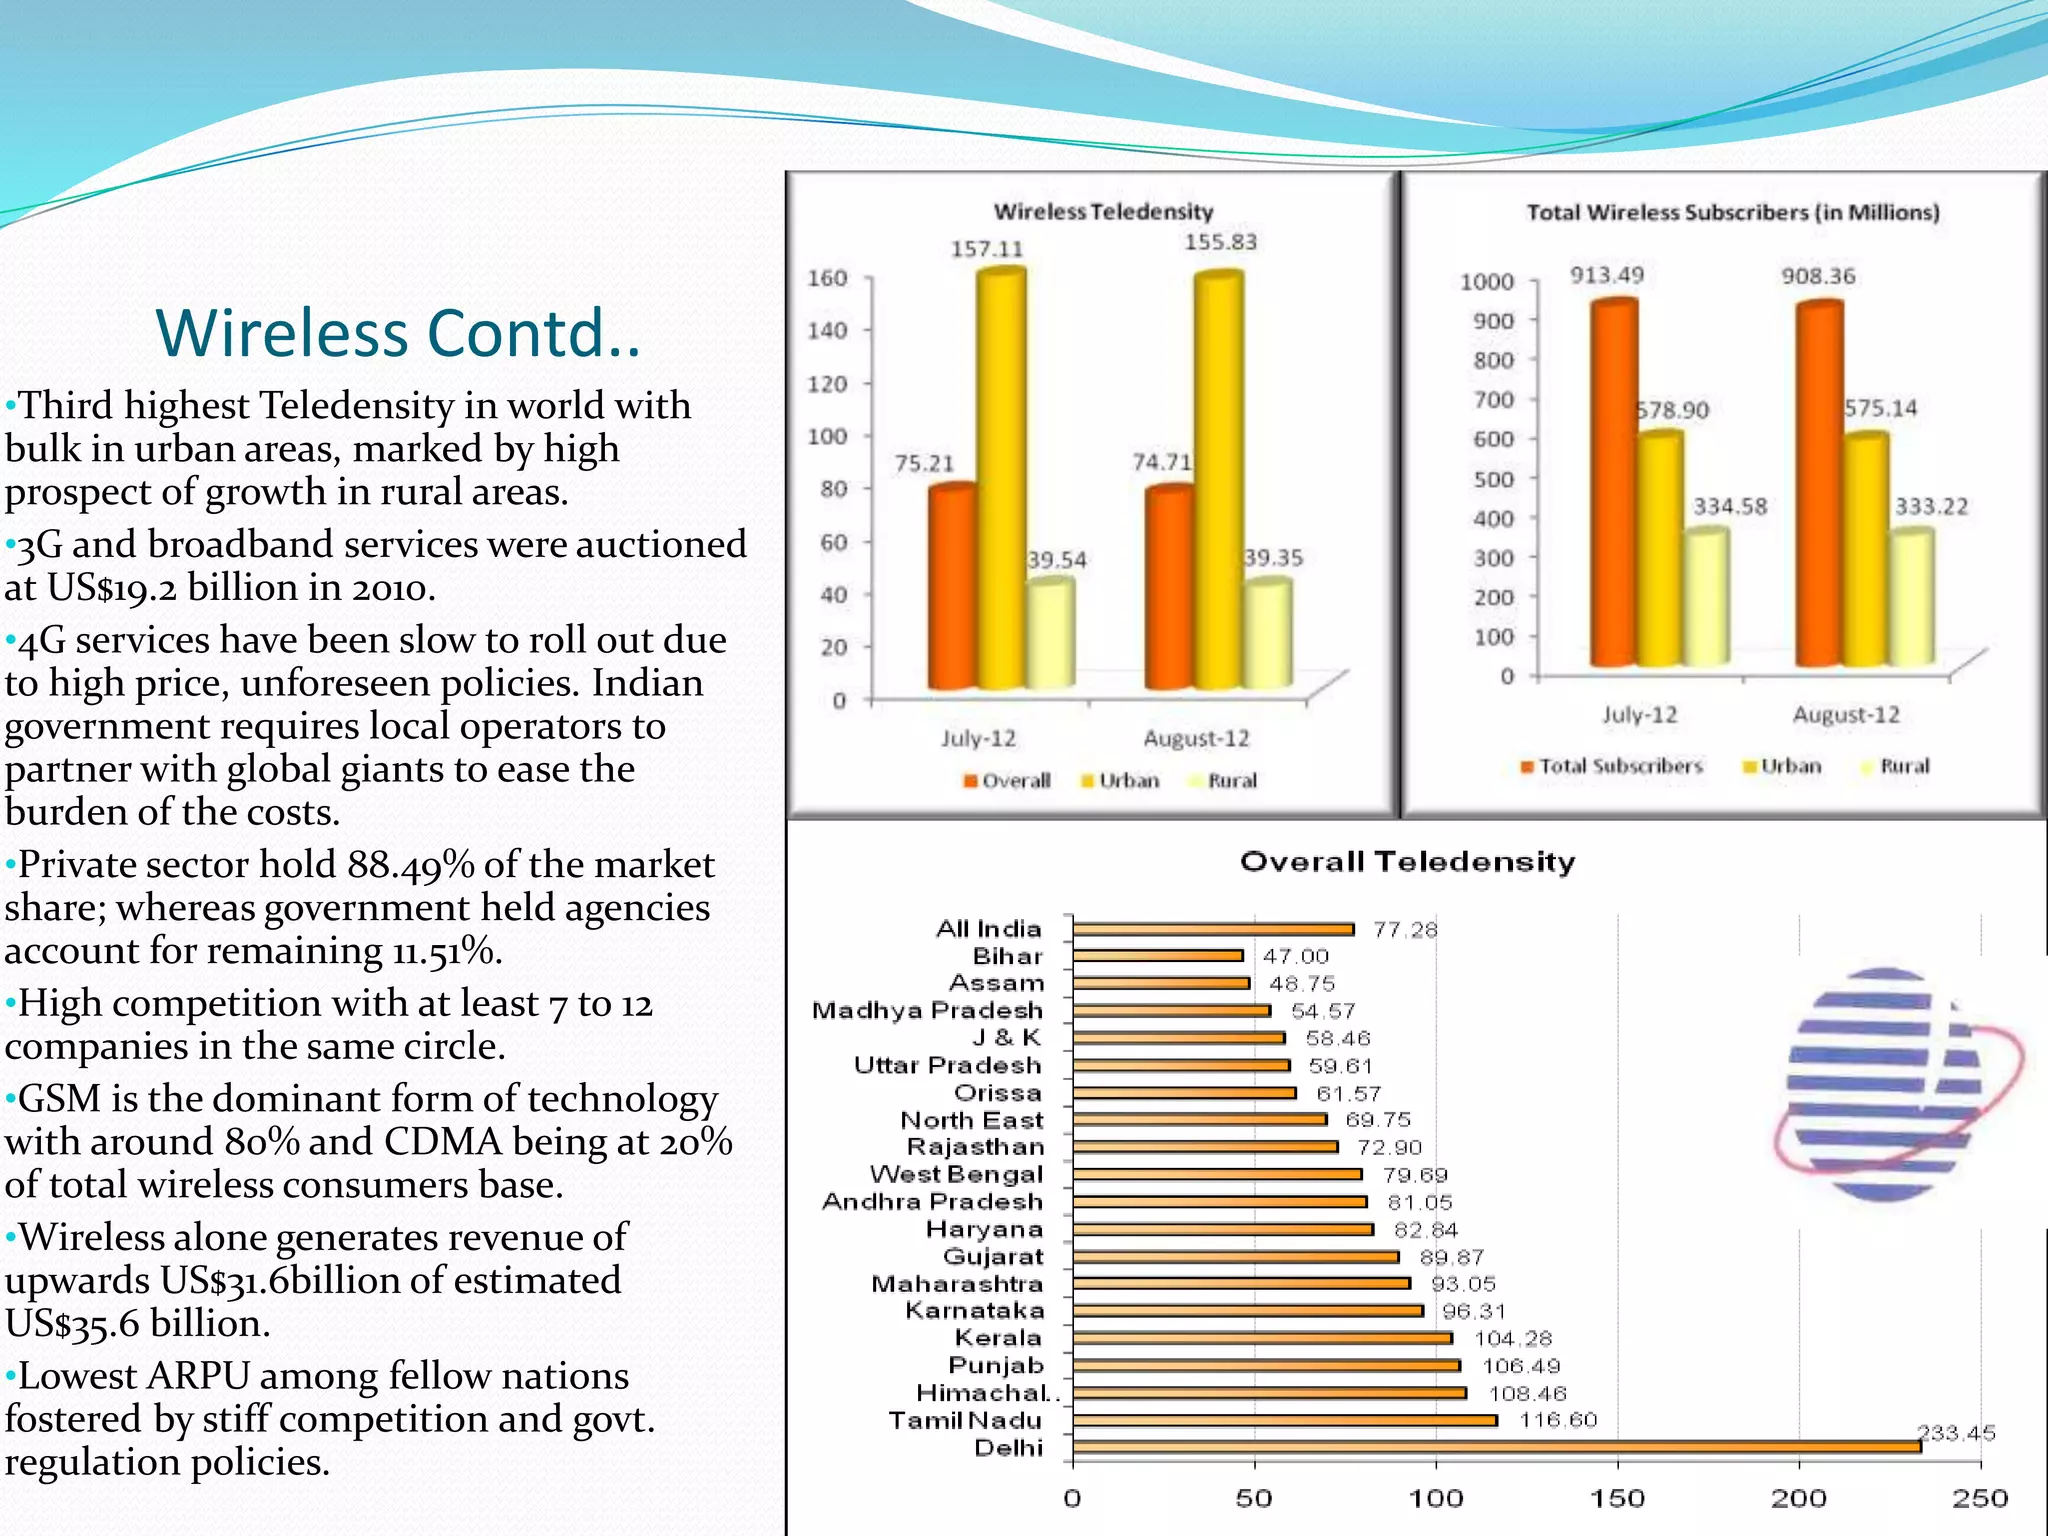
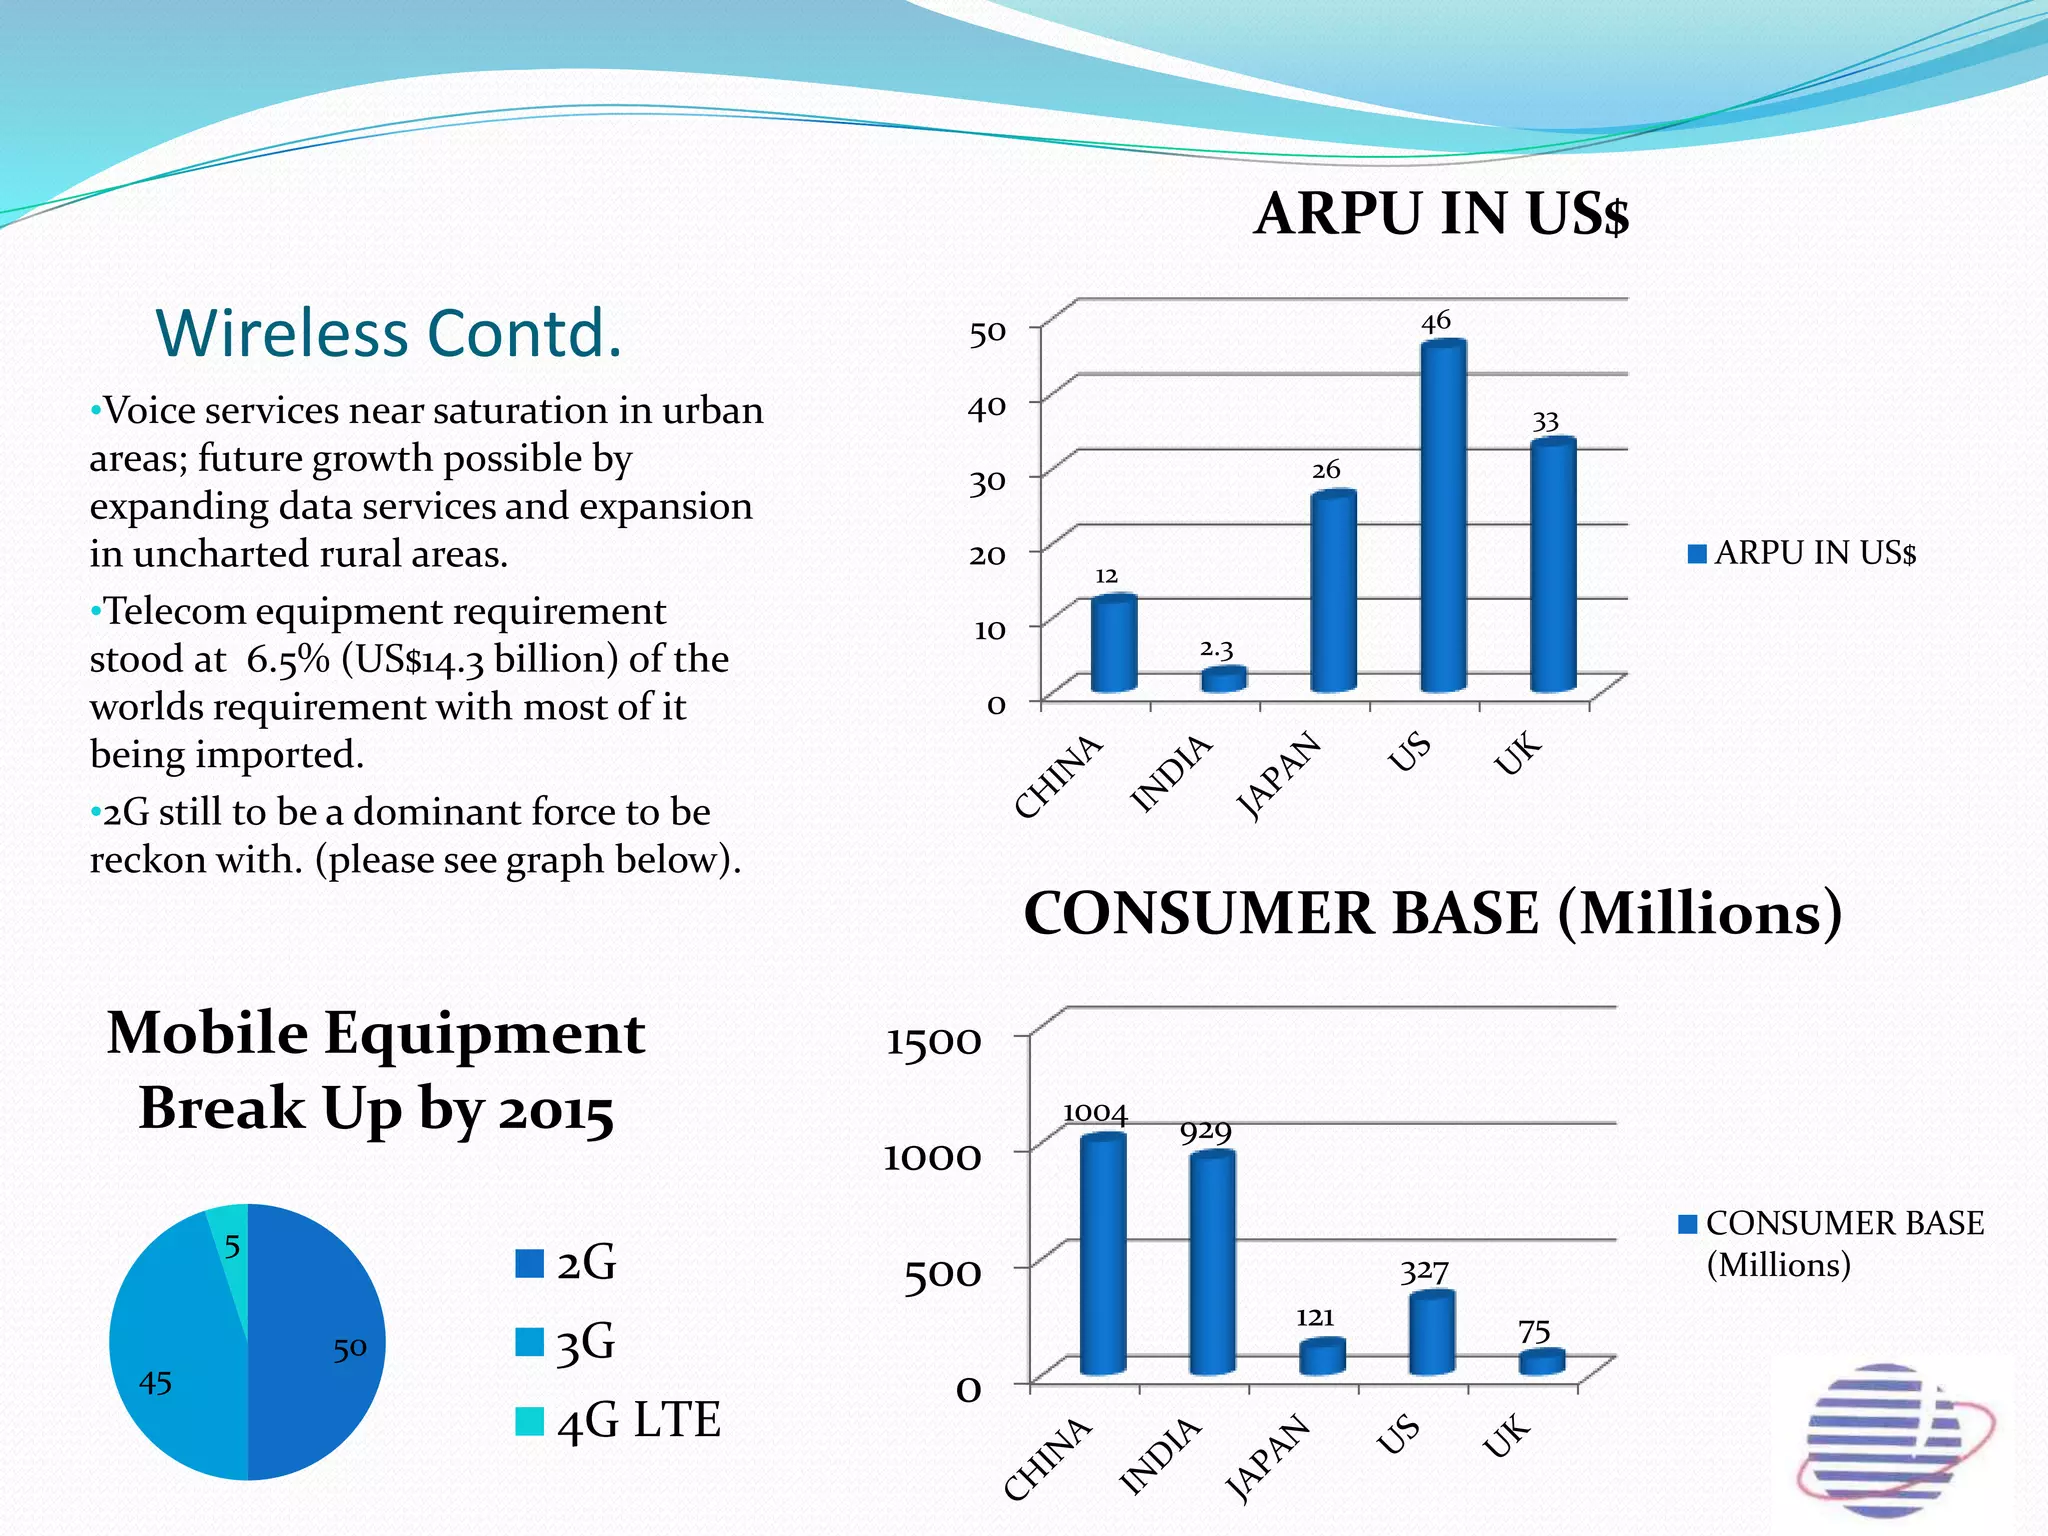
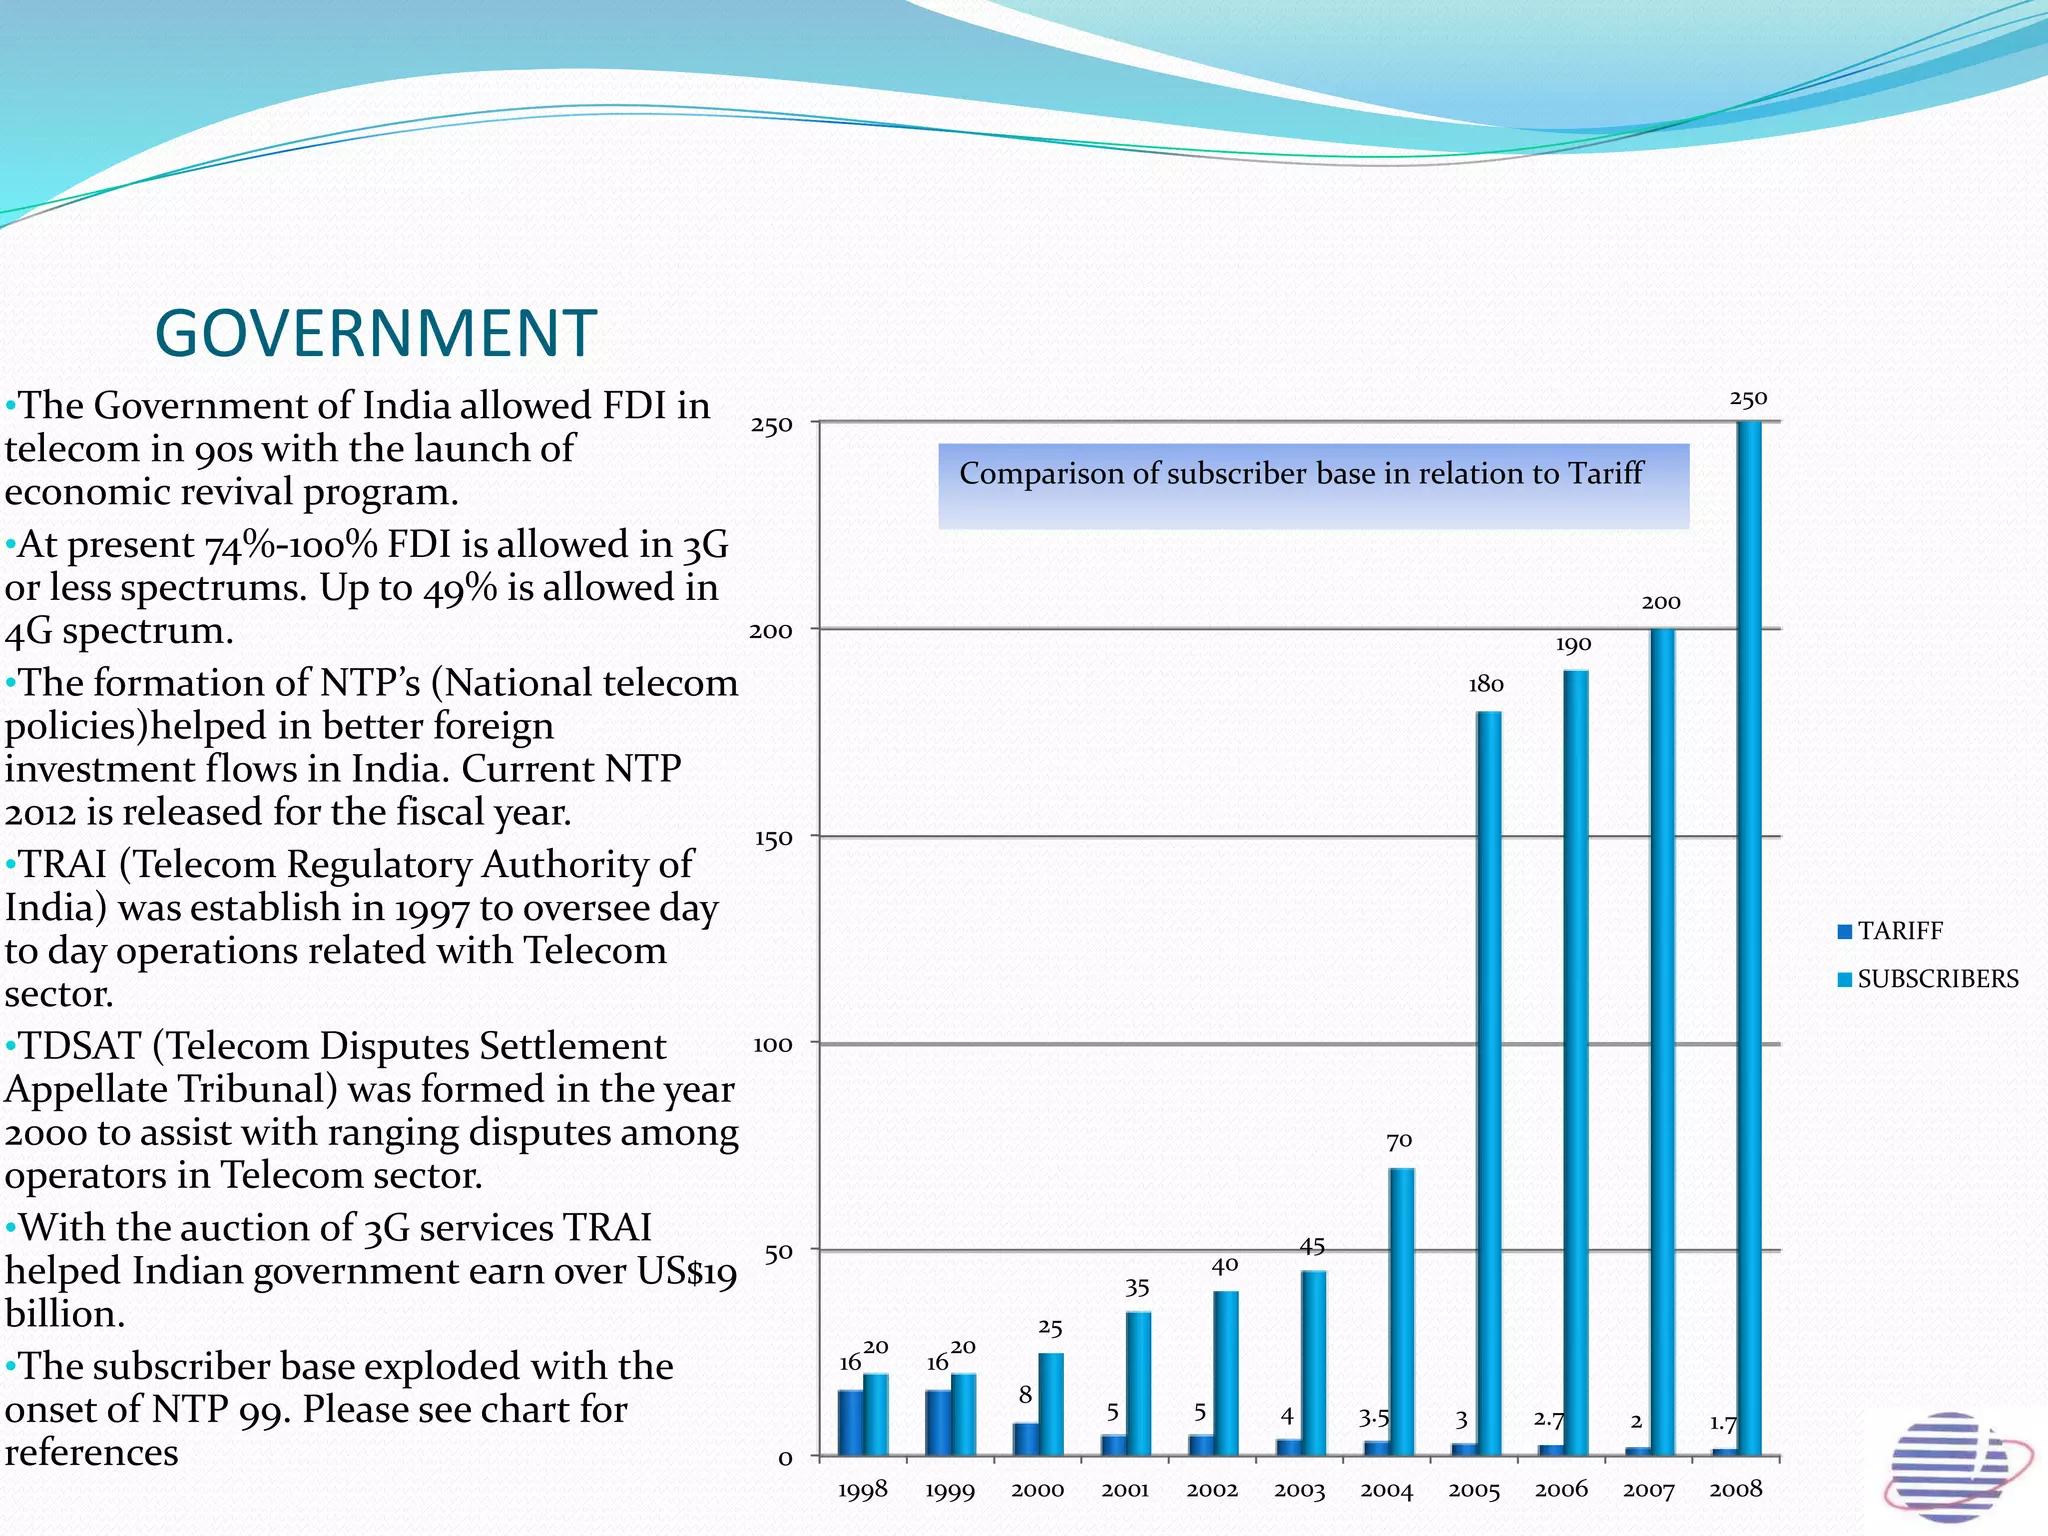
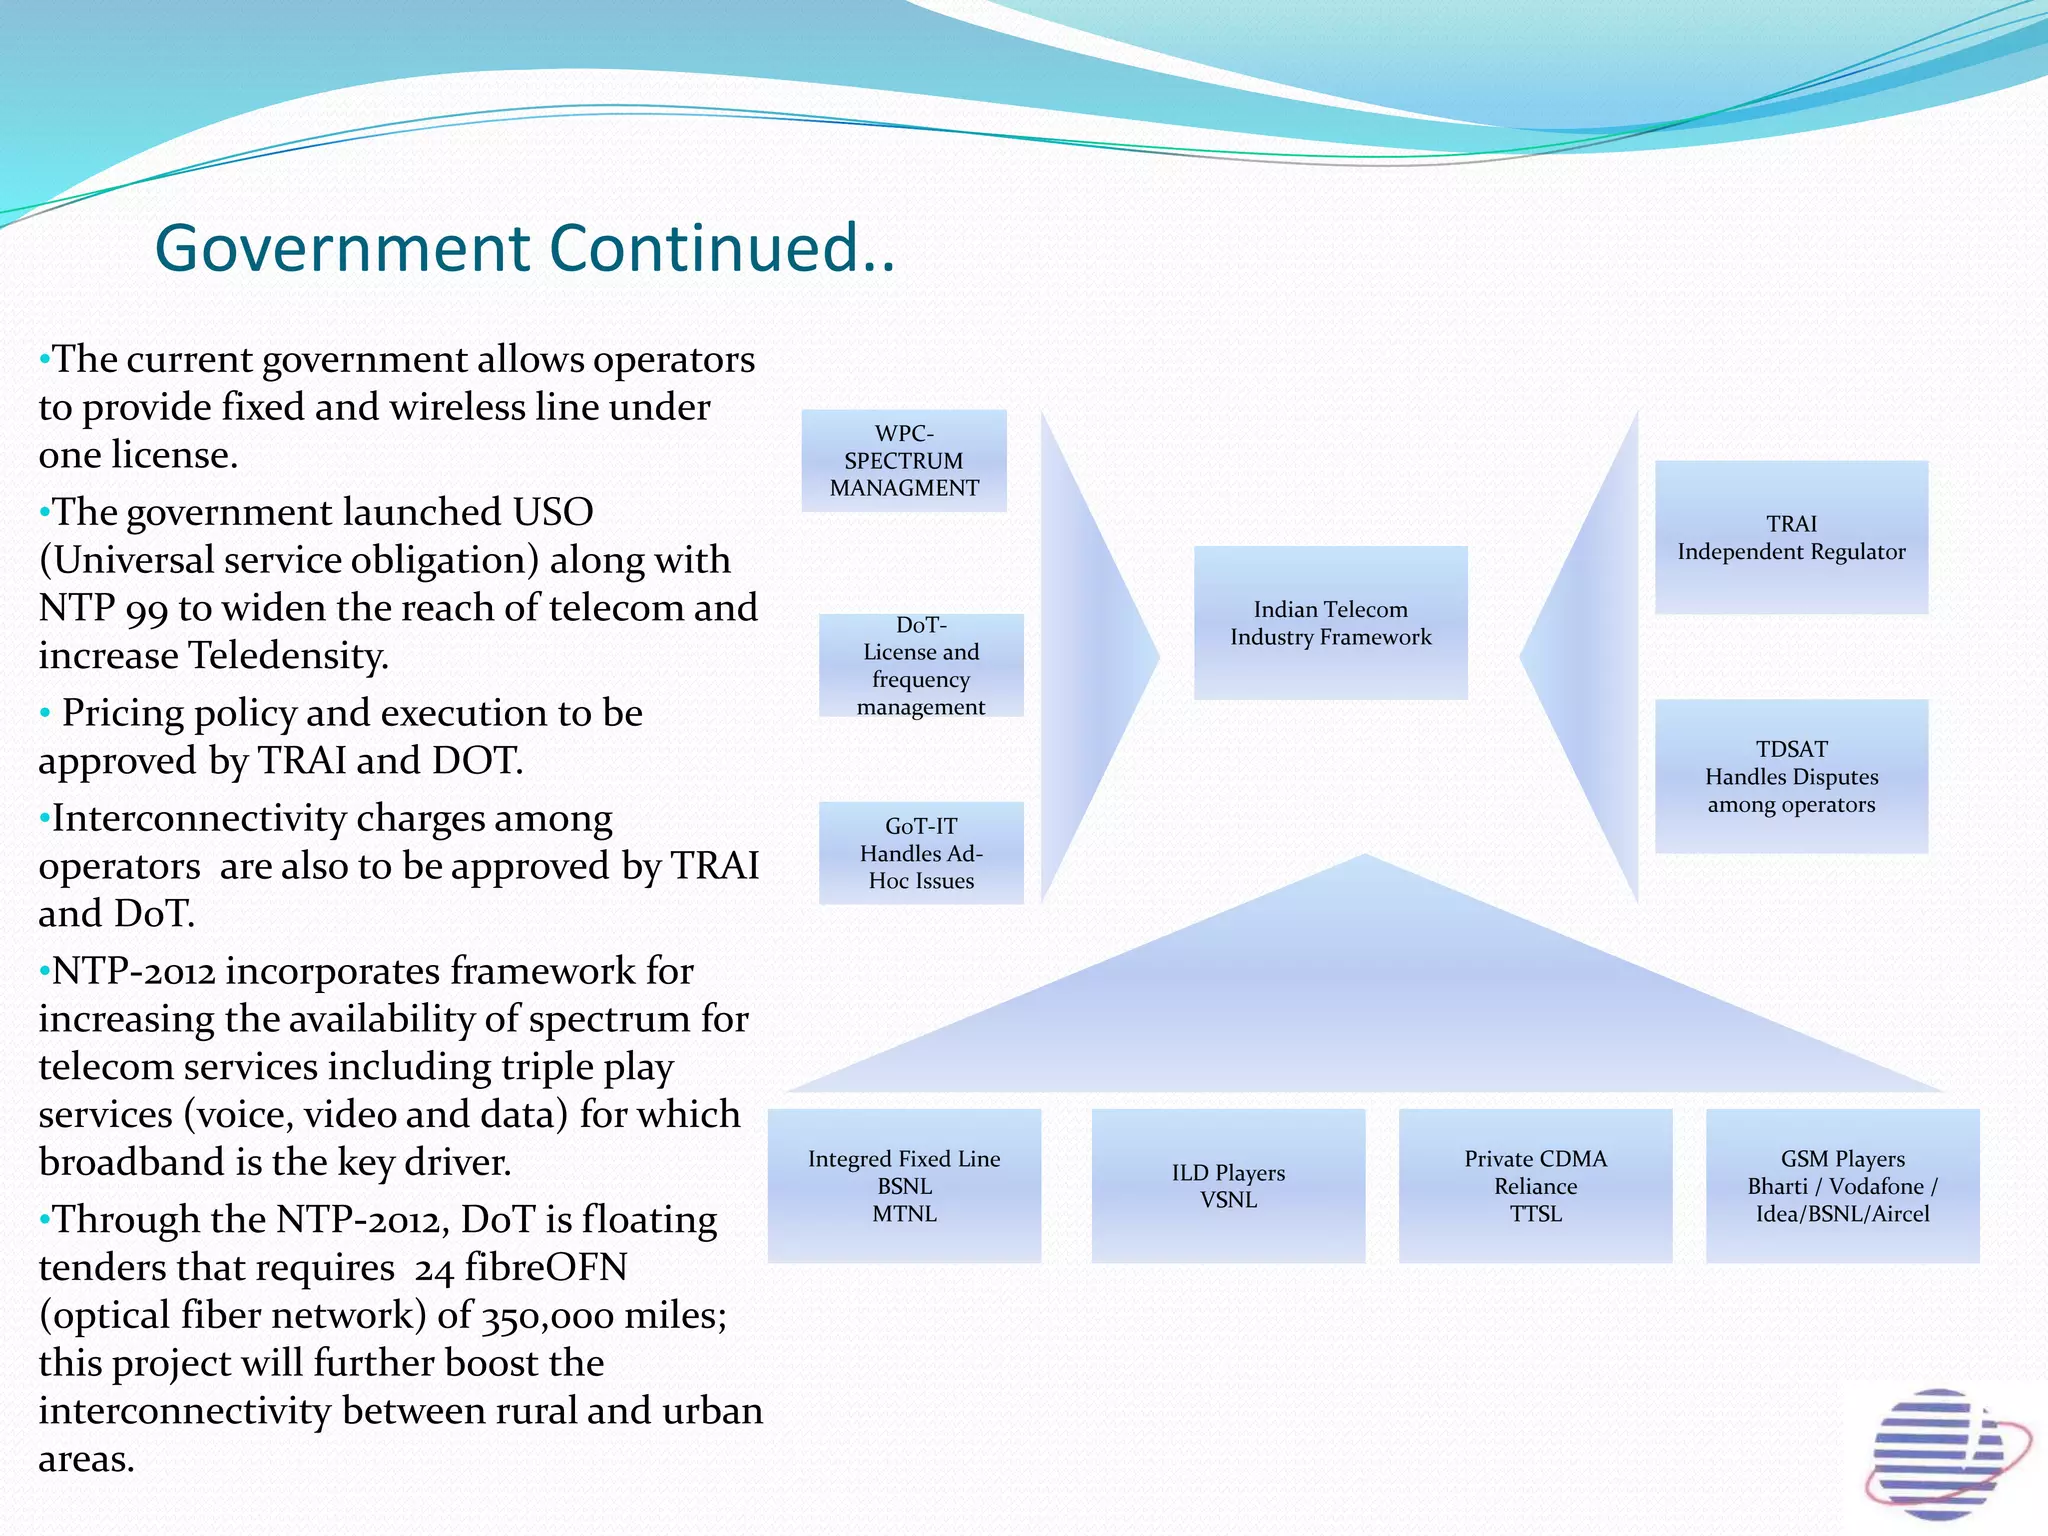
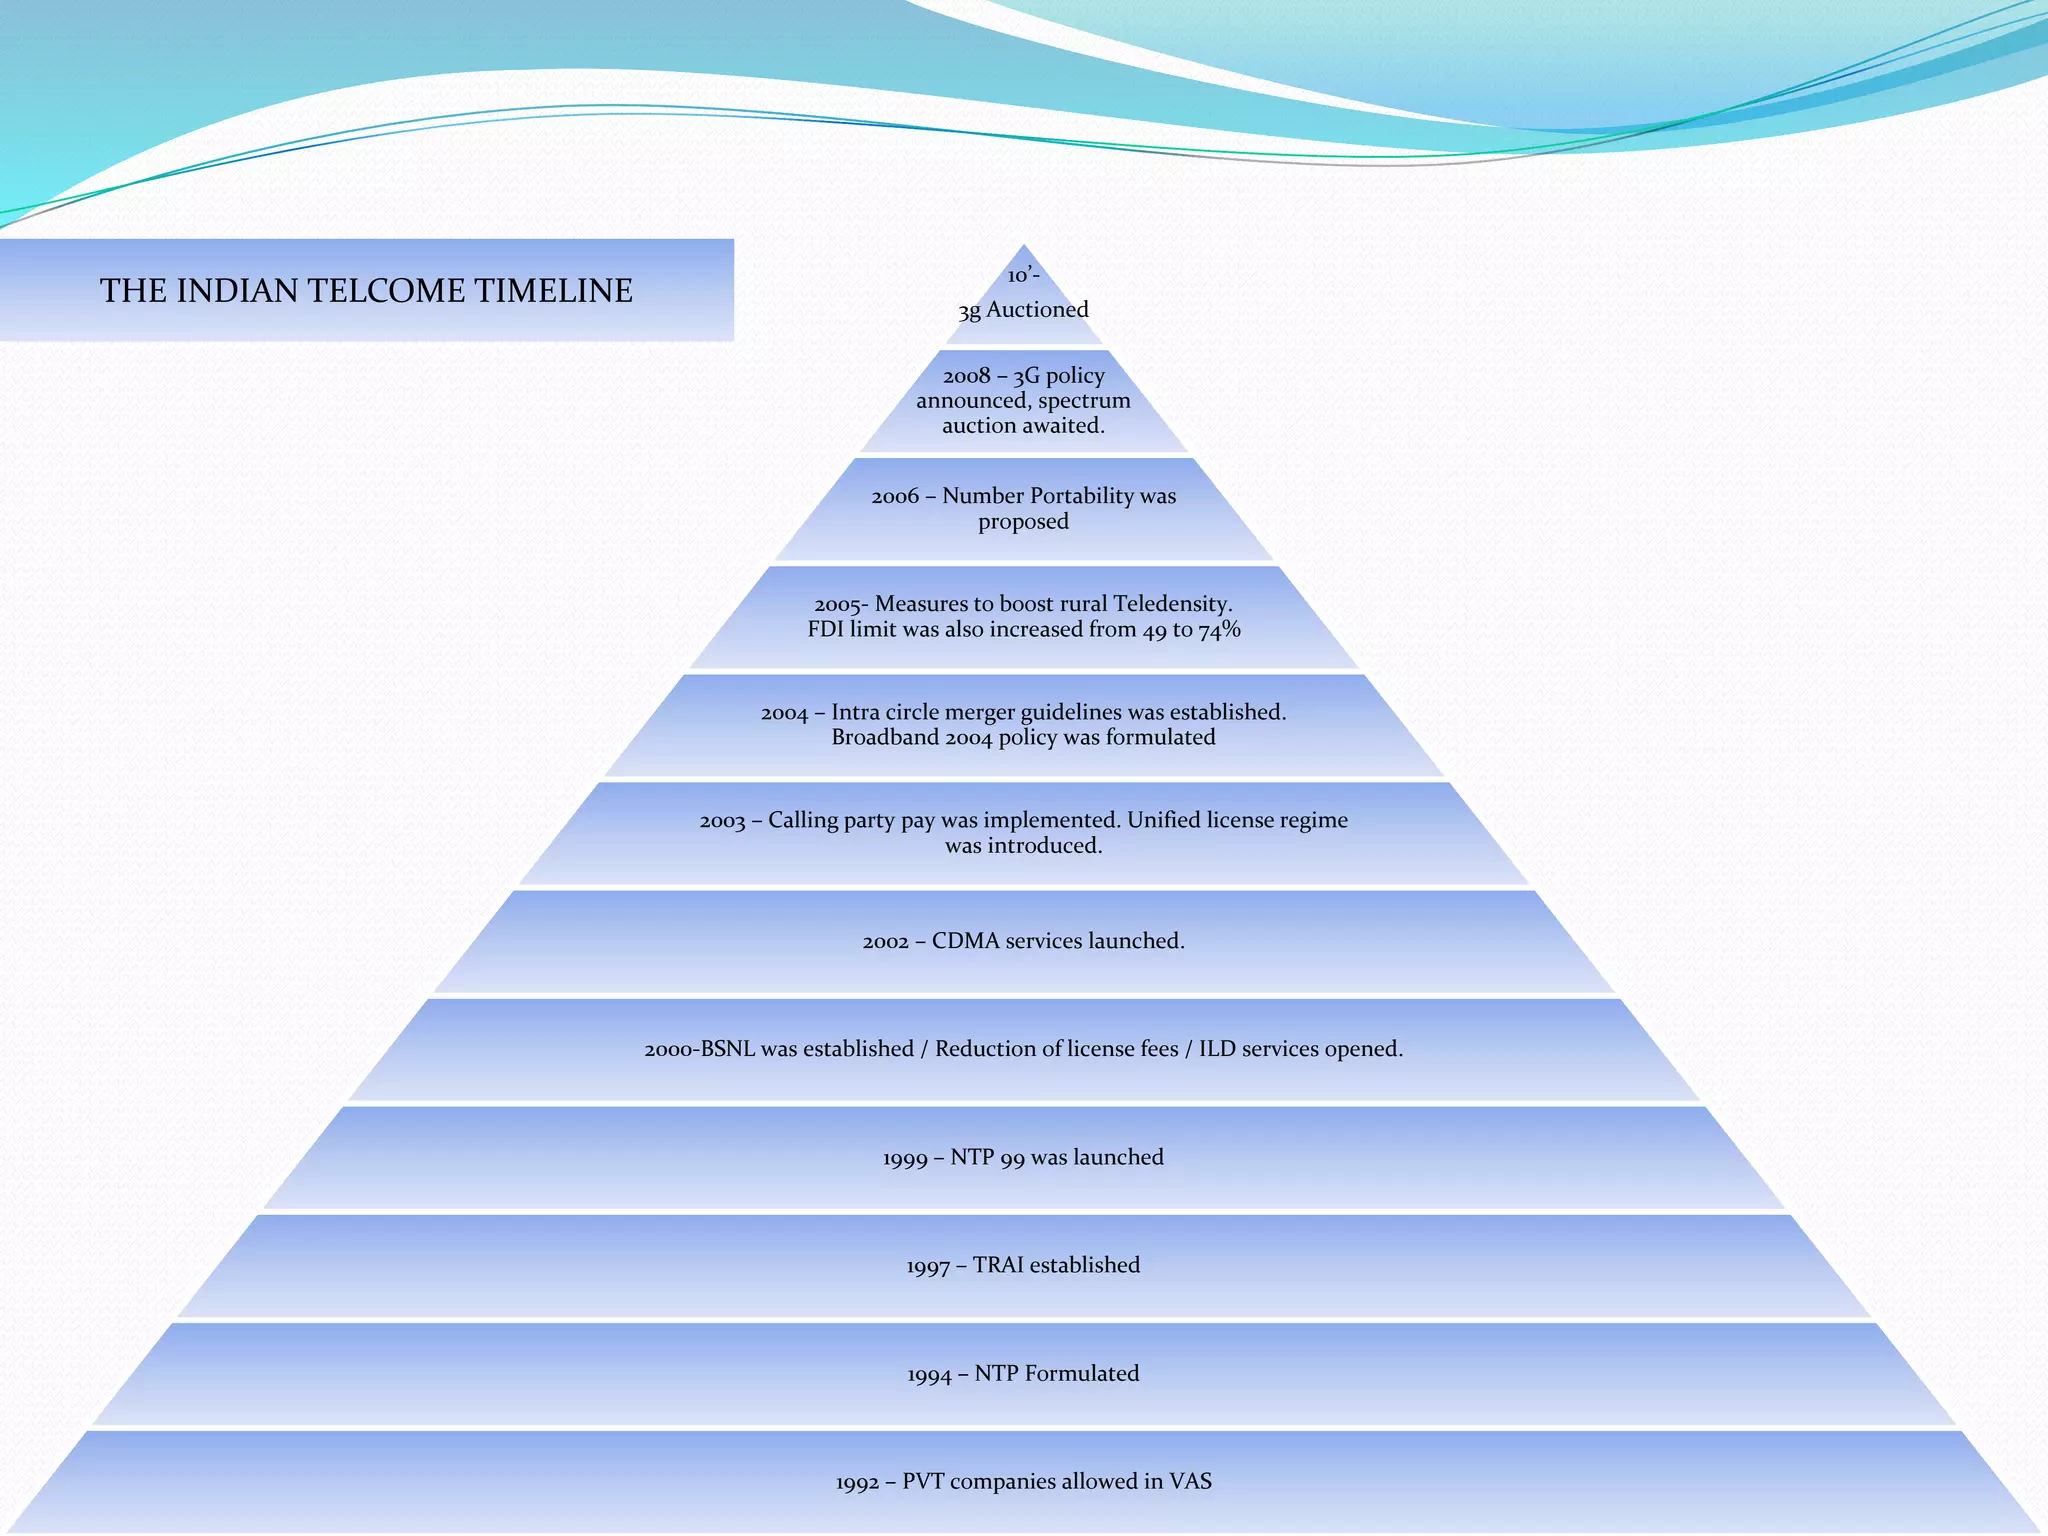
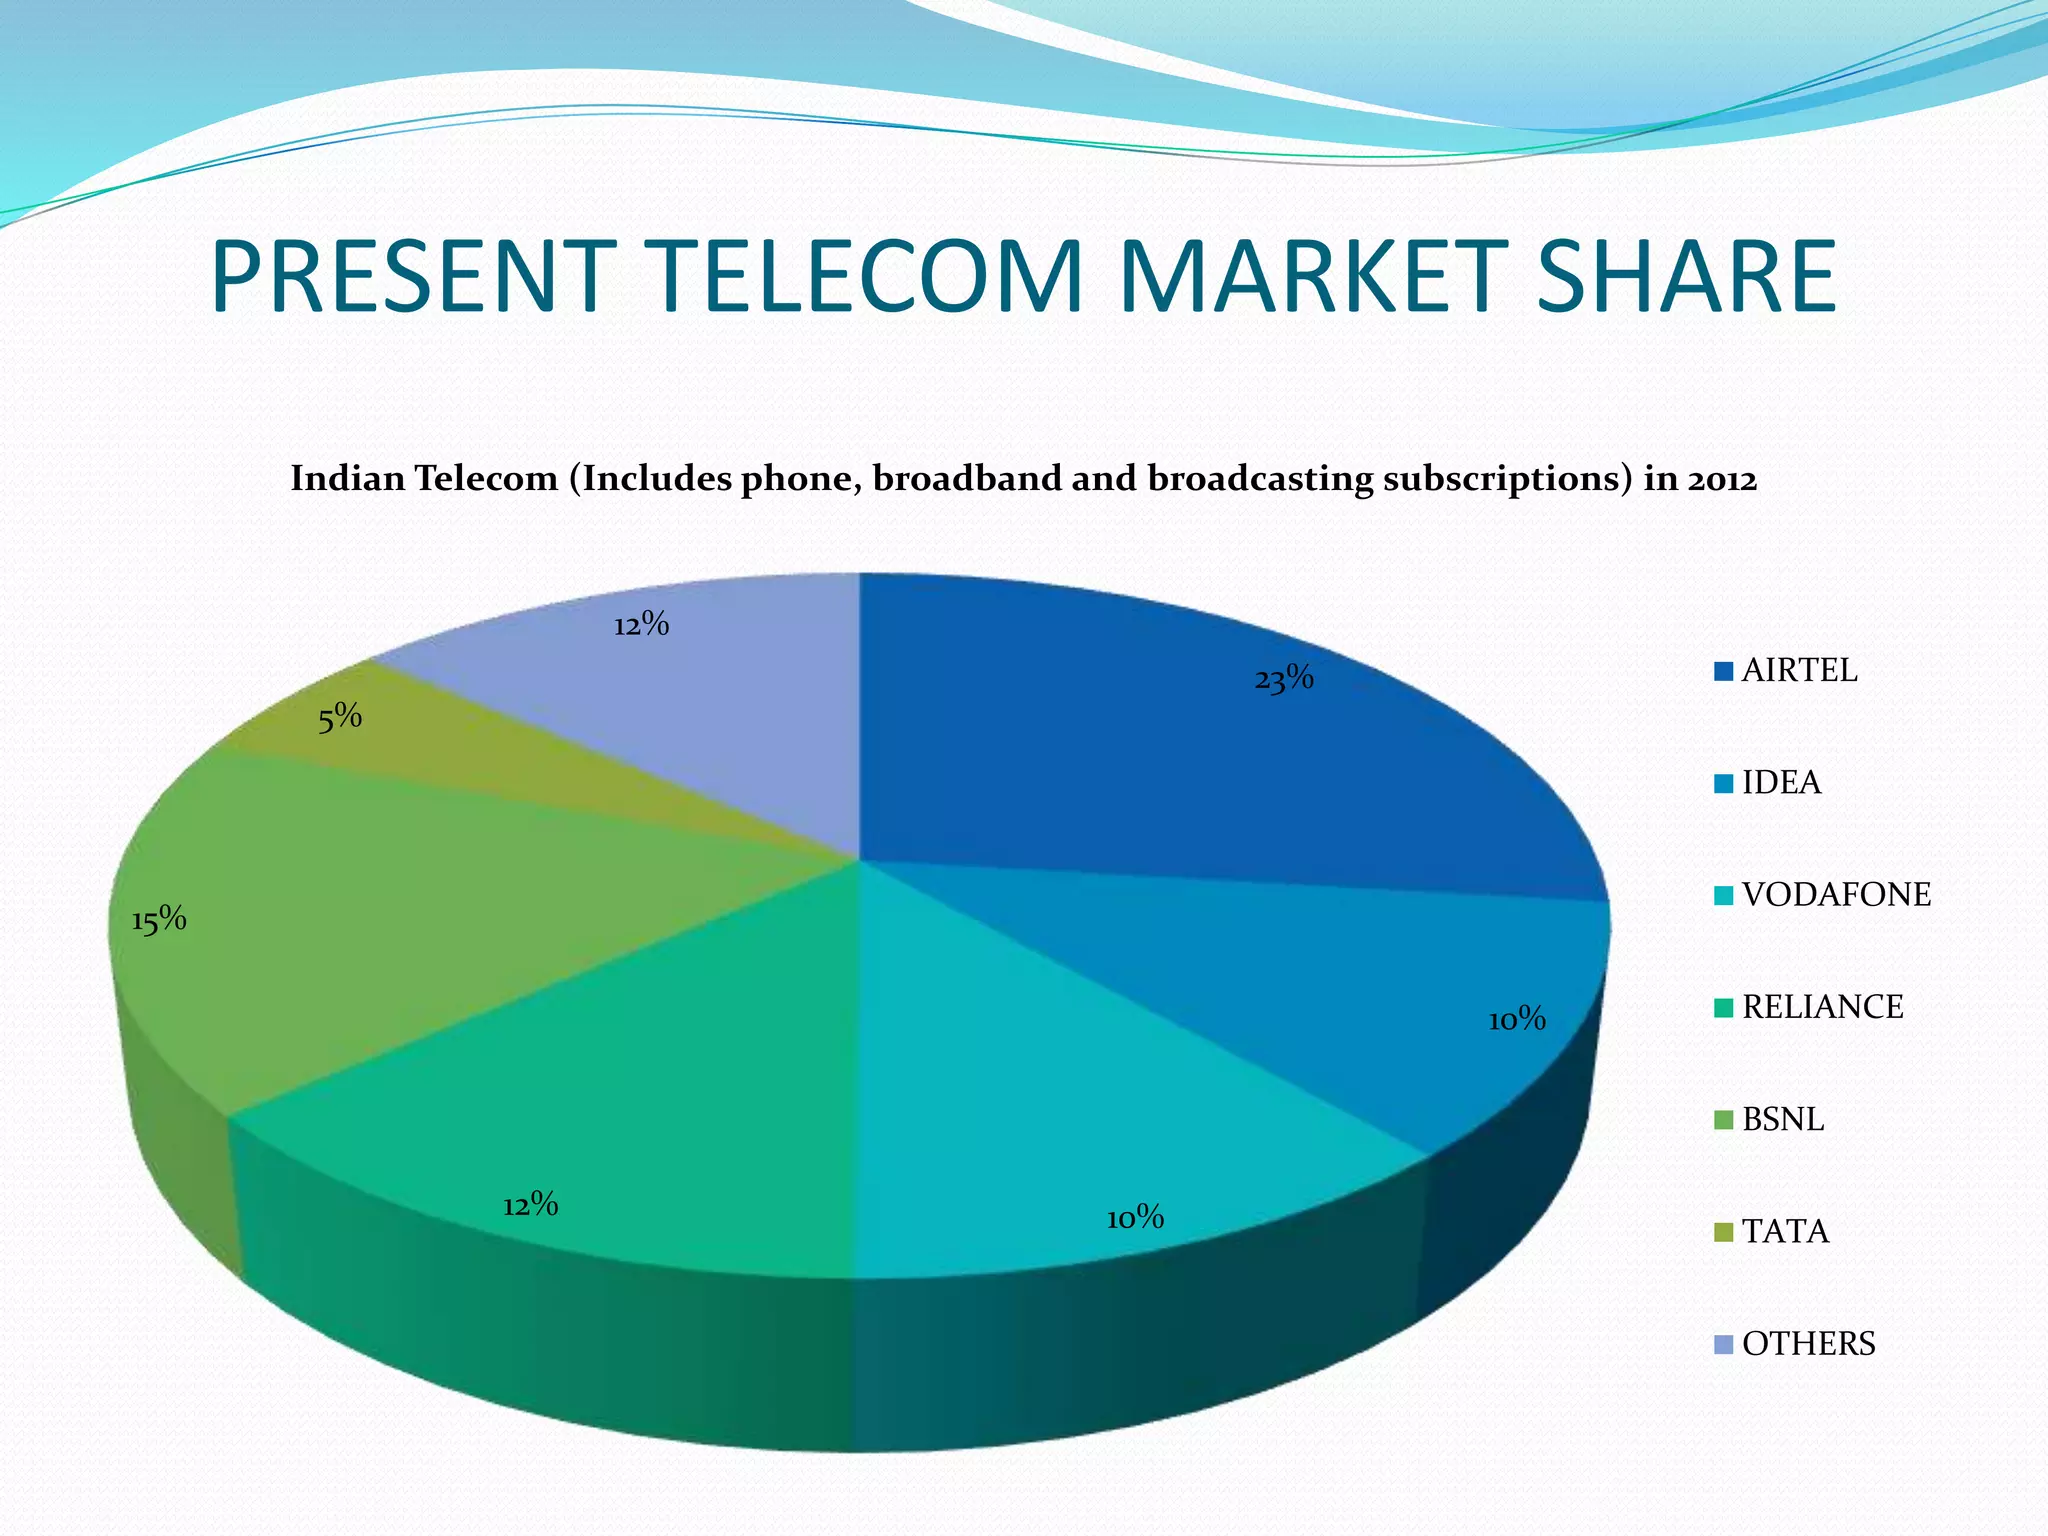

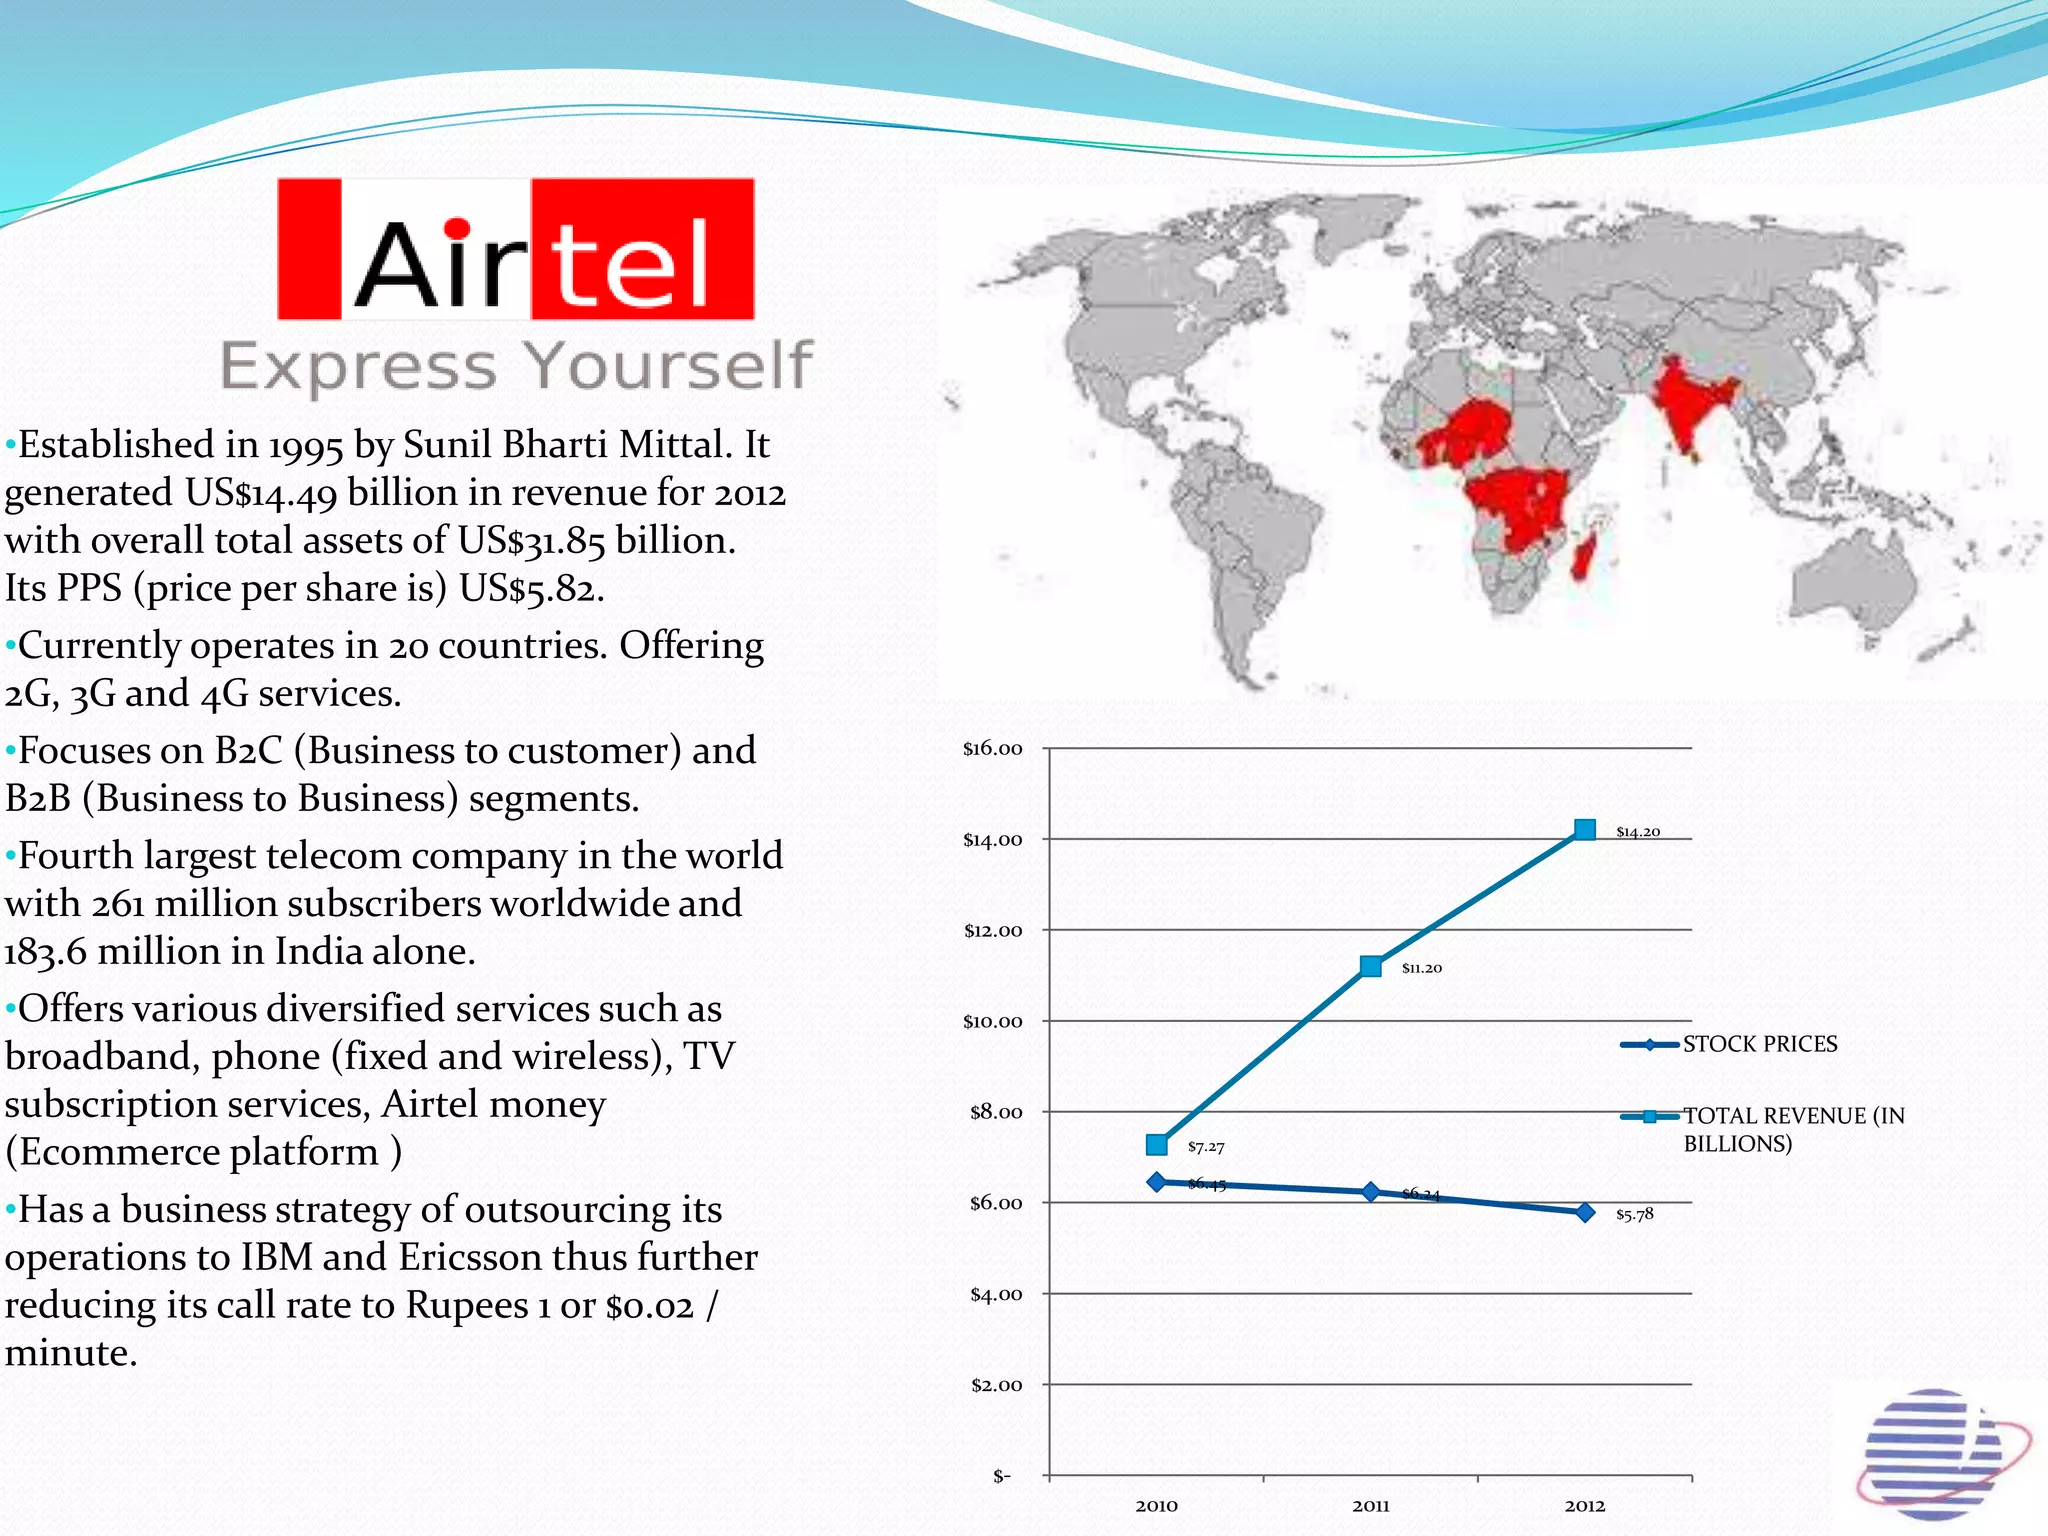
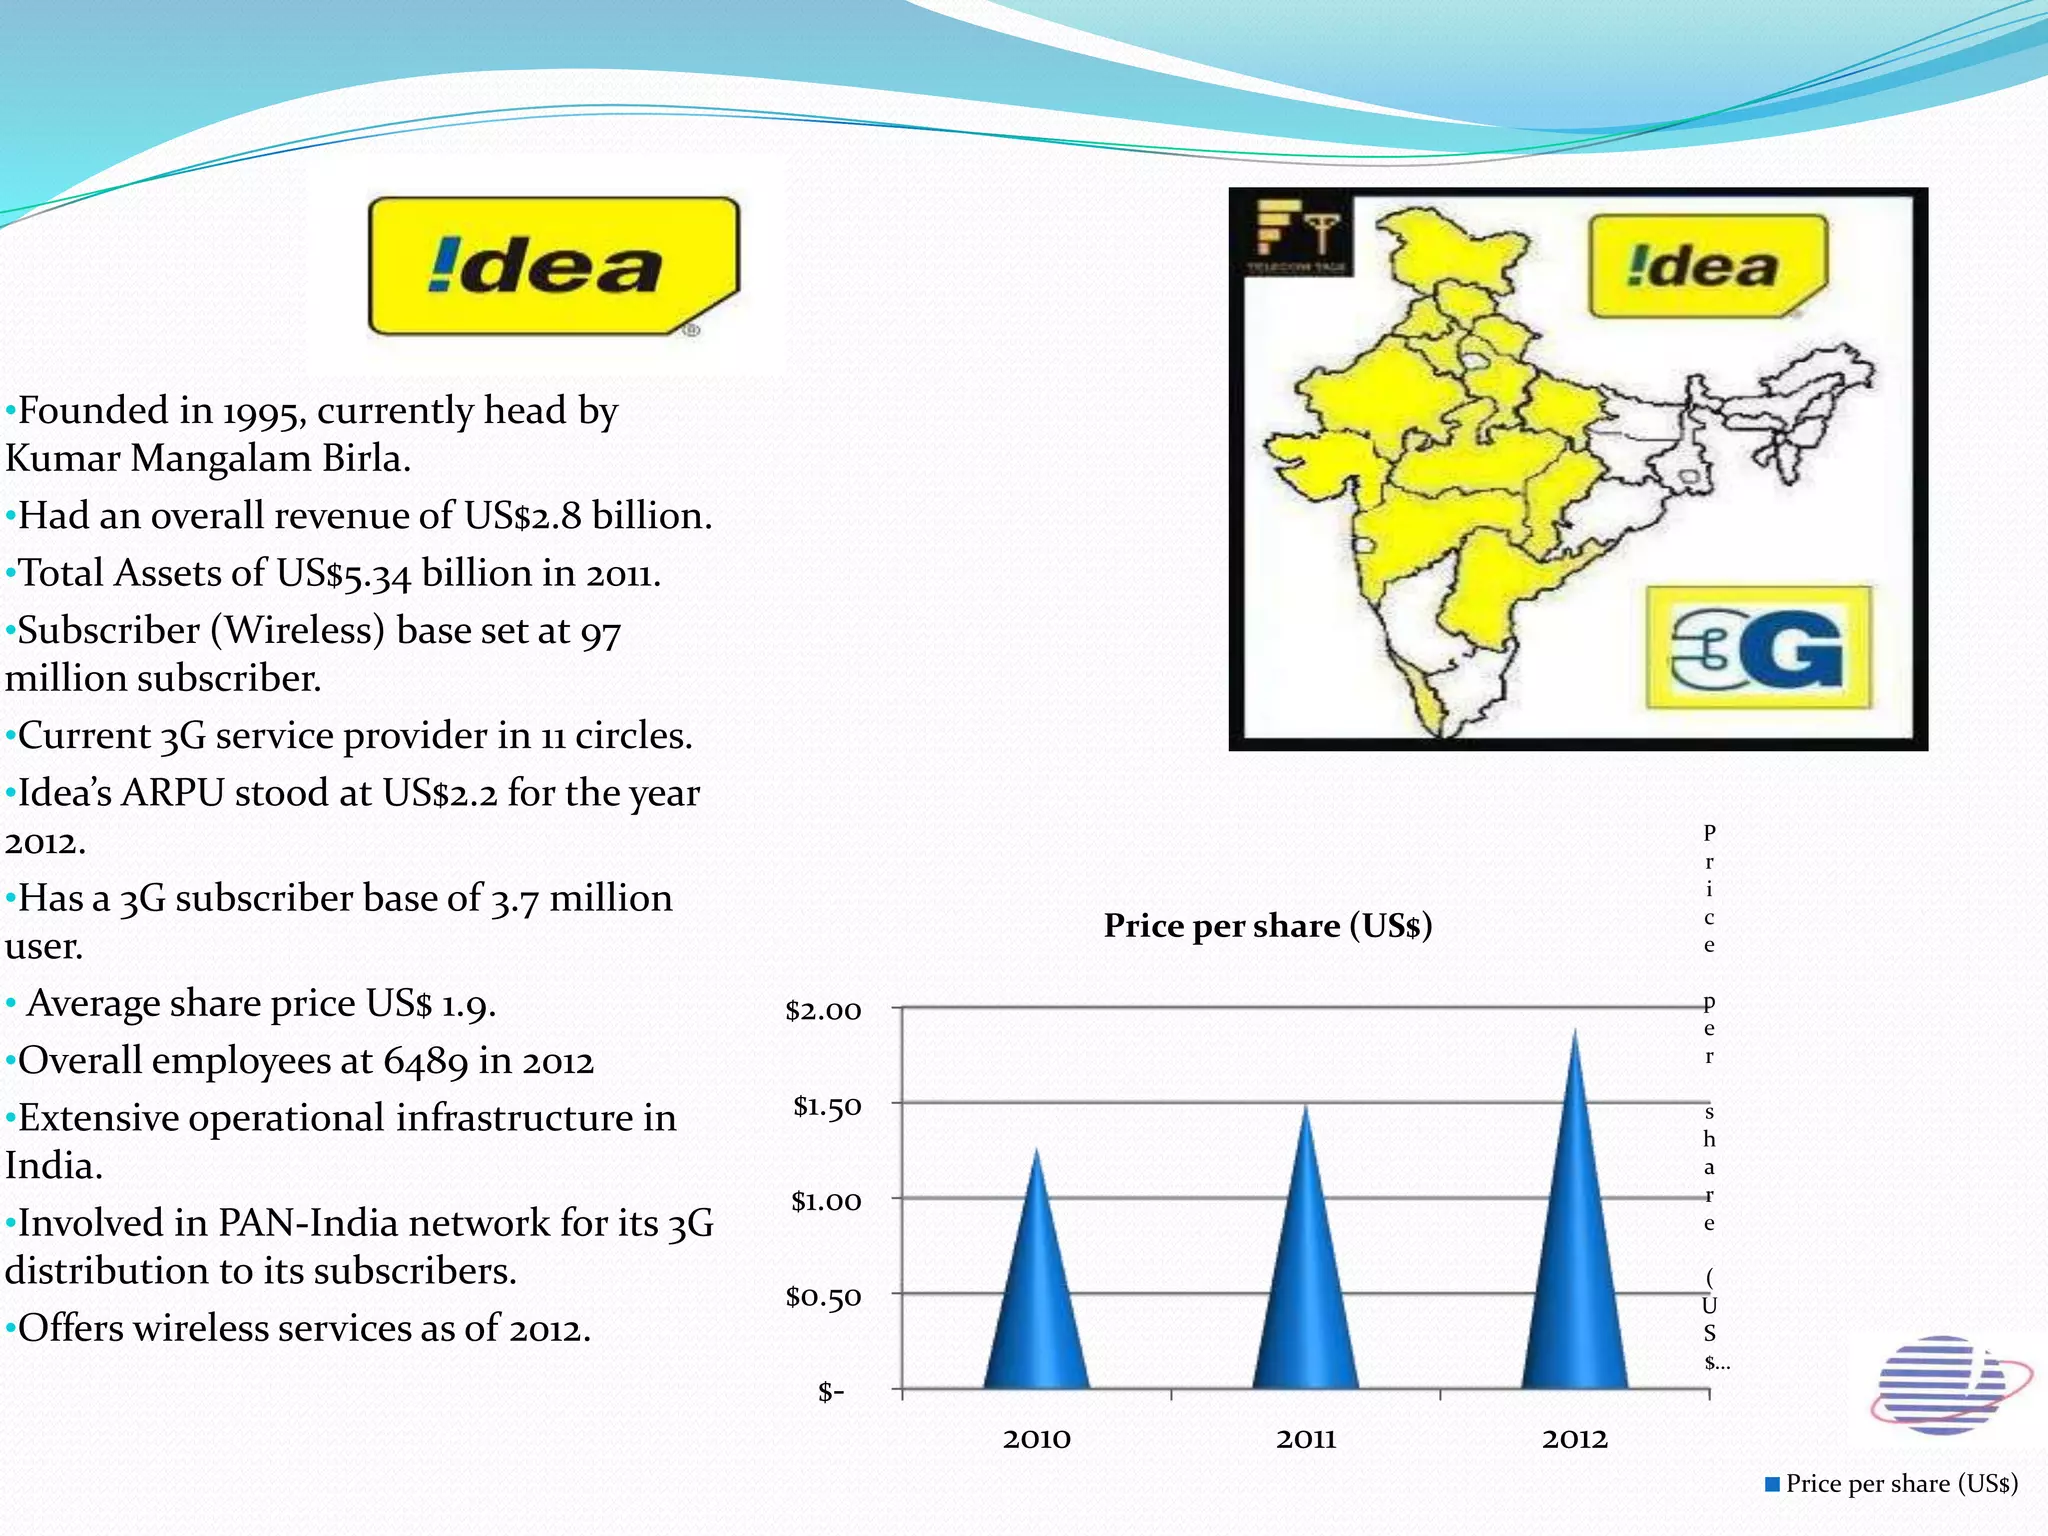
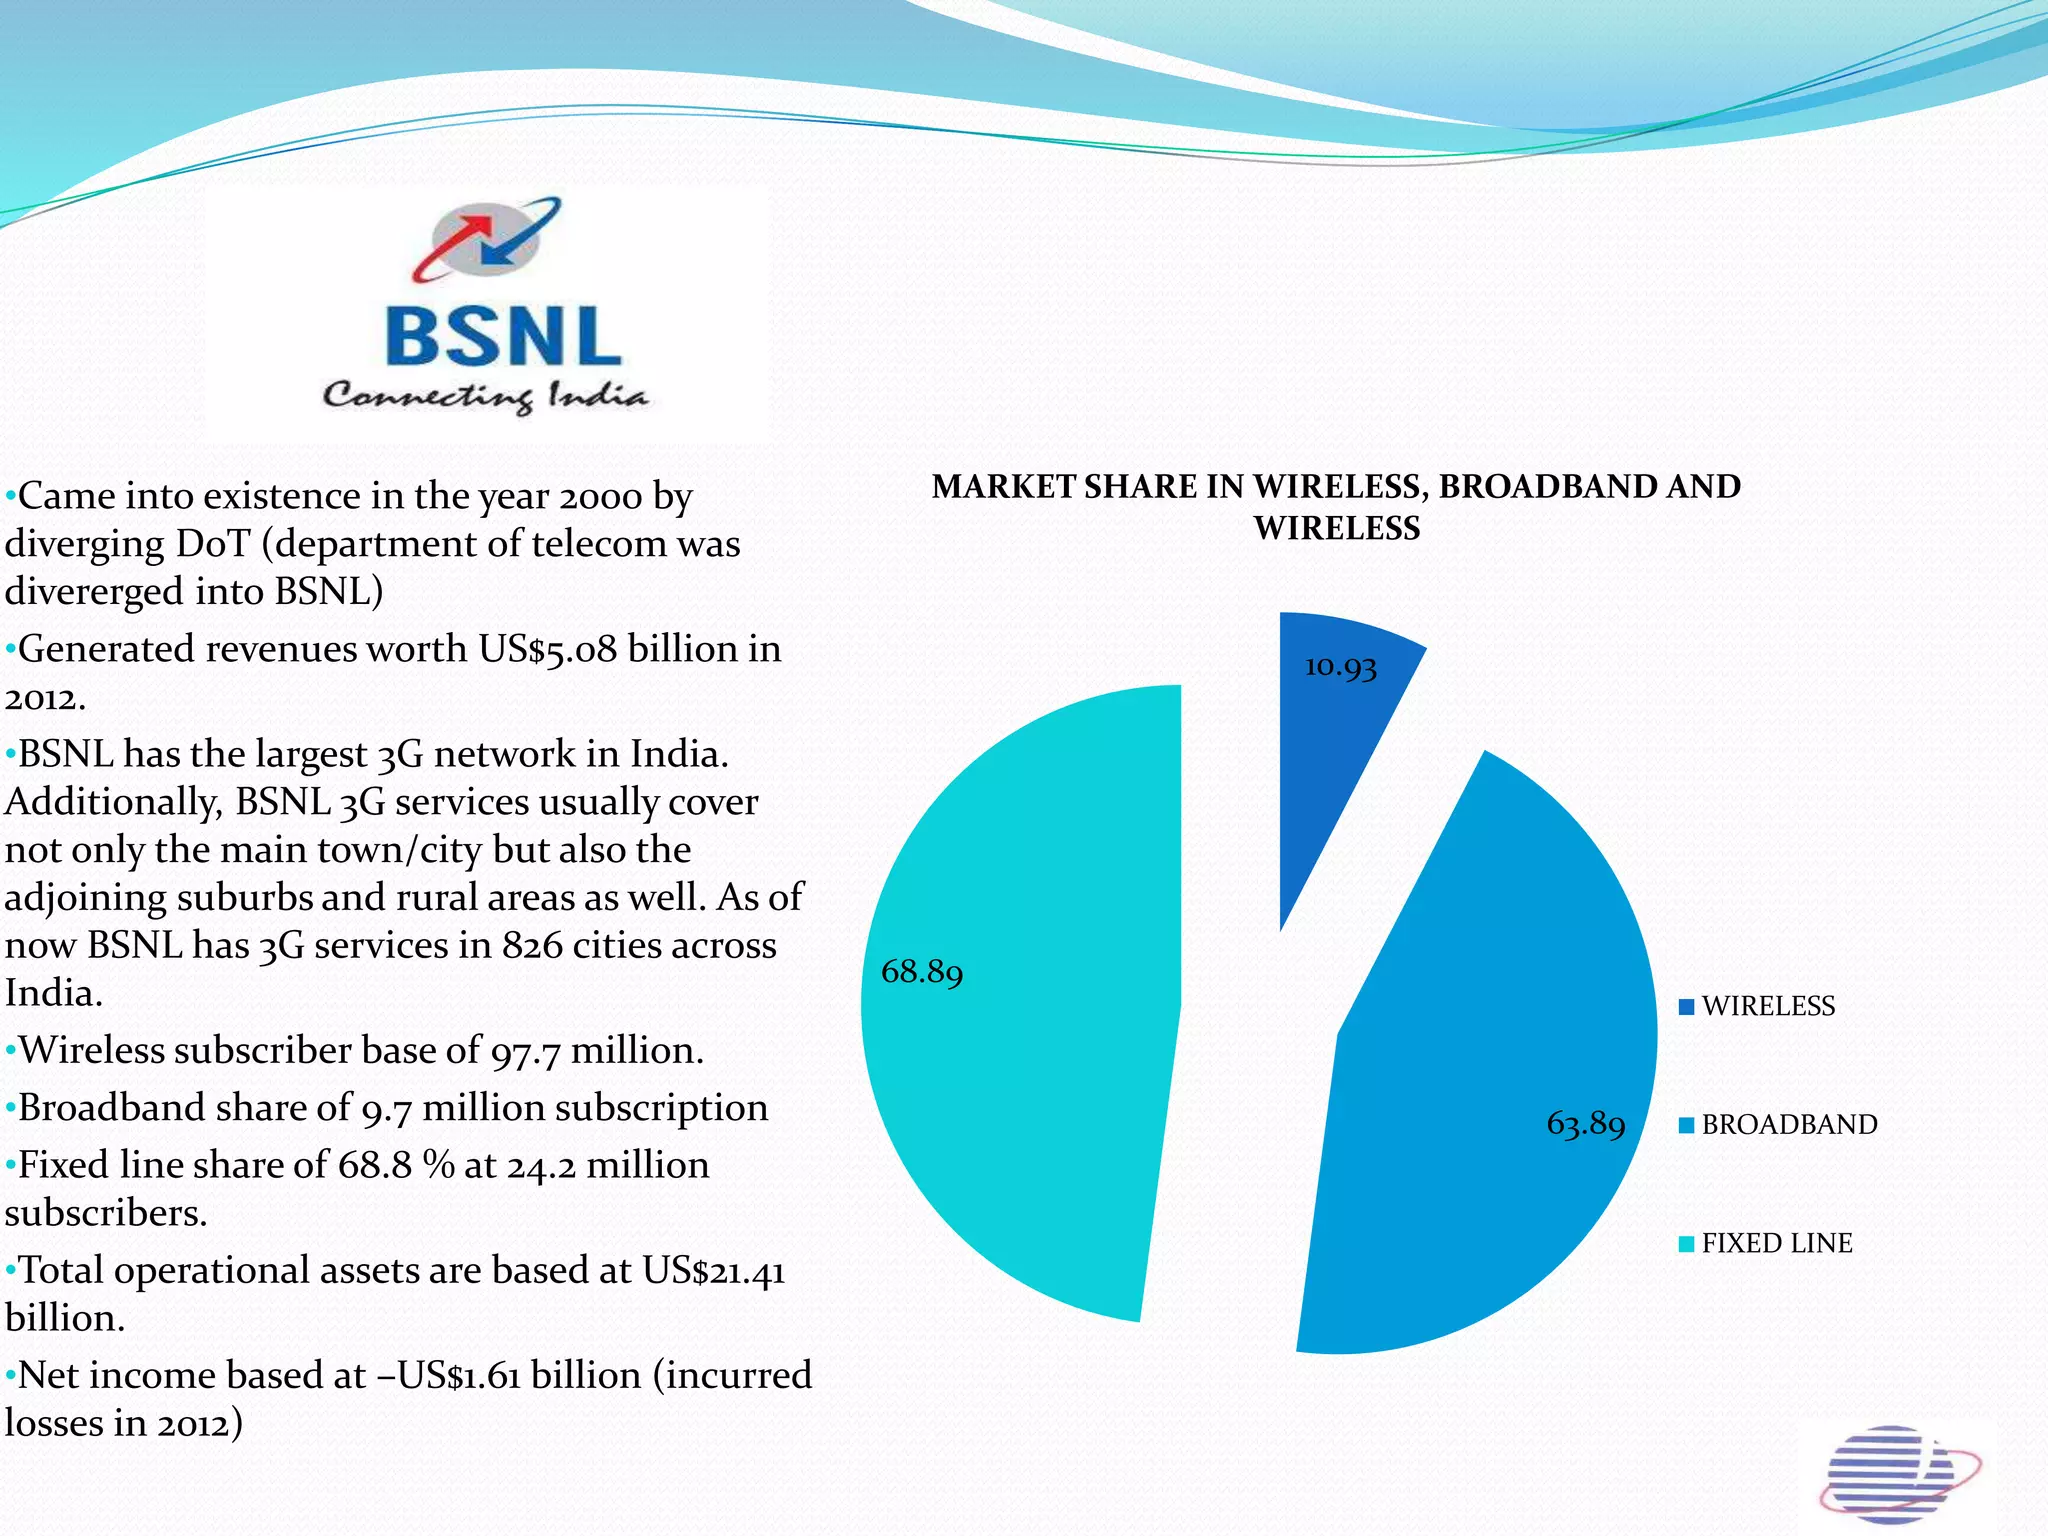
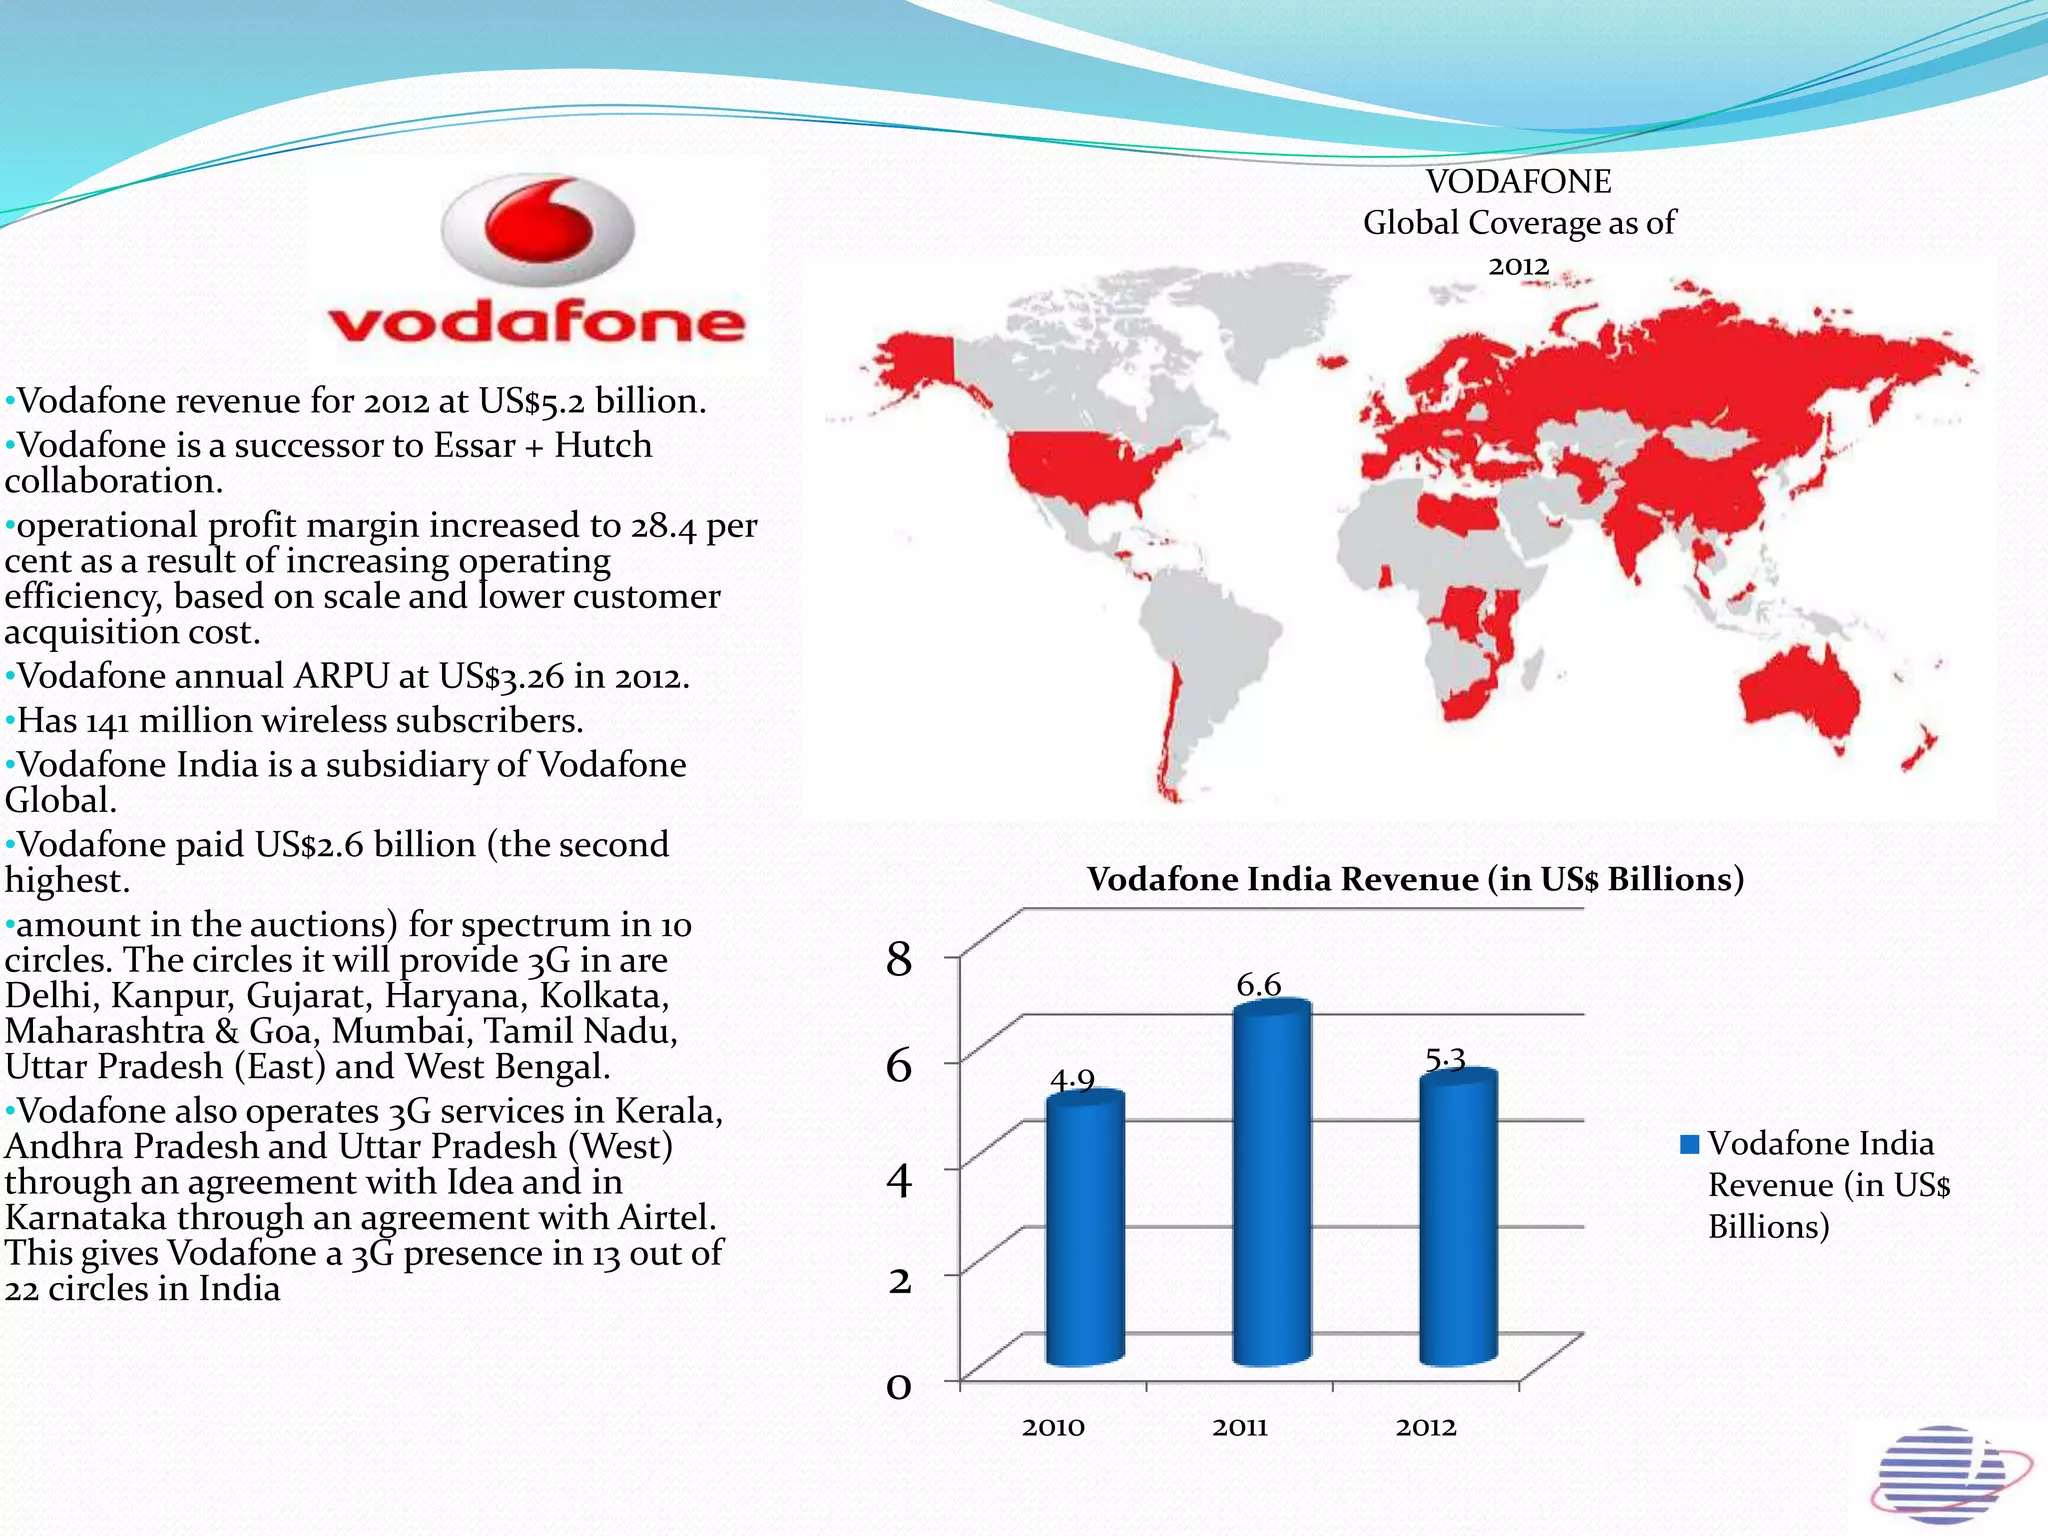
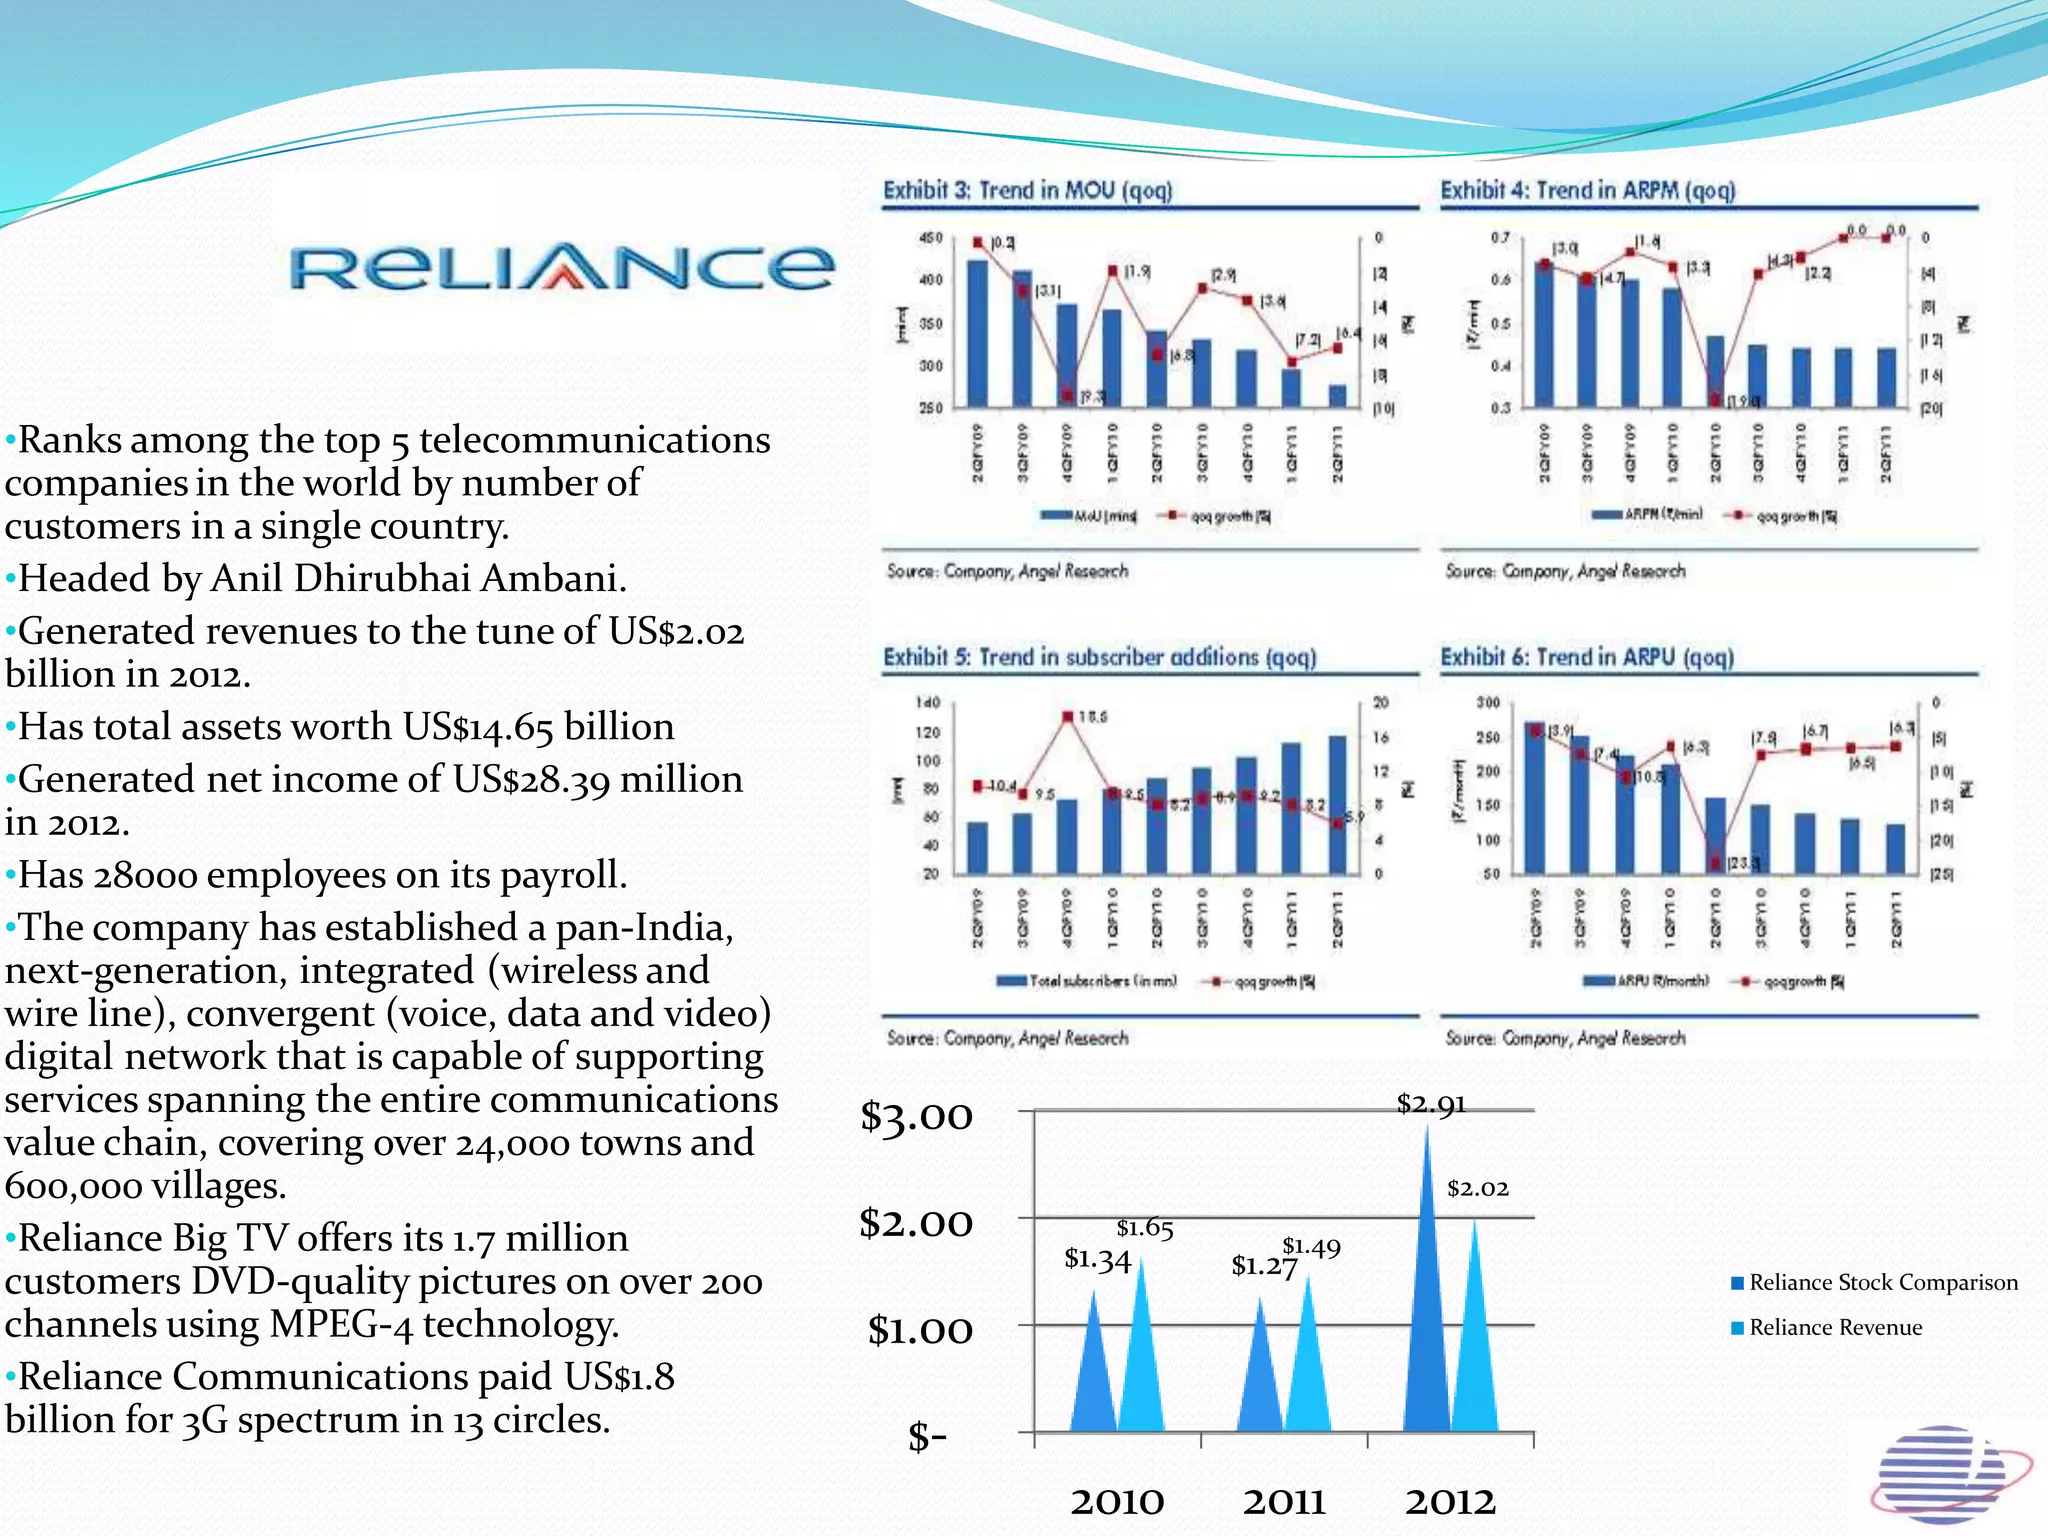


This document provides an overview of the annual expansion of India's telecom sector. It discusses key metrics such as subscriber growth, services offered, and government participation. The telecom industry in India has grown rapidly over 30 times from 2001 to over 960 million users in 2012. The government aims to increase rural connectivity and broadband access under the National Telecom Policy 2012. Major players include Bharati Airtel, Vodafone, Idea, Reliance, and BSNL, who continue to invest and compete for market share in the growing industry.


