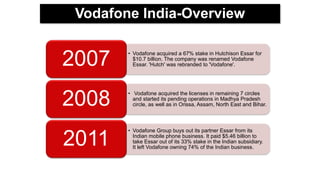
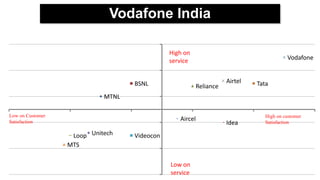
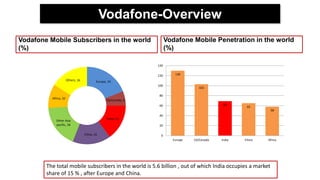
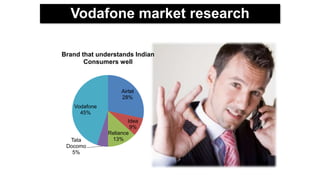
Presented By 
A.Wadut Al Mamun
Vodafone India-Overview 
• Vodafone acquired a 67% stake in Hutchison Essar for 
$10.7 billion. The company was renamed Vodafone 
Essar. 'Hutch' was rebranded to 'Vodafone'. 2007 
• Vodafone acquired the licenses in remaining 7 circles 
and started its pending operations in Madhya Pradesh 
circle, as well as in Orissa, Assam, North East and Bihar. 2008 
• Vodafone Group buys out its partner Essar from its 
Indian mobile phone business. It paid $5.46 billion to 
take Essar out of its 33% stake in the Indian subsidiary. 
It left Vodafone owning 74% of the Indian business. 2011
Indian Telecom Industry 
Circles Number in millions 
Metros 4 114 
A circles 5 288 
B circles 8 335.5 
C circles 6 115 
India's teledensity has improved from under 4% in March 2001 to around 76% by 
the end of March 2013. 
The mobile subscriber base (GSM and CDMA combined) has grown from under 2 m 
at the end of FY00 to touch 812 m at the end of March 2011 (average annual 
growth of nearly 73% during this eleven year period).
Indian Telecom Industry 
Reliance, 16.81% 
Vodafone, 16.56% 
Idea, 11.55% 
BSNL, 10.91% 
Tata, 9.97% 
Uninor, 3.67% 
Aircel, 6.84% 
Bharti, 19.70% 
Others, 3.90% 
The GSM ARPU(Average revenue per user) is Rs 100 (~ USD 2.2) per month. 
There is a wide disparity in the rural and urban teledensity with rural teledensity at 
34% vs. urban teledensity of around 157%.
Vodafone India 
MTNL 
BSNL Reliance 
Airtel 
Vodafone 
Tata 
Aircel 
Idea 
Loop Unitech Videocon 
MTS 
High on customer 
Satisfaction 
Low on Customer 
Satisfaction 
High on 
service 
Low on 
service
Vodafone-Overview 
Vodafone Mobile Subscribers in the world 
(%) 
Vodafone Mobile Penetration in the world 
(%) 
Europe, 19 
US/Canada, 6 
India, 15 
China, 16 
Africa, 10 
Others, 16 
Other Asia 
pacific, 18 
130 
103 
69 
65 
140 
120 
100 
80 
60 
40 
20 
The total mobile subscribers in the world is 5.6 billion , out of which India occupies a market 
share of 15 % , after Europe and China. 
58 
0 
Europe US/Canada India China Africa
Vodafone-Overview 
Vodafone Customers by Market(%) Vodafone Revenue by Market (%) 
India, 36 
Vodacom, 12 
Others, 17 
German 
y, 10 
Spain, 5 
UK, 5 
Italy, 6 
Egypt, 9 
Germany, 17 
Italy, 12 
Spain, 11 
Others, 29 
Vodacom, 12 
India, 8 UK, 11
Vodafone India-Overview 
Strengths 
 Strong brand name 
 Wide distribution network 
 Financially stable 
 Strong brand connect with the customer 
 Strong customer base 
Weaknesses 
 An international brand name may mean 
that Indians may view it as a foreign 
brand 
 Low margins to distributors and retailers 
 Servicing of client needs. 
Opportunities 
 Untapped rural market 
 Introduction of newer technologies 
 Value added services market 
 Business markets 
Threats 
 A number of competitors entering the 
telecom space 
 Mobile number portability 
 Fear of consolidation in the industry
Market share 
Favorite Telecom Brand 
Airtel 
28% 
Vodafone 
59% 
Reliance 
5% Idea 
8%
How people choose Vodafone 
Purchase Decision Influencers 
Advertise 
ments 
41% 
Family 
4% 
Friends 
52% 
Colleagu 
es 
2% 
Dealers 
1%
Vodafone market research 
Brand that understands Indian 
Consumers well 
Airtel 
28% 
Idea 
9% 
Reliance 
Vodafone 
Tata 13% 
Docomo 
5% 
45%
Factors to choose 
Brand 
Image 
5% 
Customer 
Care 
services 
3% 
Factors important while choosing a 
Availability 
2% 
mobile service provider. 
Network 
36% 
Offers 
7% 
Value 
added 
services 
22% 
Call rates 
25%
Basic needs of customers 
Factors important while using mobile. 
Incoming 
and 
outgoing 
calls 
50% 
SMS packs 
19% 
Internet 
31%
Thank You

Vodafone Brand Positioning

  • 1.
  • 2.
    Vodafone India-Overview •Vodafone acquired a 67% stake in Hutchison Essar for $10.7 billion. The company was renamed Vodafone Essar. 'Hutch' was rebranded to 'Vodafone'. 2007 • Vodafone acquired the licenses in remaining 7 circles and started its pending operations in Madhya Pradesh circle, as well as in Orissa, Assam, North East and Bihar. 2008 • Vodafone Group buys out its partner Essar from its Indian mobile phone business. It paid $5.46 billion to take Essar out of its 33% stake in the Indian subsidiary. It left Vodafone owning 74% of the Indian business. 2011
  • 3.
    Indian Telecom Industry Circles Number in millions Metros 4 114 A circles 5 288 B circles 8 335.5 C circles 6 115 India's teledensity has improved from under 4% in March 2001 to around 76% by the end of March 2013. The mobile subscriber base (GSM and CDMA combined) has grown from under 2 m at the end of FY00 to touch 812 m at the end of March 2011 (average annual growth of nearly 73% during this eleven year period).
  • 4.
    Indian Telecom Industry Reliance, 16.81% Vodafone, 16.56% Idea, 11.55% BSNL, 10.91% Tata, 9.97% Uninor, 3.67% Aircel, 6.84% Bharti, 19.70% Others, 3.90% The GSM ARPU(Average revenue per user) is Rs 100 (~ USD 2.2) per month. There is a wide disparity in the rural and urban teledensity with rural teledensity at 34% vs. urban teledensity of around 157%.
  • 5.
    Vodafone India MTNL BSNL Reliance Airtel Vodafone Tata Aircel Idea Loop Unitech Videocon MTS High on customer Satisfaction Low on Customer Satisfaction High on service Low on service
  • 6.
    Vodafone-Overview Vodafone MobileSubscribers in the world (%) Vodafone Mobile Penetration in the world (%) Europe, 19 US/Canada, 6 India, 15 China, 16 Africa, 10 Others, 16 Other Asia pacific, 18 130 103 69 65 140 120 100 80 60 40 20 The total mobile subscribers in the world is 5.6 billion , out of which India occupies a market share of 15 % , after Europe and China. 58 0 Europe US/Canada India China Africa
  • 7.
    Vodafone-Overview Vodafone Customersby Market(%) Vodafone Revenue by Market (%) India, 36 Vodacom, 12 Others, 17 German y, 10 Spain, 5 UK, 5 Italy, 6 Egypt, 9 Germany, 17 Italy, 12 Spain, 11 Others, 29 Vodacom, 12 India, 8 UK, 11
  • 8.
    Vodafone India-Overview Strengths  Strong brand name  Wide distribution network  Financially stable  Strong brand connect with the customer  Strong customer base Weaknesses  An international brand name may mean that Indians may view it as a foreign brand  Low margins to distributors and retailers  Servicing of client needs. Opportunities  Untapped rural market  Introduction of newer technologies  Value added services market  Business markets Threats  A number of competitors entering the telecom space  Mobile number portability  Fear of consolidation in the industry
  • 9.
    Market share FavoriteTelecom Brand Airtel 28% Vodafone 59% Reliance 5% Idea 8%
  • 10.
    How people chooseVodafone Purchase Decision Influencers Advertise ments 41% Family 4% Friends 52% Colleagu es 2% Dealers 1%
  • 11.
    Vodafone market research Brand that understands Indian Consumers well Airtel 28% Idea 9% Reliance Vodafone Tata 13% Docomo 5% 45%
  • 12.
    Factors to choose Brand Image 5% Customer Care services 3% Factors important while choosing a Availability 2% mobile service provider. Network 36% Offers 7% Value added services 22% Call rates 25%
  • 13.
    Basic needs ofcustomers Factors important while using mobile. Incoming and outgoing calls 50% SMS packs 19% Internet 31%
  • 14.