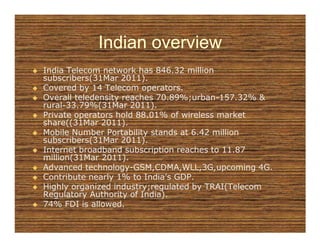
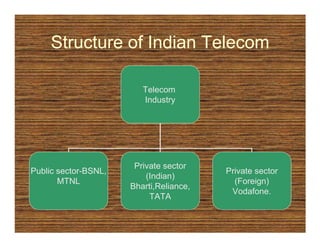
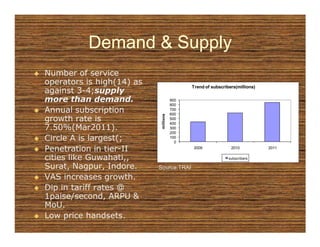
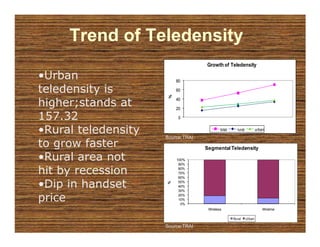
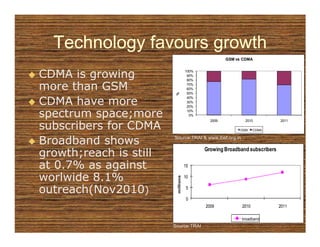
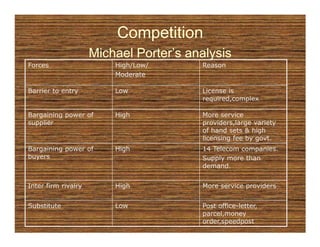
The Indian telecom industry has experienced rapid growth with over 846 million subscribers as of March 2011. It is dominated by private operators who hold 88% of the wireless market share. While demand continues to grow with increasing rural penetration, supply currently exceeds demand due to the large number of service providers. This high competition has led to decreasing revenue metrics like ARPU and MoU. The industry is expected to continue growing driven by technology advancements, lower tariffs, and the shift to value-added services. However, it faces challenges around heavy regulation and maintaining profitability.


![Market Share
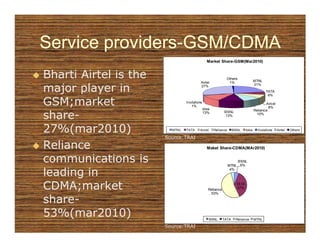
Service provider wise market share(Mar2011)
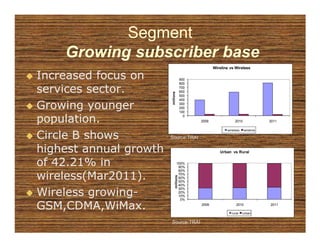
Wireless is larger than
WIRELESS
wireline.
TATA
Bharti Airtel vodafone
11%
Idea
11%
Aircel
dominates wireless 16%
Other
25%
7%
BSNL
11%
others]
market with 19%. reliance
17%
bharti
20%
7%
BSNL is with largest
market share in Source:TRAI
wireline(72%). Service provider wise market share(Mar2011)
WIRELINE
MTNL is present in
Delhi & Mumbai. MTNL
10%
Bharti
9%
Reliance
3%
BSNL
MTNL
BSNL covers the rest TATA
4%
others
Bharti
Reliance
part of country. BSNL
73% Other
5%
1%
TATA
others
source:TRAI](https://image.slidesharecdn.com/telecom-110514021839-phpapp01/85/Telecom-13-320.jpg)