Download as PDF, PPTX

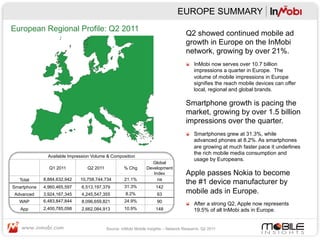
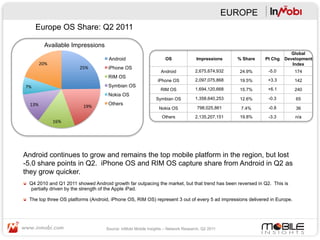
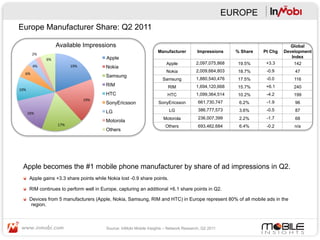
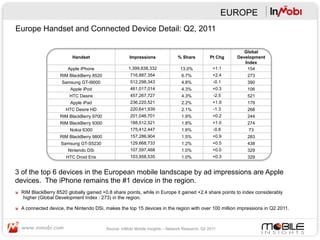
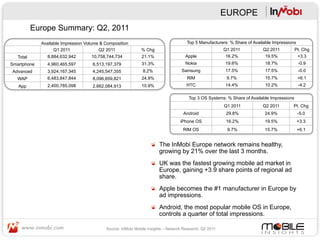


In this document, InMobi provides a summary of mobile advertising trends in Europe for Q2 2011 based on data from their global mobile advertising network: - Mobile ad impressions in Europe grew 21% in Q2 2011, with smartphones growing 31% and accounting for over 60% of total impressions. - Apple became the top device manufacturer in Europe, capturing 19.5% of ad impressions and growing faster than Android, which remained the top mobile platform but lost share. - The top 3 platforms (Android, iPhone OS, RIM OS) accounted for nearly 60% of ad impressions in Europe, indicating fragmentation is decreasing in the region.


![[Webinar] driving accountability in mobile advertising](https://cdn.slidesharecdn.com/ss_thumbnails/webinardrivingaccountabilityinmobileadvertising-170728022321-thumbnail.jpg?width=640&height=640&fit=bounds)


