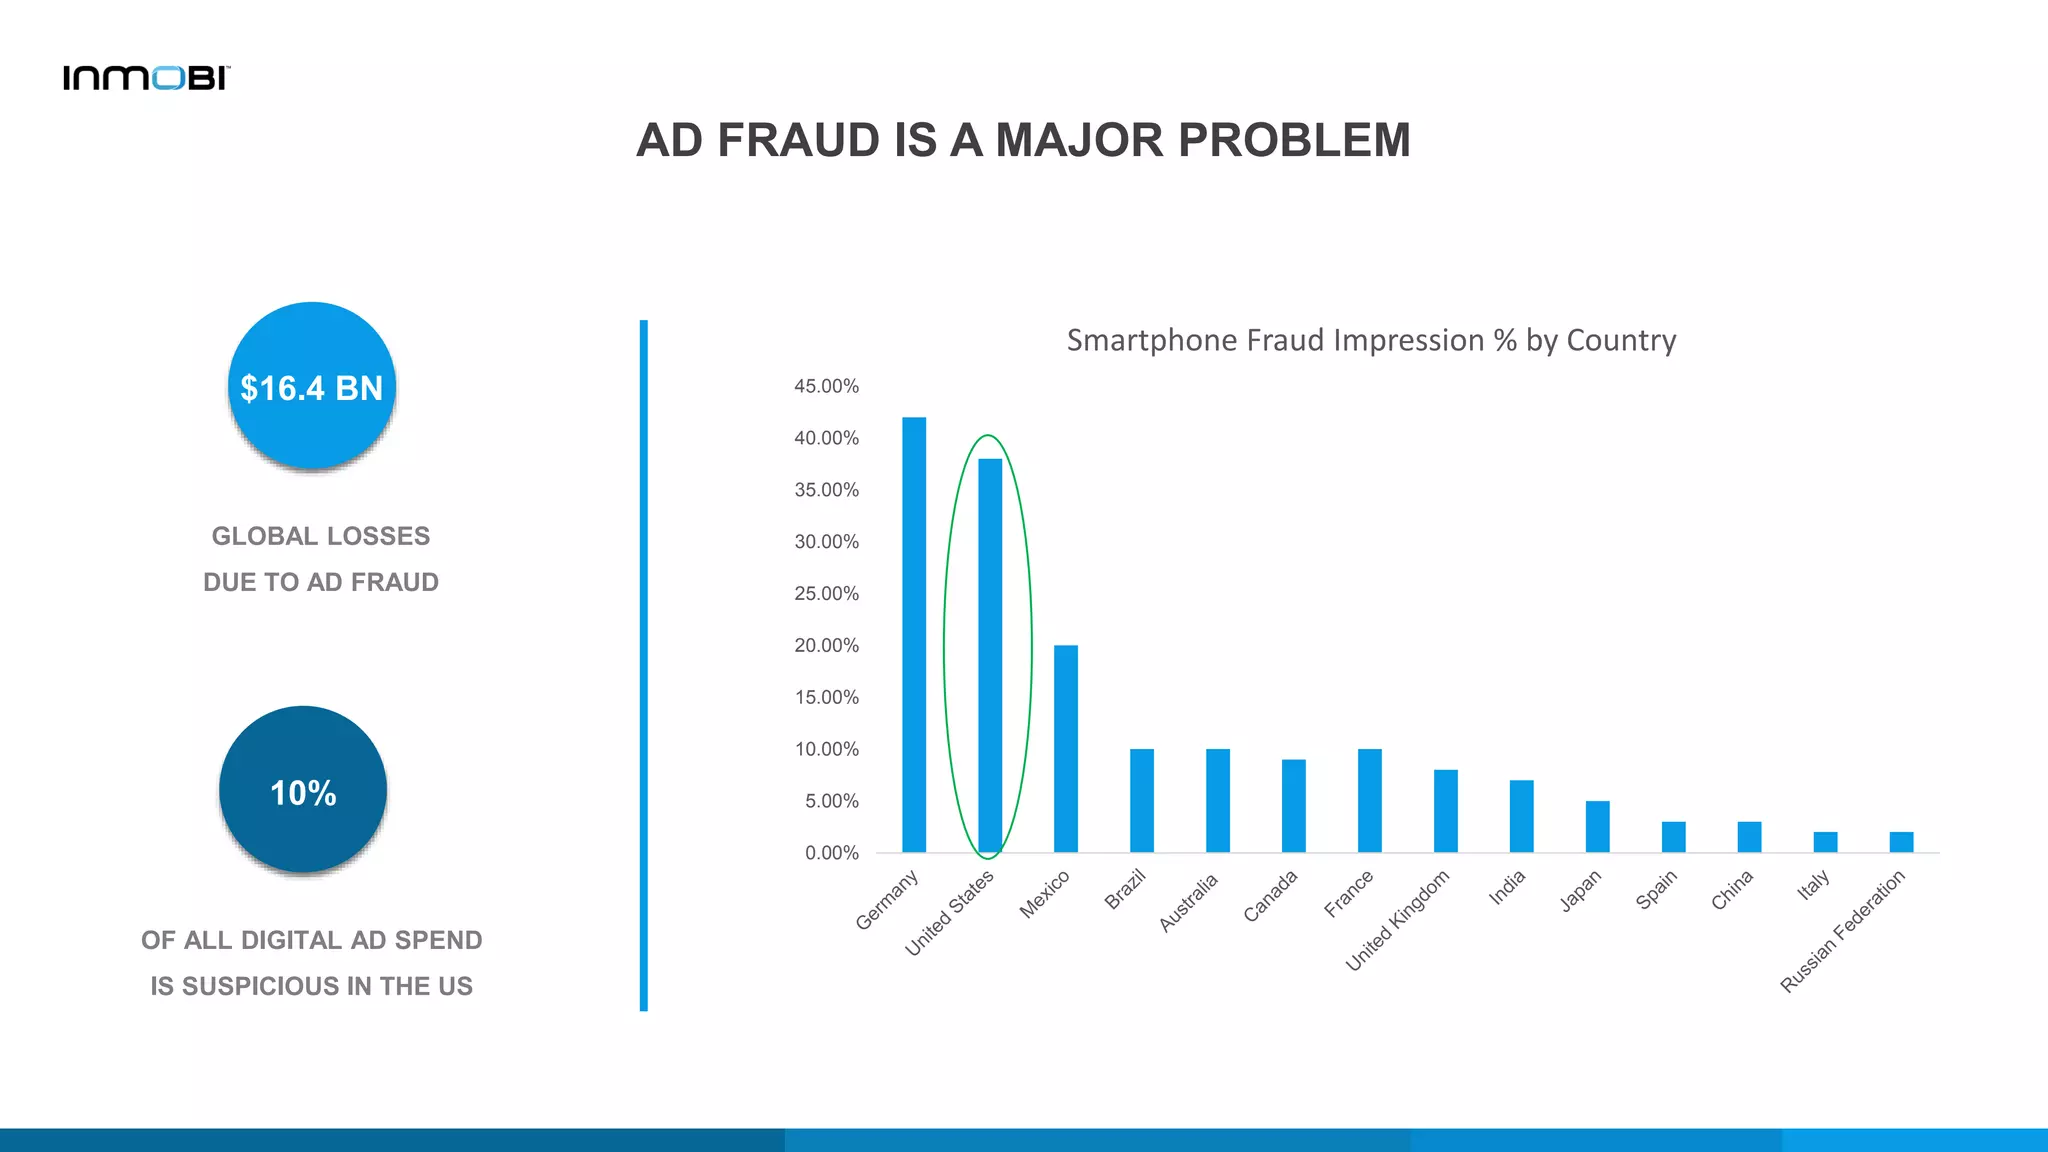
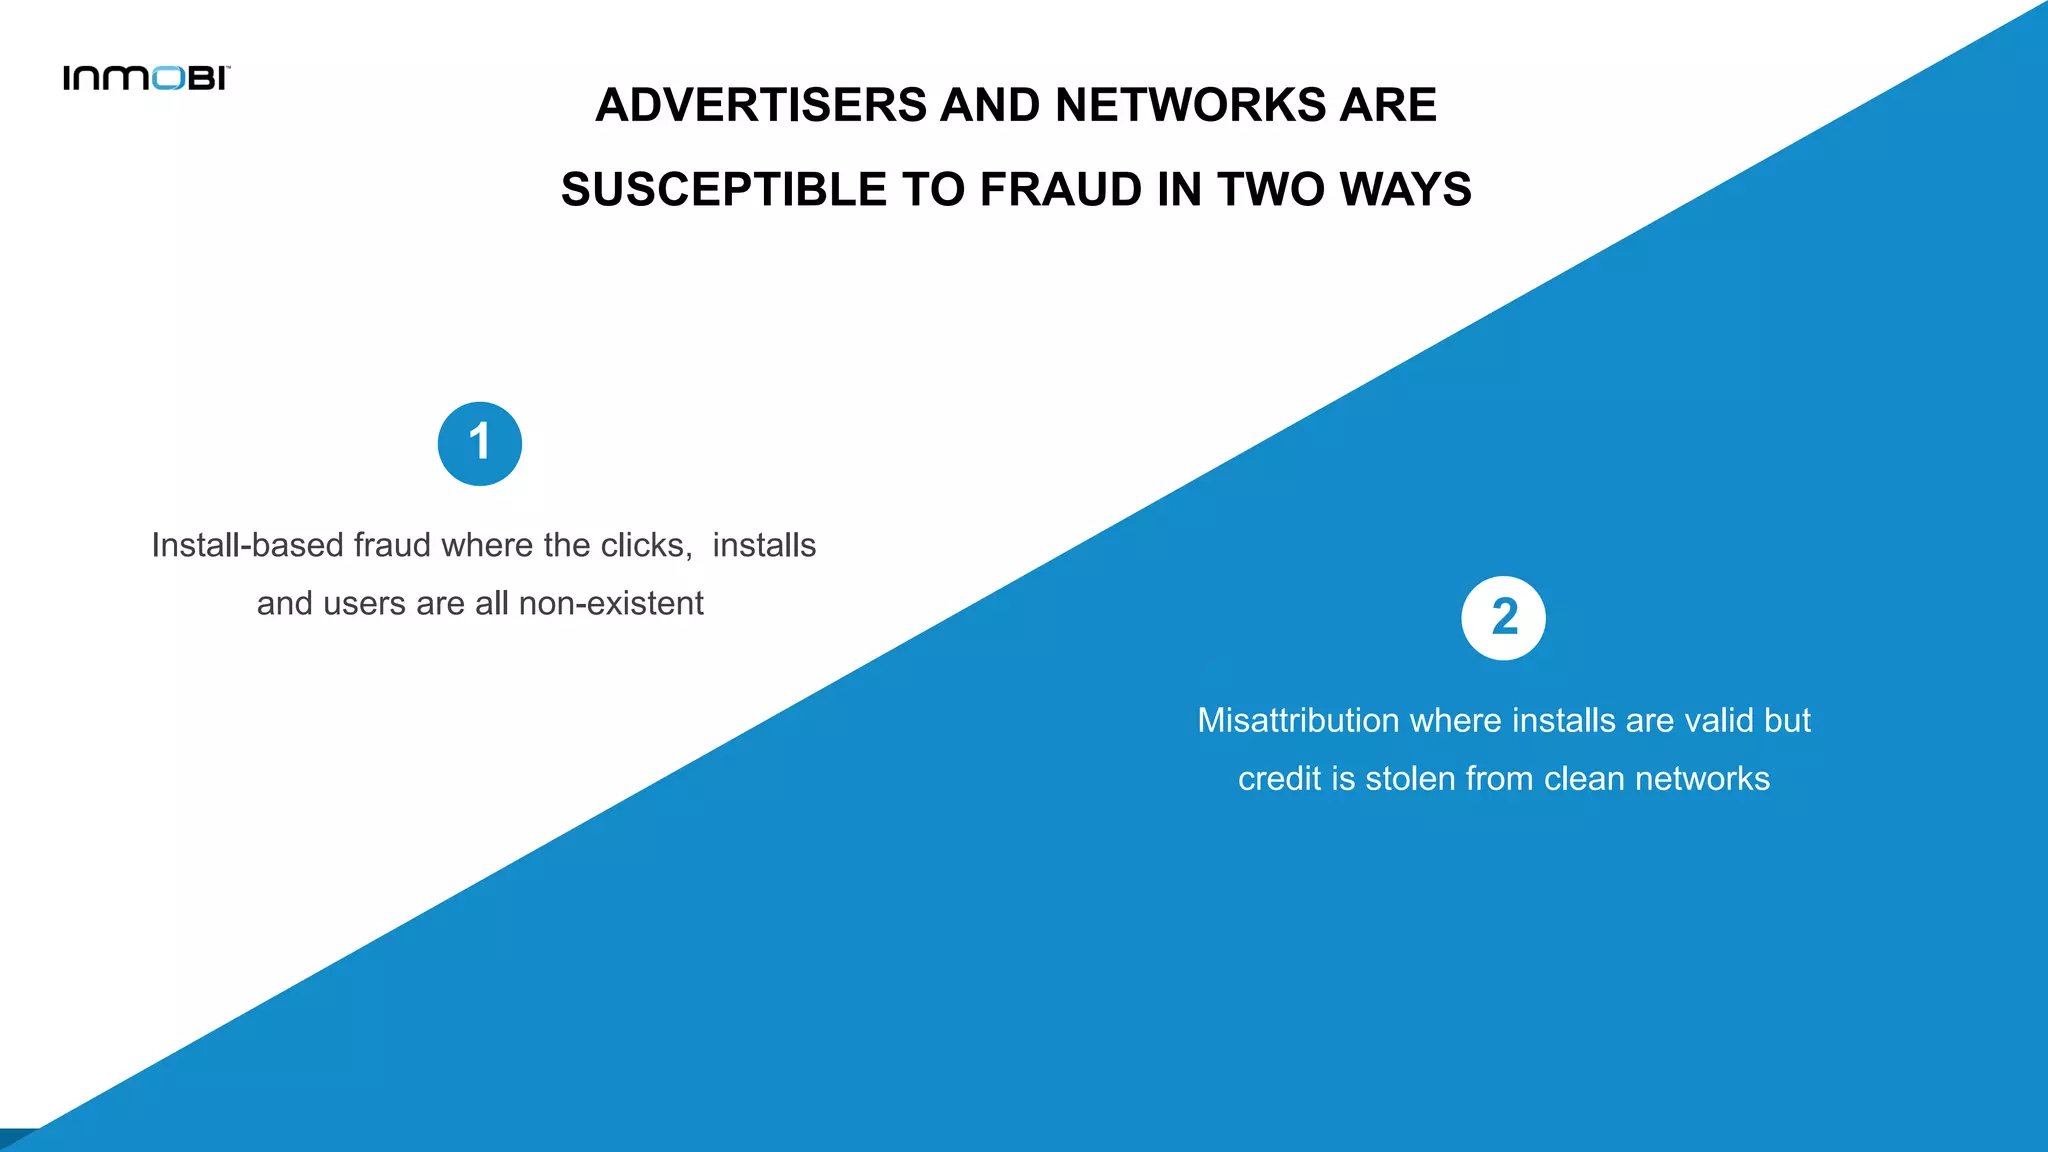
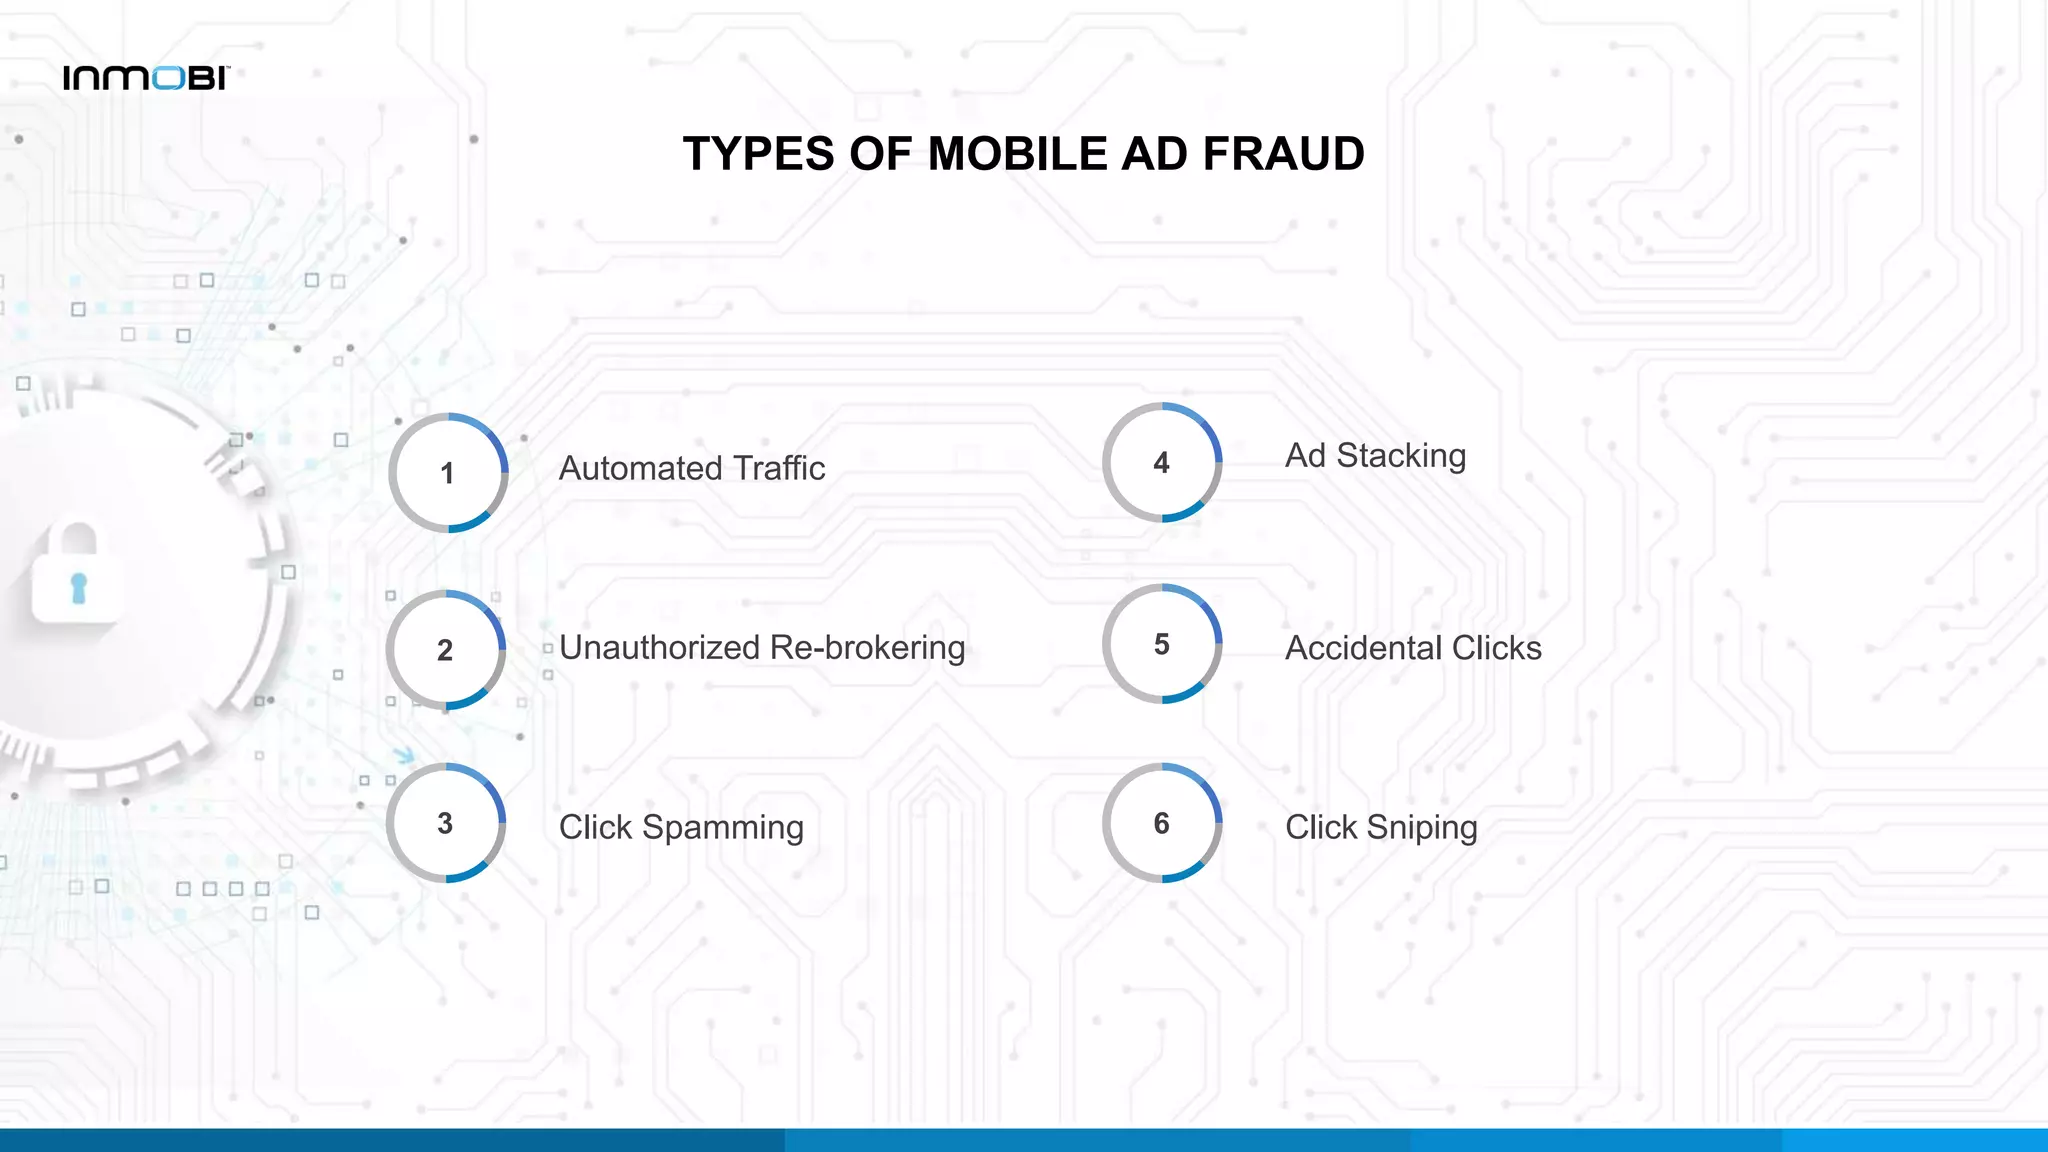
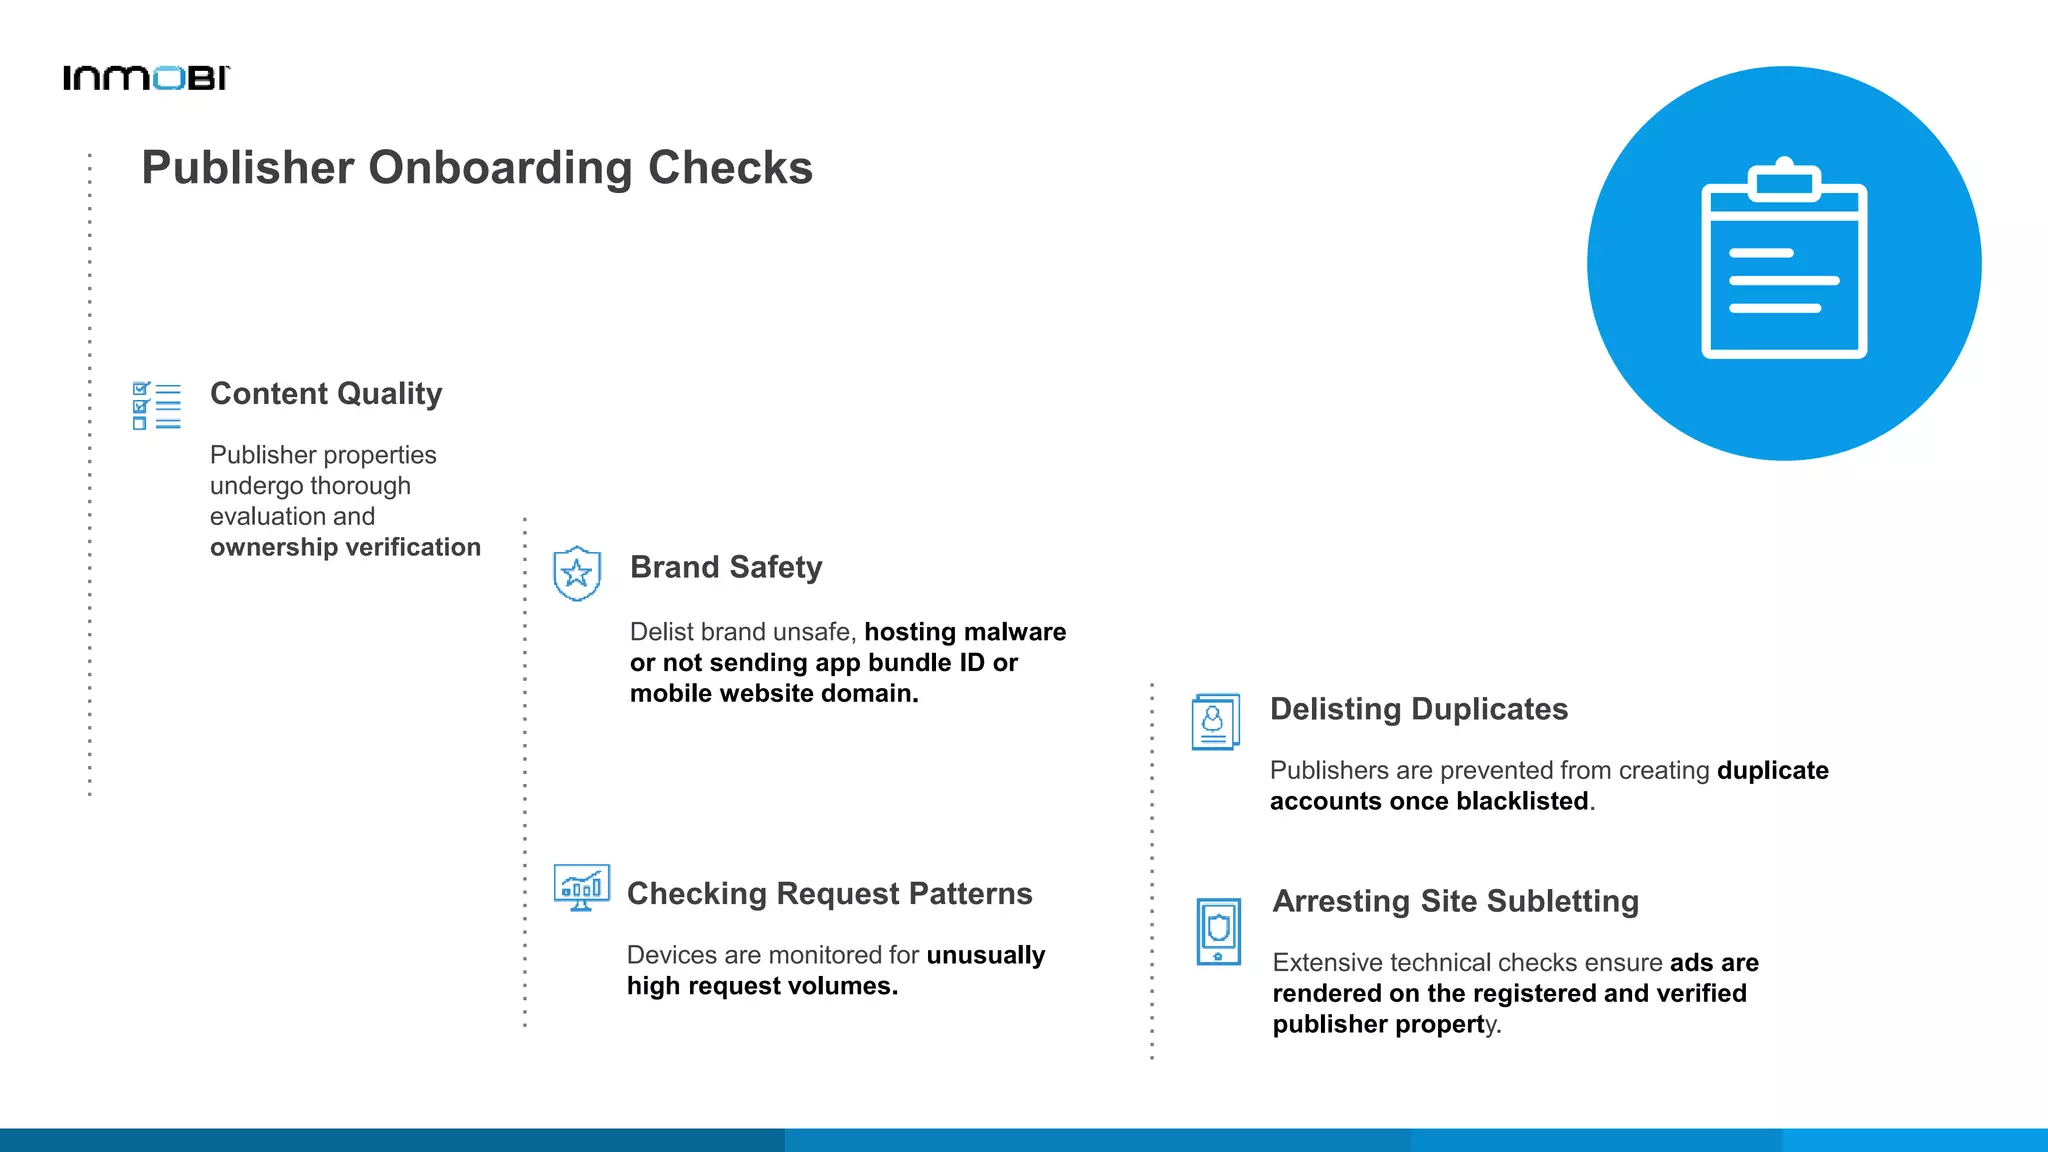
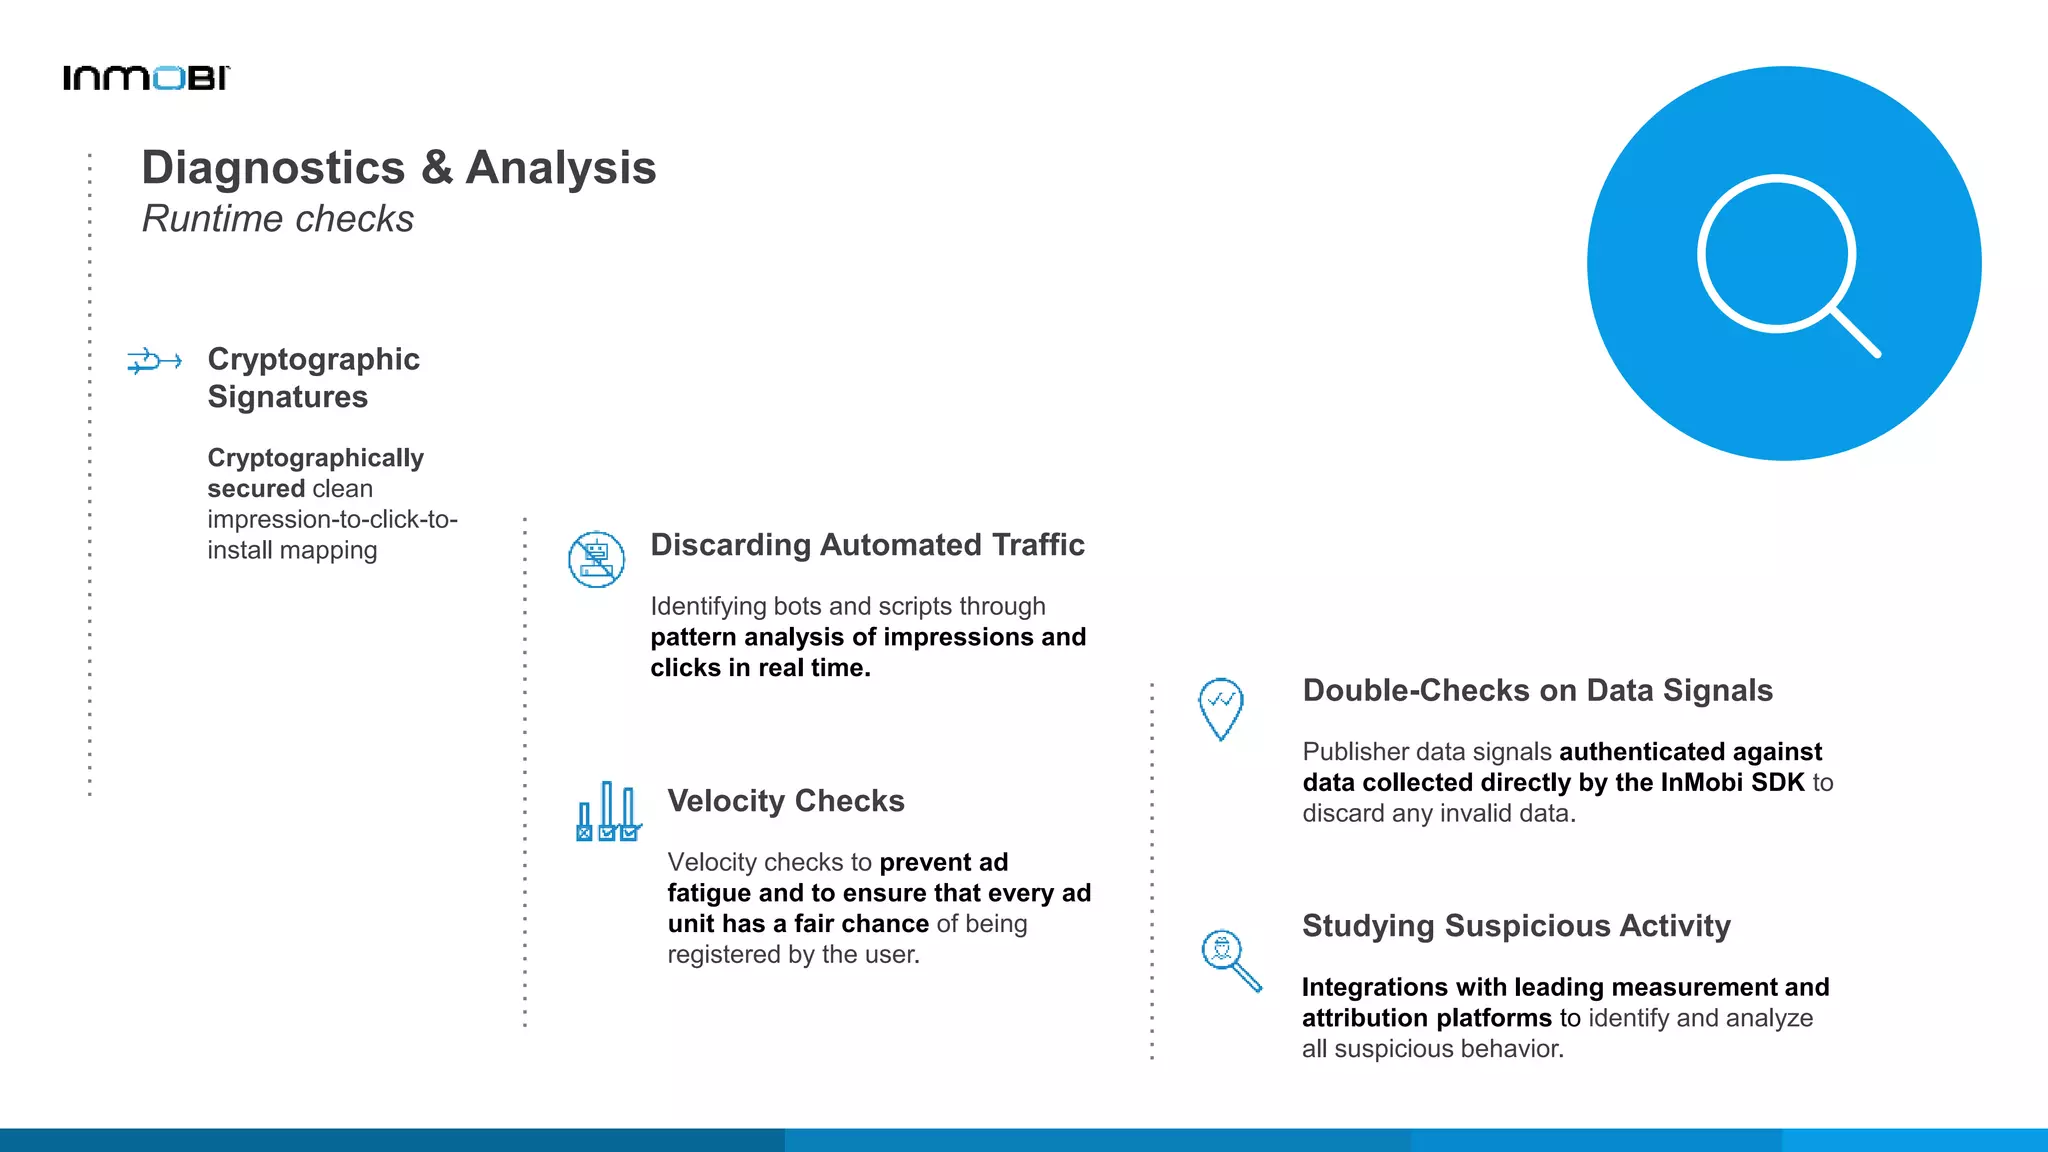
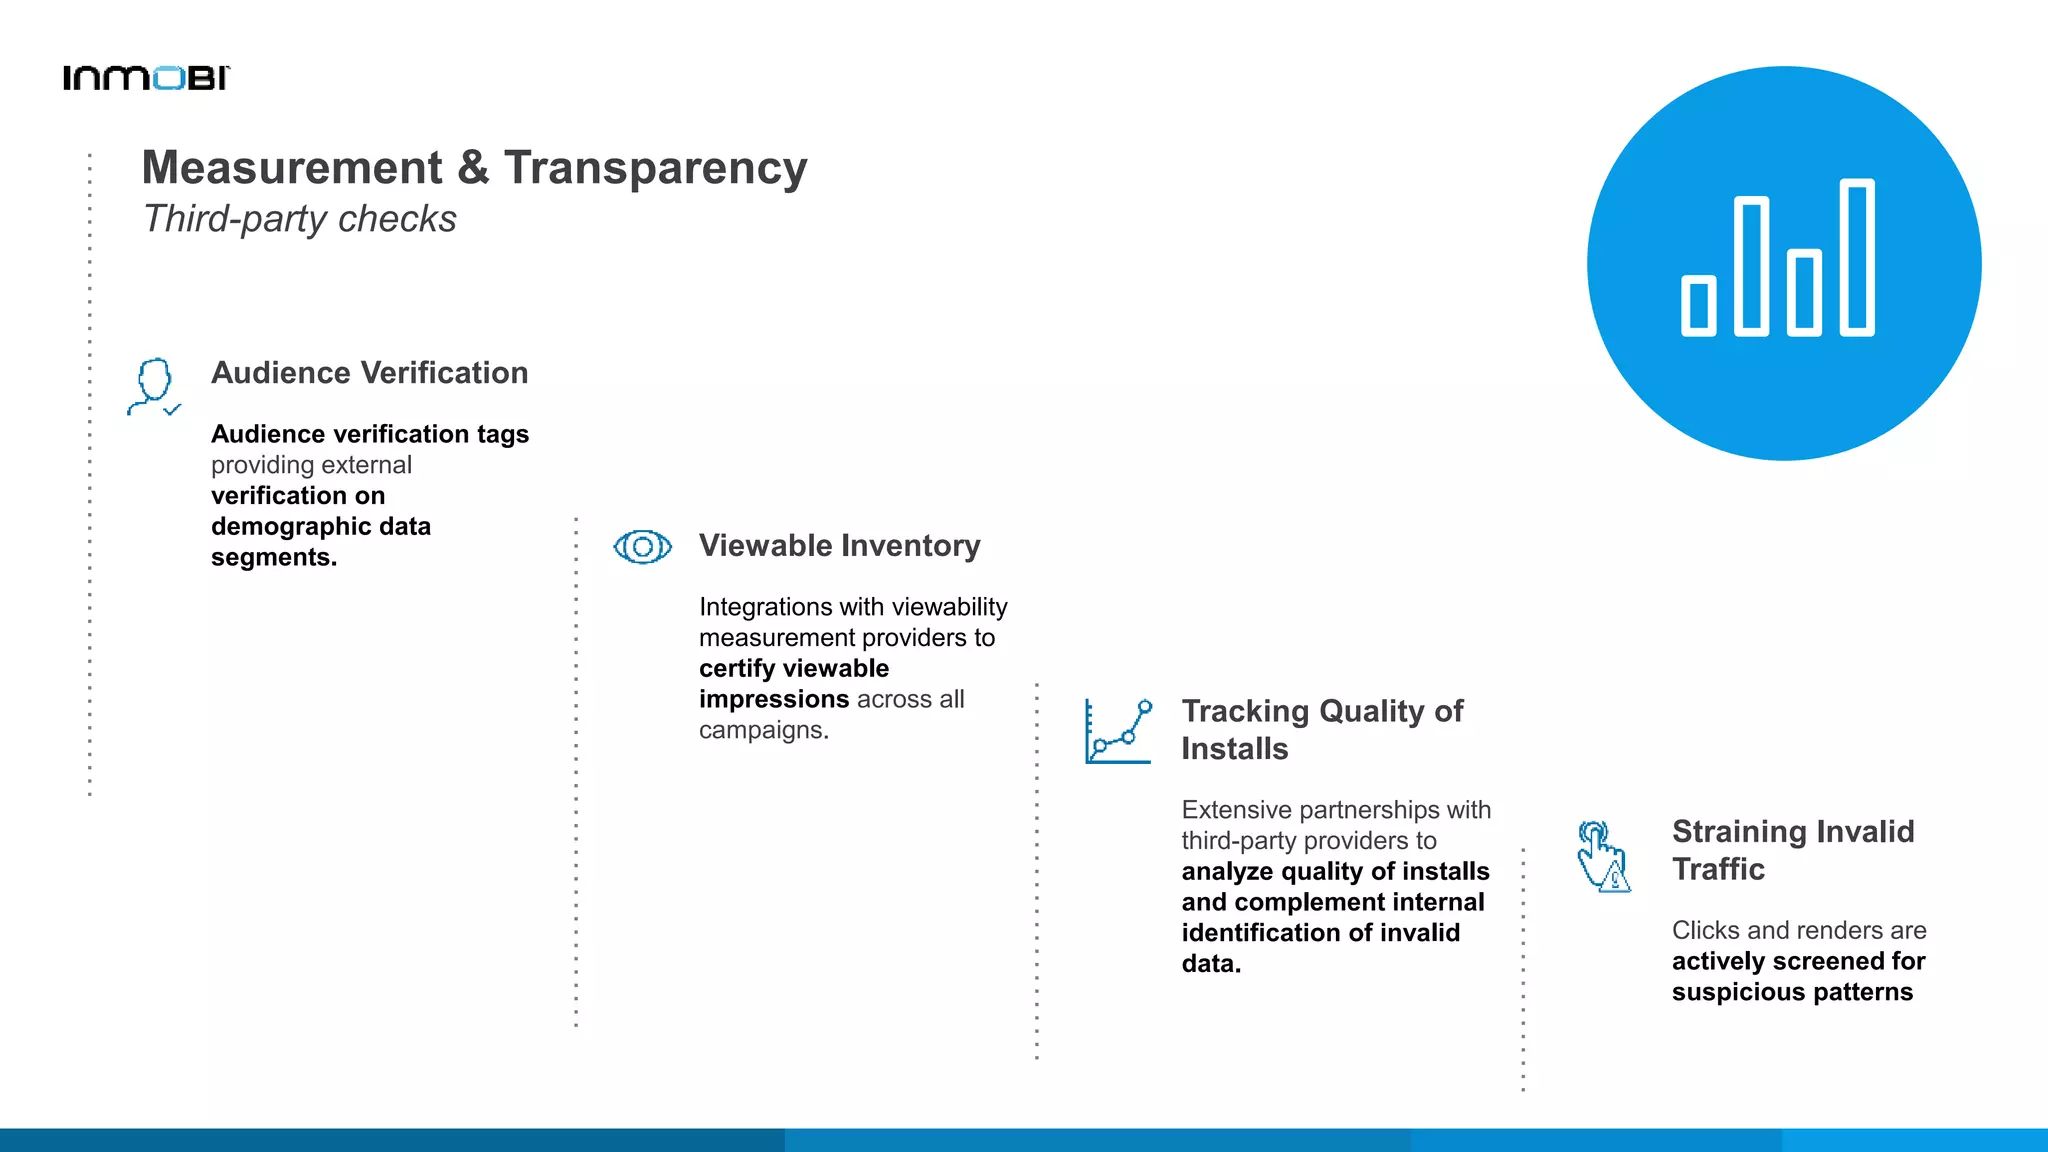
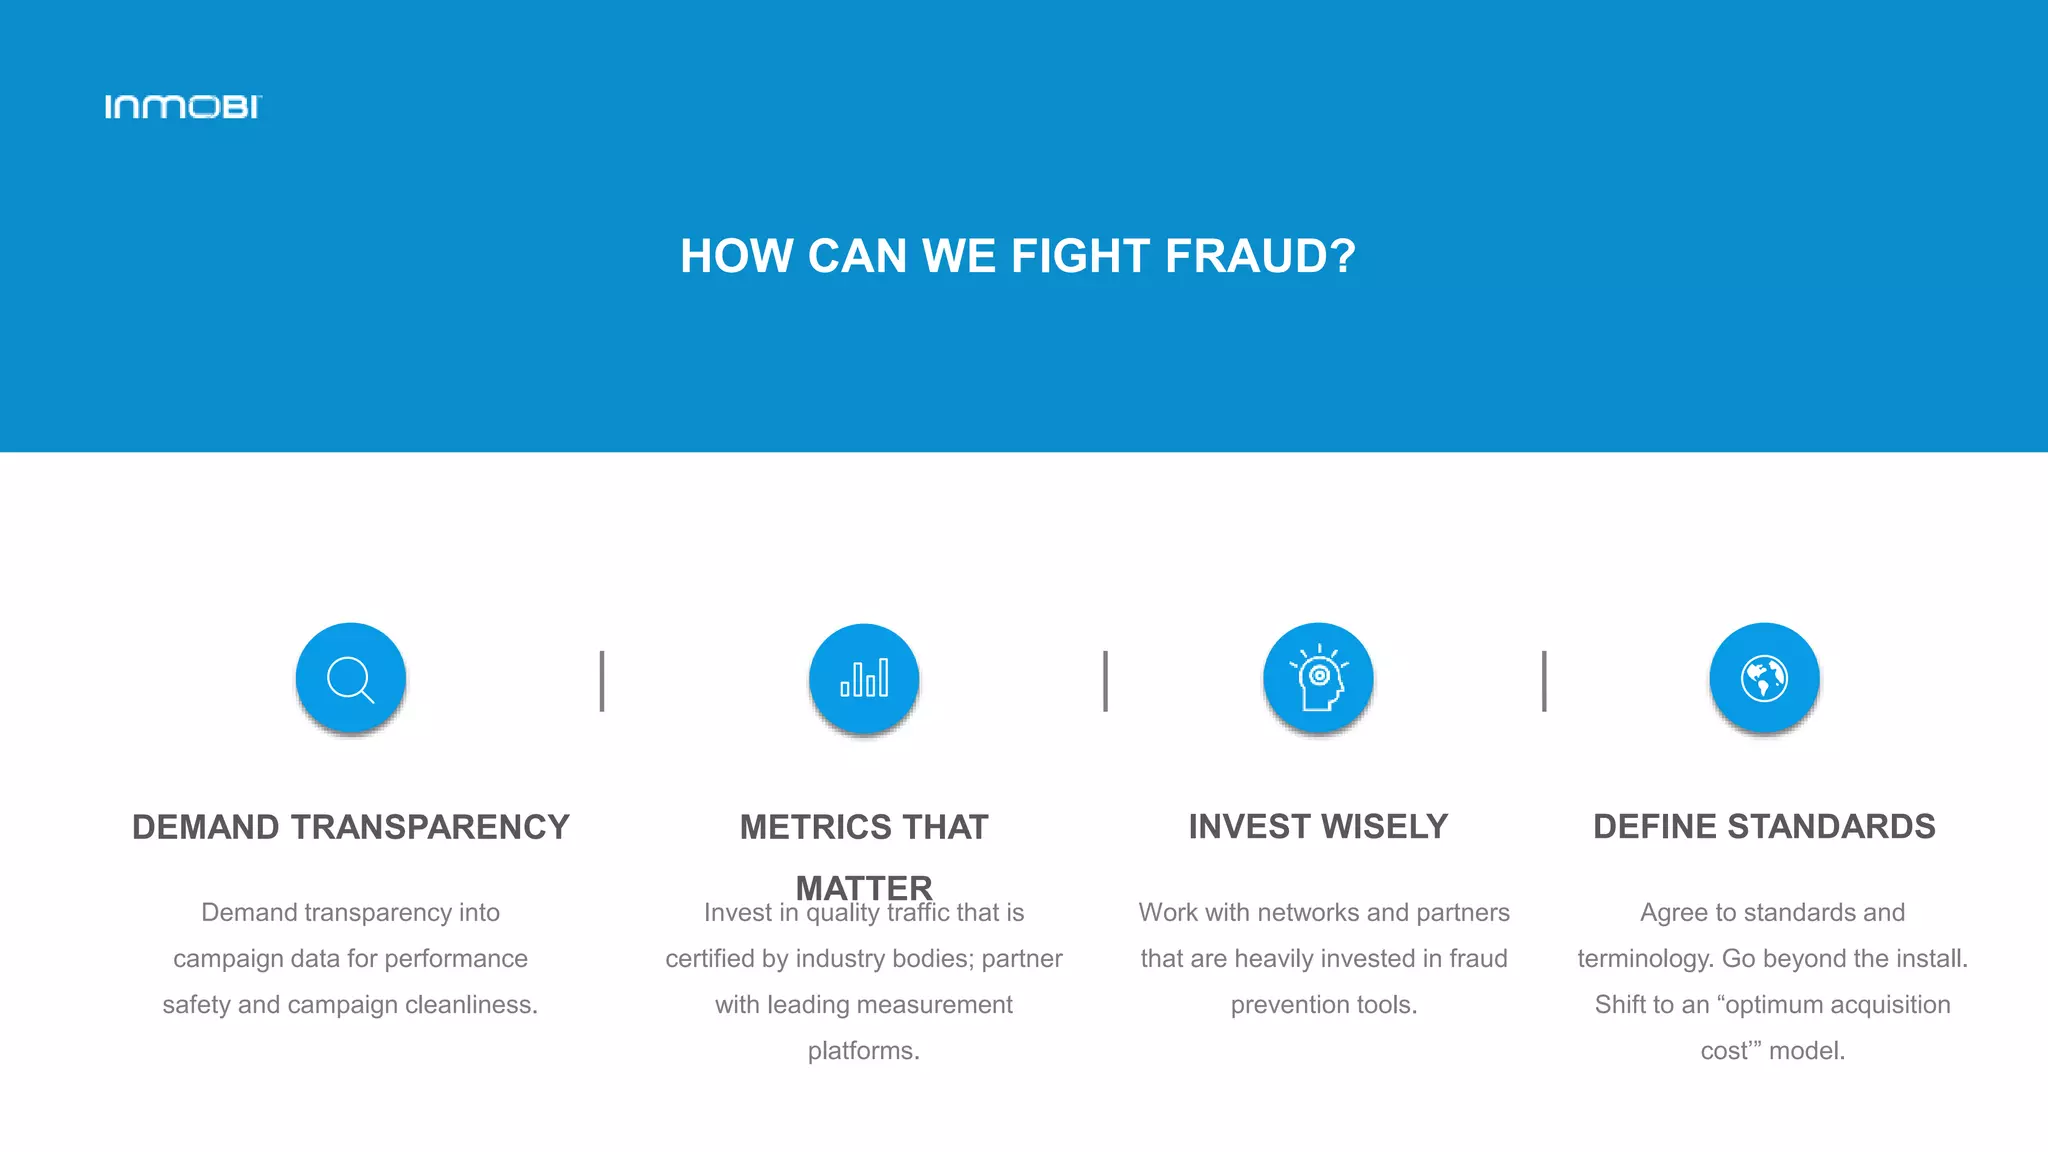
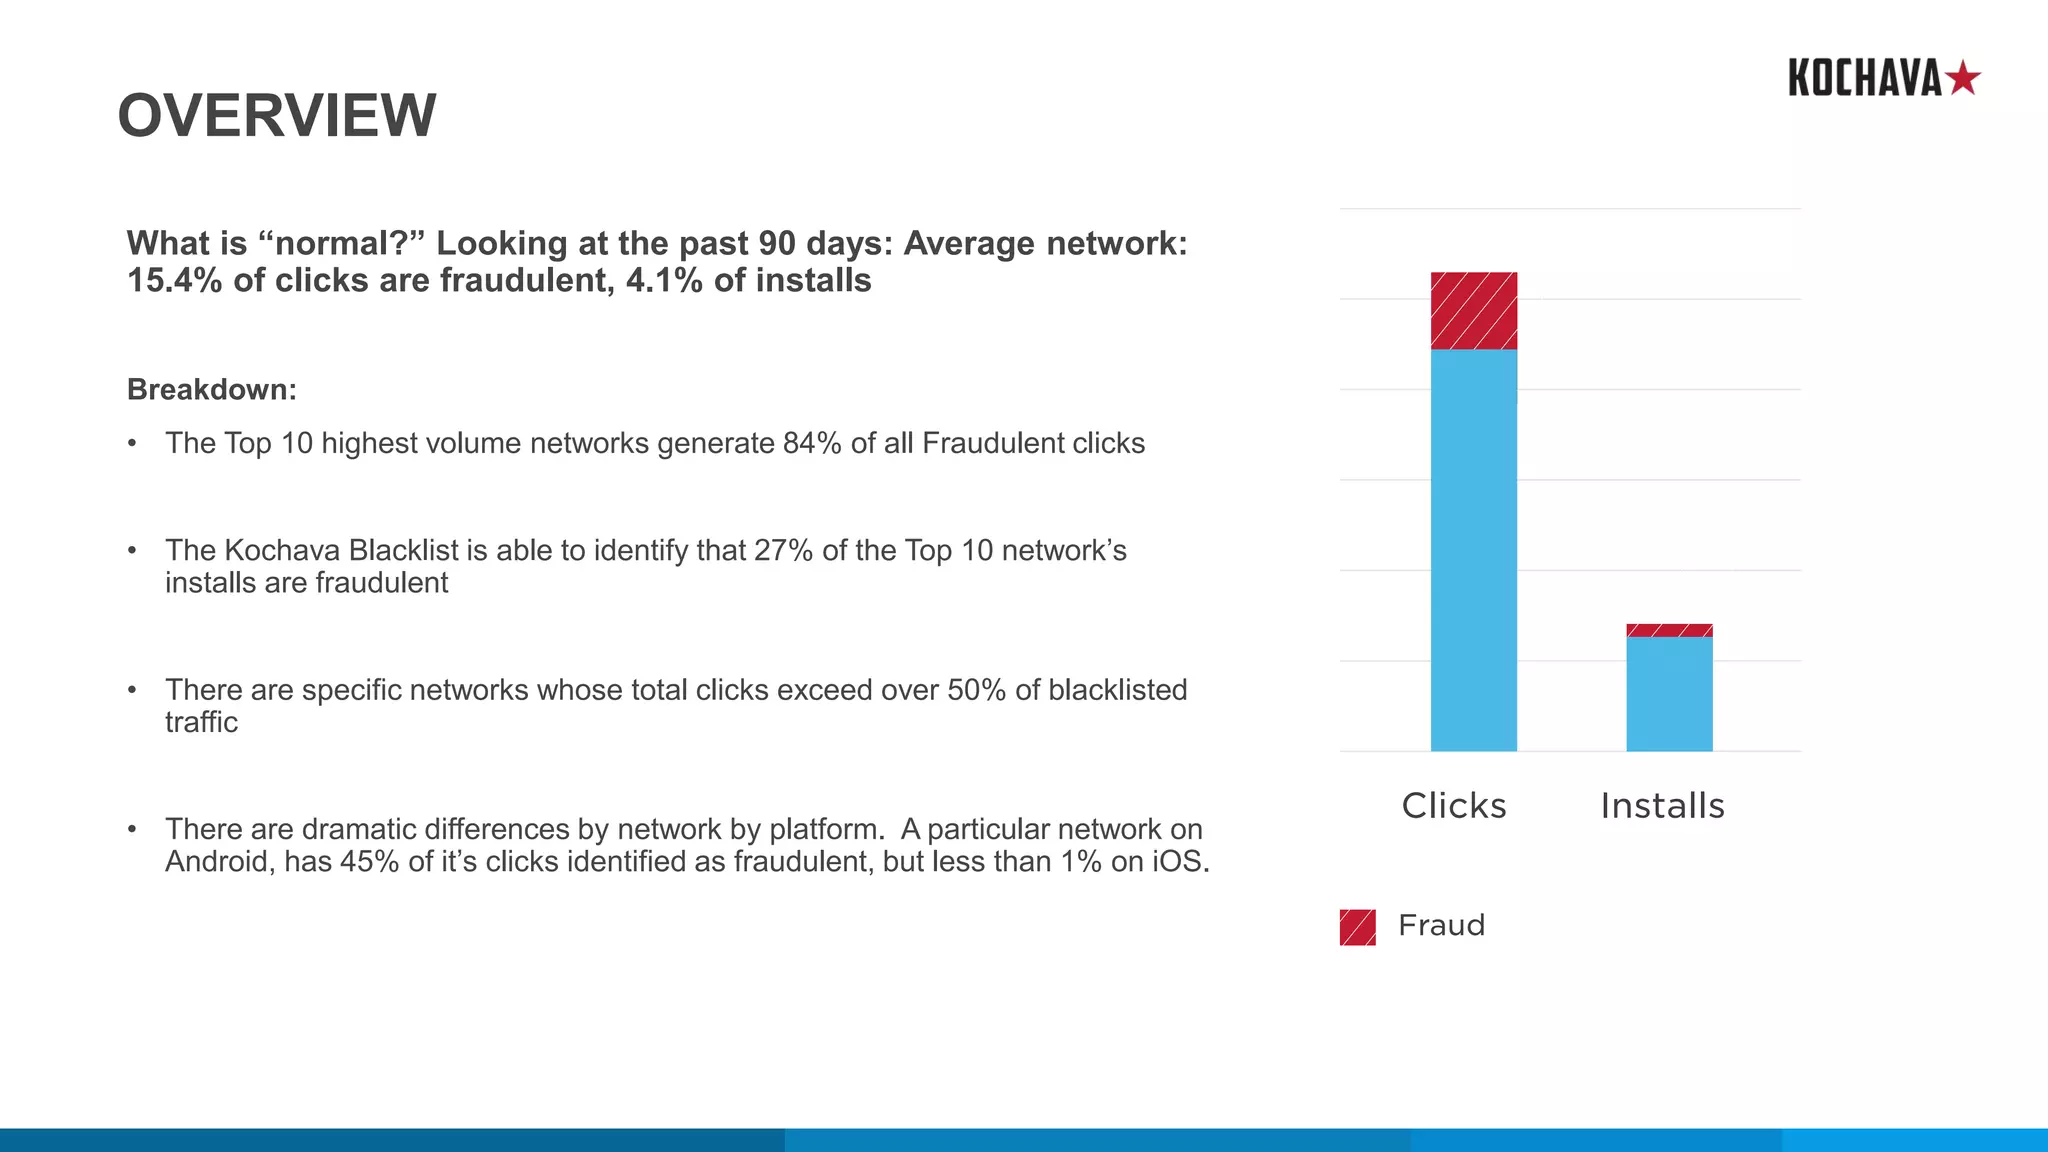
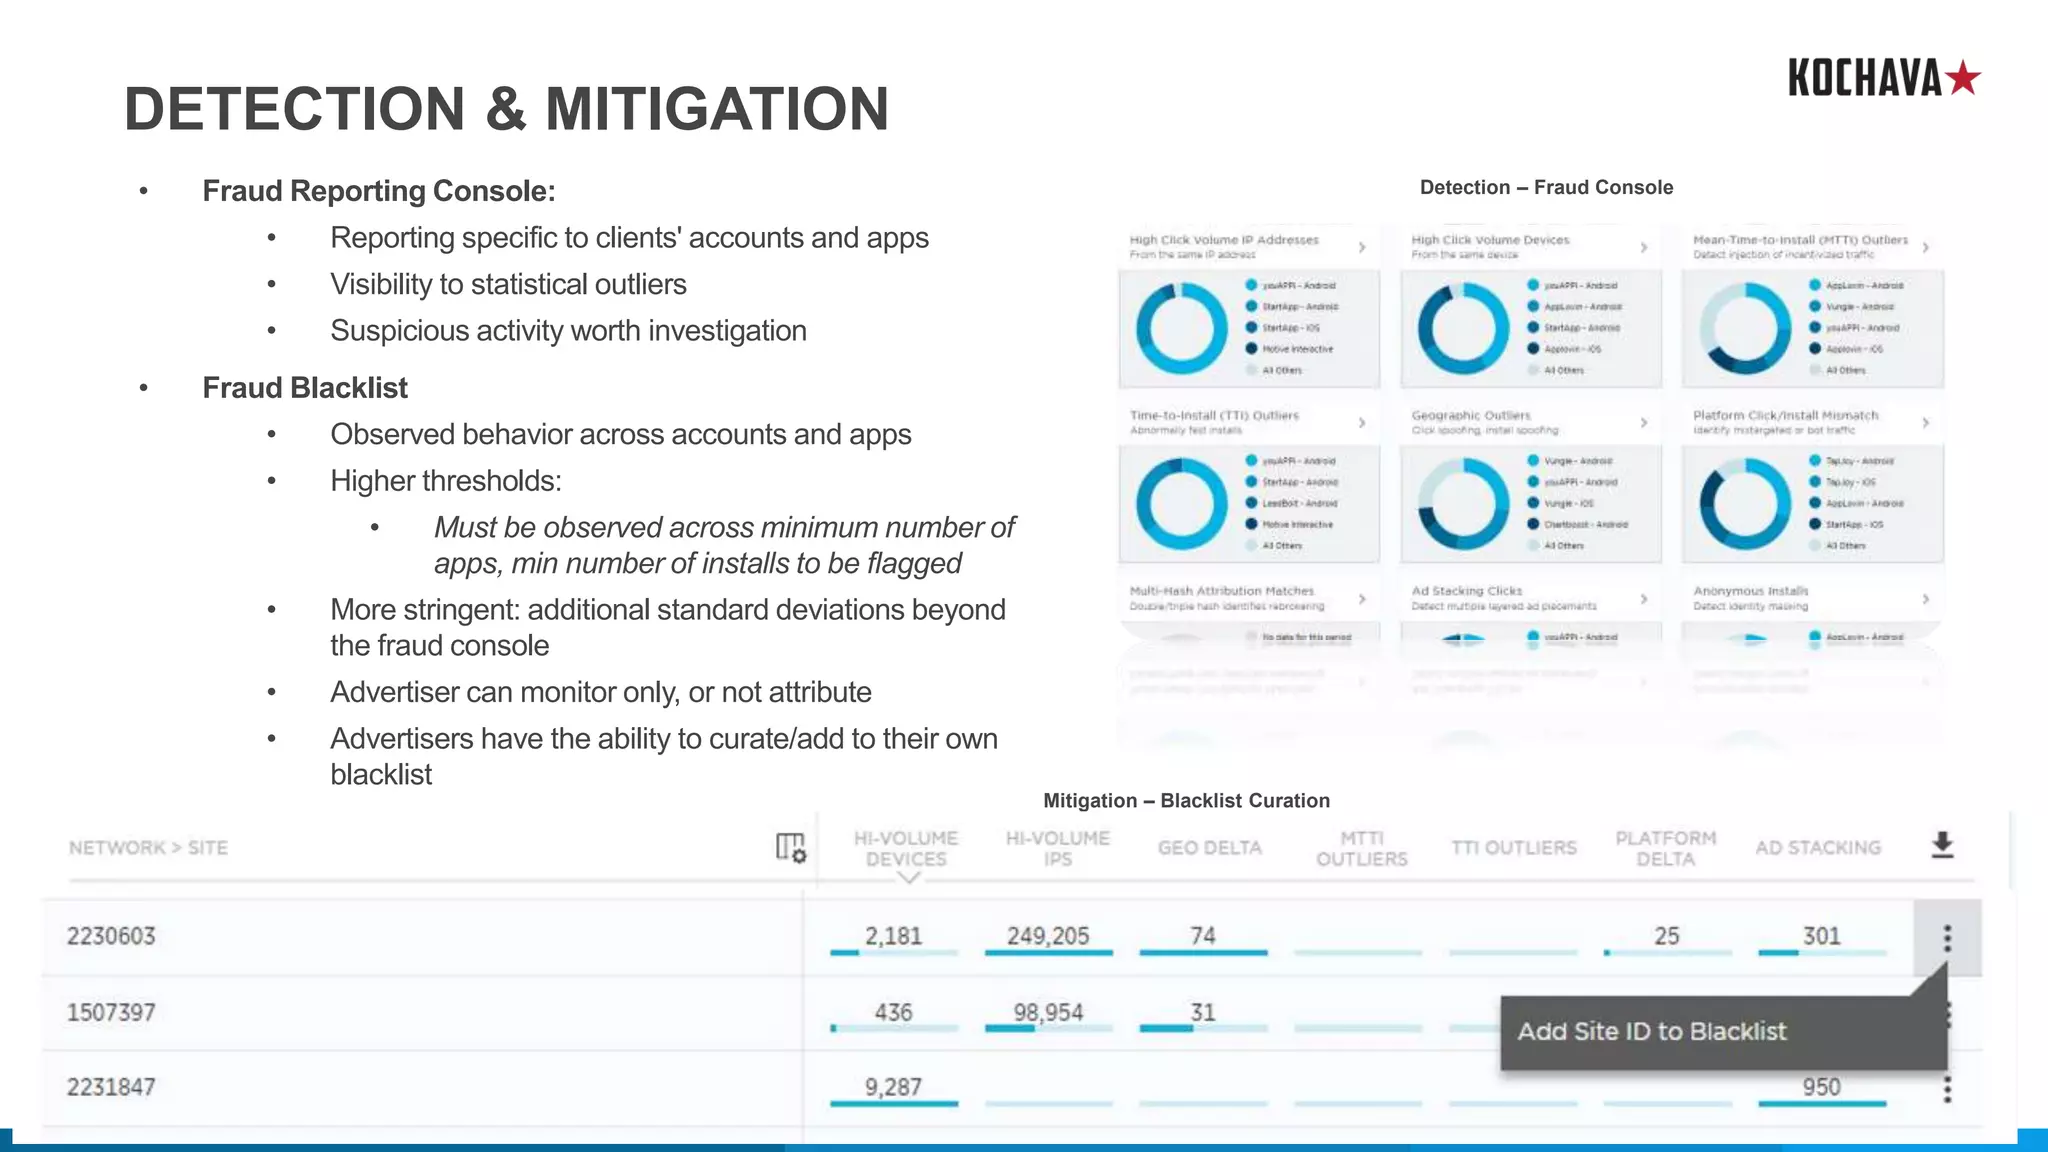
A CURE FOR AD FRAUD
TURNING FRAUD DETECTION INTO FRAUD PREVENTION
INTRODUCING THE SPEAKERS
RAYMUND BAUTISTA
Head of Strategic Partnerships
linkedin.com/in/raymundb @therealraymund
GRANT SIMMONS
Director of Client Analytics
linkedin.com/in/grantsimmons
AD FRAUD:
WHO IS TO BLAME?
EVERYONE!
AD FRAUD IS A MAJOR PROBLEM
GLOBAL LOSSES
DUE TO AD FRAUD
$16.4 BN
OF ALL DIGITAL AD SPEND
IS SUSPICIOUS IN THE US
10%
0.00%
5.00%
10.00%
15.00%
20.00%
25.00%
30.00%
35.00%
40.00%
45.00%
Smartphone Fraud Impression % by Country
ADVERTISERS AND NETWORKS ARE
SUSCEPTIBLE TO FRAUD IN TWO WAYS
1
Install-based fraud where the clicks, installs
and users are all non-existent
5
2
Misattribution where installs are valid but
credit is stolen from clean networks
TYPES OF MOBILE AD FRAUD
Automated Traffic
Unauthorized Re-brokering
Click Spamming
Ad Stacking
Accidental Clicks
Click Sniping
1
2 5
4
3 6
DIAGNOSTICS
& ANALYSIS
DELIVERING ACCOUNTABILITY
What can networks do to provide fraud-free traffic?
MEASUREMENT
& TRANSPARENCY
PUBLISHER QUALITY
& CONTROL
Publisher Onboarding Checks
Content Quality
Publisher properties
undergo thorough
evaluation and
ownership verification
Brand Safety
Delist brand unsafe, hosting malware
or not sending app bundle ID or
mobile website domain.
Delisting Duplicates
Publishers are prevented from creating duplicate
accounts once blacklisted.
Arresting Site Subletting
Extensive technical checks ensure ads are
rendered on the registered and verified
publisher property.
Checking Request Patterns
Devices are monitored for unusually
high request volumes.
Diagnostics & Analysis
Runtime checks
Cryptographic
Signatures
Cryptographically
secured clean
impression-to-click-to-
install mapping Discarding Automated Traffic
Identifying bots and scripts through
pattern analysis of impressions and
clicks in real time.
Velocity Checks
Velocity checks to prevent ad
fatigue and to ensure that every ad
unit has a fair chance of being
registered by the user.
Double-Checks on Data Signals
Publisher data signals authenticated against
data collected directly by the InMobi SDK to
discard any invalid data.
Studying Suspicious Activity
Integrations with leading measurement and
attribution platforms to identify and analyze
all suspicious behavior.
Measurement & Transparency
Third-party checks
Audience Verification
Audience verification tags
providing external
verification on
demographic data
segments. Viewable Inventory
Integrations with viewability
measurement providers to
certify viewable
impressions across all
campaigns.
Tracking Quality of
Installs
Extensive partnerships with
third-party providers to
analyze quality of installs
and complement internal
identification of invalid
data.
Straining Invalid
Traffic
Clicks and renders are
actively screened for
suspicious patterns
HOW CAN WE FIGHT FRAUD?
INVEST WISELY
Work with networks and partners
that are heavily invested in fraud
prevention tools.
DEMAND TRANSPARENCY
Demand transparency into
campaign data for performance
safety and campaign cleanliness.
METRICS THAT
MATTER
Invest in quality traffic that is
certified by industry bodies; partner
with leading measurement
platforms.
DEFINE STANDARDS
Agree to standards and
terminology. Go beyond the install.
Shift to an “optimum acquisition
cost’” model.
Fraud Highlights
OVERVIEW
What is “normal?” Looking at the past 90 days: Average network:
15.4% of clicks are fraudulent, 4.1% of installs
Breakdown:
• The Top 10 highest volume networks generate 84% of all Fraudulent clicks
• The Kochava Blacklist is able to identify that 27% of the Top 10 network’s
installs are fraudulent
• There are specific networks whose total clicks exceed over 50% of blacklisted
traffic
• There are dramatic differences by network by platform. A particular network on
Android, has 45% of it’s clicks identified as fraudulent, but less than 1% on iOS.
CLICK SPAMMING, CLICK INJECTION
ATTRIBUTION FRAUD
UNREASONABLE CTI RATES AD STACKING
TTI OUTLIERS
CLICK SPAMMING, CLICK INJECTION
ATTRIBUTION FRAUD
IPs WITH HIGH CLICK VOLUMECLICK-TO-INSTALL TIME DISTRIBUTION
MANUFACTURED INSTALLS OR TRAFFIC
DEVICES WITH HIGH CLICK VOLUME
MTTI
ANONYMOUS INSTALLS
DETECTION & MITIGATION
Detection – Fraud Console
Mitigation – Blacklist Curation
• Fraud Reporting Console:
• Reporting specific to clients' accounts and apps
• Visibility to statistical outliers
• Suspicious activity worth investigation
• Fraud Blacklist
• Observed behavior across accounts and apps
• Higher thresholds:
• Must be observed across minimum number of
apps, min number of installs to be flagged
• More stringent: additional standard deviations beyond
the fraud console
• Advertiser can monitor only, or not attribute
• Advertisers have the ability to curate/add to their own
blacklist
WHY ALL THIS FRAUD TO BEGIN WITH?
• Attribution Fraud: 70% of what we detect
• Theory:
• DR attribution demands instant feedback loops
• Rewards last click, not maximized reach
• So, networks are incentivized to be the last click
• UA function, though, is to maximize REACH
• The first impression does the most incremental ‘work’
• Thus the goal of networks should serve as many first impressions as possible
• However, the attribution dynamics rewards the last interaction:
this results in the click spamming everyone's witnessing.
• However, there is value in collecting all of the touchpoints leading to an install
• Additional attribution frameworks:
• MTA (may not mitigate fraud, however)
• Incremental (remarkably difficult in digital, more so with mobile)
QUESTIONS?

A Cure for Ad-Fraud: Turning Fraud Detection into Fraud Prevention

  • 1.
    A CURE FORAD FRAUD TURNING FRAUD DETECTION INTO FRAUD PREVENTION
  • 2.
    INTRODUCING THE SPEAKERS RAYMUNDBAUTISTA Head of Strategic Partnerships linkedin.com/in/raymundb @therealraymund GRANT SIMMONS Director of Client Analytics linkedin.com/in/grantsimmons
  • 3.
    AD FRAUD: WHO ISTO BLAME? EVERYONE!
  • 4.
    AD FRAUD ISA MAJOR PROBLEM GLOBAL LOSSES DUE TO AD FRAUD $16.4 BN OF ALL DIGITAL AD SPEND IS SUSPICIOUS IN THE US 10% 0.00% 5.00% 10.00% 15.00% 20.00% 25.00% 30.00% 35.00% 40.00% 45.00% Smartphone Fraud Impression % by Country
  • 5.
    ADVERTISERS AND NETWORKSARE SUSCEPTIBLE TO FRAUD IN TWO WAYS 1 Install-based fraud where the clicks, installs and users are all non-existent 5 2 Misattribution where installs are valid but credit is stolen from clean networks
  • 6.
    TYPES OF MOBILEAD FRAUD Automated Traffic Unauthorized Re-brokering Click Spamming Ad Stacking Accidental Clicks Click Sniping 1 2 5 4 3 6
  • 7.
    DIAGNOSTICS & ANALYSIS DELIVERING ACCOUNTABILITY Whatcan networks do to provide fraud-free traffic? MEASUREMENT & TRANSPARENCY PUBLISHER QUALITY & CONTROL
  • 8.
    Publisher Onboarding Checks ContentQuality Publisher properties undergo thorough evaluation and ownership verification Brand Safety Delist brand unsafe, hosting malware or not sending app bundle ID or mobile website domain. Delisting Duplicates Publishers are prevented from creating duplicate accounts once blacklisted. Arresting Site Subletting Extensive technical checks ensure ads are rendered on the registered and verified publisher property. Checking Request Patterns Devices are monitored for unusually high request volumes.
  • 9.
    Diagnostics & Analysis Runtimechecks Cryptographic Signatures Cryptographically secured clean impression-to-click-to- install mapping Discarding Automated Traffic Identifying bots and scripts through pattern analysis of impressions and clicks in real time. Velocity Checks Velocity checks to prevent ad fatigue and to ensure that every ad unit has a fair chance of being registered by the user. Double-Checks on Data Signals Publisher data signals authenticated against data collected directly by the InMobi SDK to discard any invalid data. Studying Suspicious Activity Integrations with leading measurement and attribution platforms to identify and analyze all suspicious behavior.
  • 10.
    Measurement & Transparency Third-partychecks Audience Verification Audience verification tags providing external verification on demographic data segments. Viewable Inventory Integrations with viewability measurement providers to certify viewable impressions across all campaigns. Tracking Quality of Installs Extensive partnerships with third-party providers to analyze quality of installs and complement internal identification of invalid data. Straining Invalid Traffic Clicks and renders are actively screened for suspicious patterns
  • 11.
    HOW CAN WEFIGHT FRAUD? INVEST WISELY Work with networks and partners that are heavily invested in fraud prevention tools. DEMAND TRANSPARENCY Demand transparency into campaign data for performance safety and campaign cleanliness. METRICS THAT MATTER Invest in quality traffic that is certified by industry bodies; partner with leading measurement platforms. DEFINE STANDARDS Agree to standards and terminology. Go beyond the install. Shift to an “optimum acquisition cost’” model.
  • 12.
  • 13.
    OVERVIEW What is “normal?”Looking at the past 90 days: Average network: 15.4% of clicks are fraudulent, 4.1% of installs Breakdown: • The Top 10 highest volume networks generate 84% of all Fraudulent clicks • The Kochava Blacklist is able to identify that 27% of the Top 10 network’s installs are fraudulent • There are specific networks whose total clicks exceed over 50% of blacklisted traffic • There are dramatic differences by network by platform. A particular network on Android, has 45% of it’s clicks identified as fraudulent, but less than 1% on iOS.
  • 14.
    CLICK SPAMMING, CLICKINJECTION ATTRIBUTION FRAUD UNREASONABLE CTI RATES AD STACKING TTI OUTLIERS
  • 15.
    CLICK SPAMMING, CLICKINJECTION ATTRIBUTION FRAUD IPs WITH HIGH CLICK VOLUMECLICK-TO-INSTALL TIME DISTRIBUTION
  • 16.
    MANUFACTURED INSTALLS ORTRAFFIC DEVICES WITH HIGH CLICK VOLUME MTTI ANONYMOUS INSTALLS
  • 17.
    DETECTION & MITIGATION Detection– Fraud Console Mitigation – Blacklist Curation • Fraud Reporting Console: • Reporting specific to clients' accounts and apps • Visibility to statistical outliers • Suspicious activity worth investigation • Fraud Blacklist • Observed behavior across accounts and apps • Higher thresholds: • Must be observed across minimum number of apps, min number of installs to be flagged • More stringent: additional standard deviations beyond the fraud console • Advertiser can monitor only, or not attribute • Advertisers have the ability to curate/add to their own blacklist
  • 18.
    WHY ALL THISFRAUD TO BEGIN WITH? • Attribution Fraud: 70% of what we detect • Theory: • DR attribution demands instant feedback loops • Rewards last click, not maximized reach • So, networks are incentivized to be the last click • UA function, though, is to maximize REACH • The first impression does the most incremental ‘work’ • Thus the goal of networks should serve as many first impressions as possible • However, the attribution dynamics rewards the last interaction: this results in the click spamming everyone's witnessing. • However, there is value in collecting all of the touchpoints leading to an install • Additional attribution frameworks: • MTA (may not mitigate fraud, however) • Incremental (remarkably difficult in digital, more so with mobile)
  • 19.

Editor's Notes

  • #2 Ta
  • #7 Talk about how the first two are pretty basic and simple to understand. Explain them simply in words and then move on to the remainder.