Download as PDF, PPTX


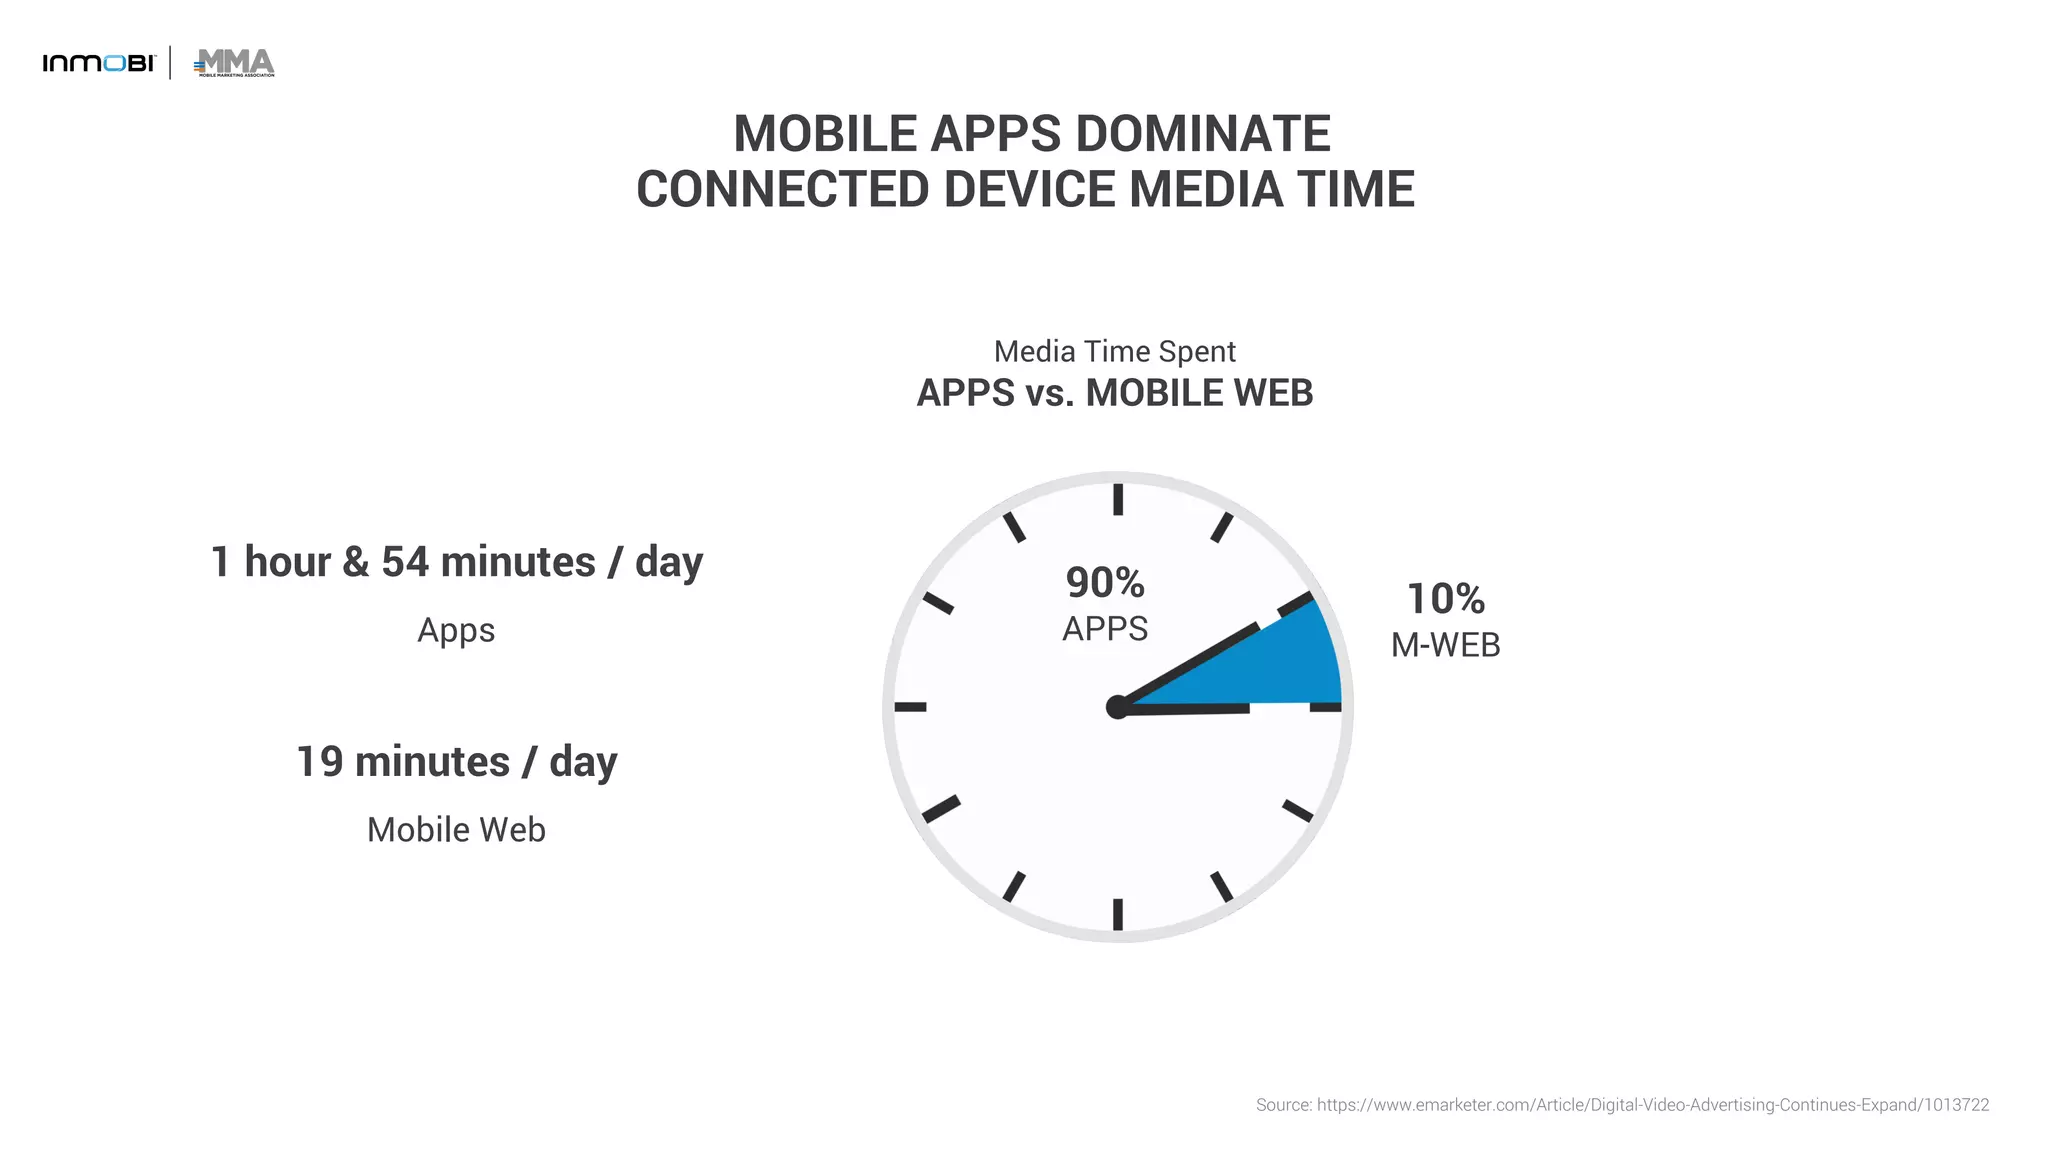

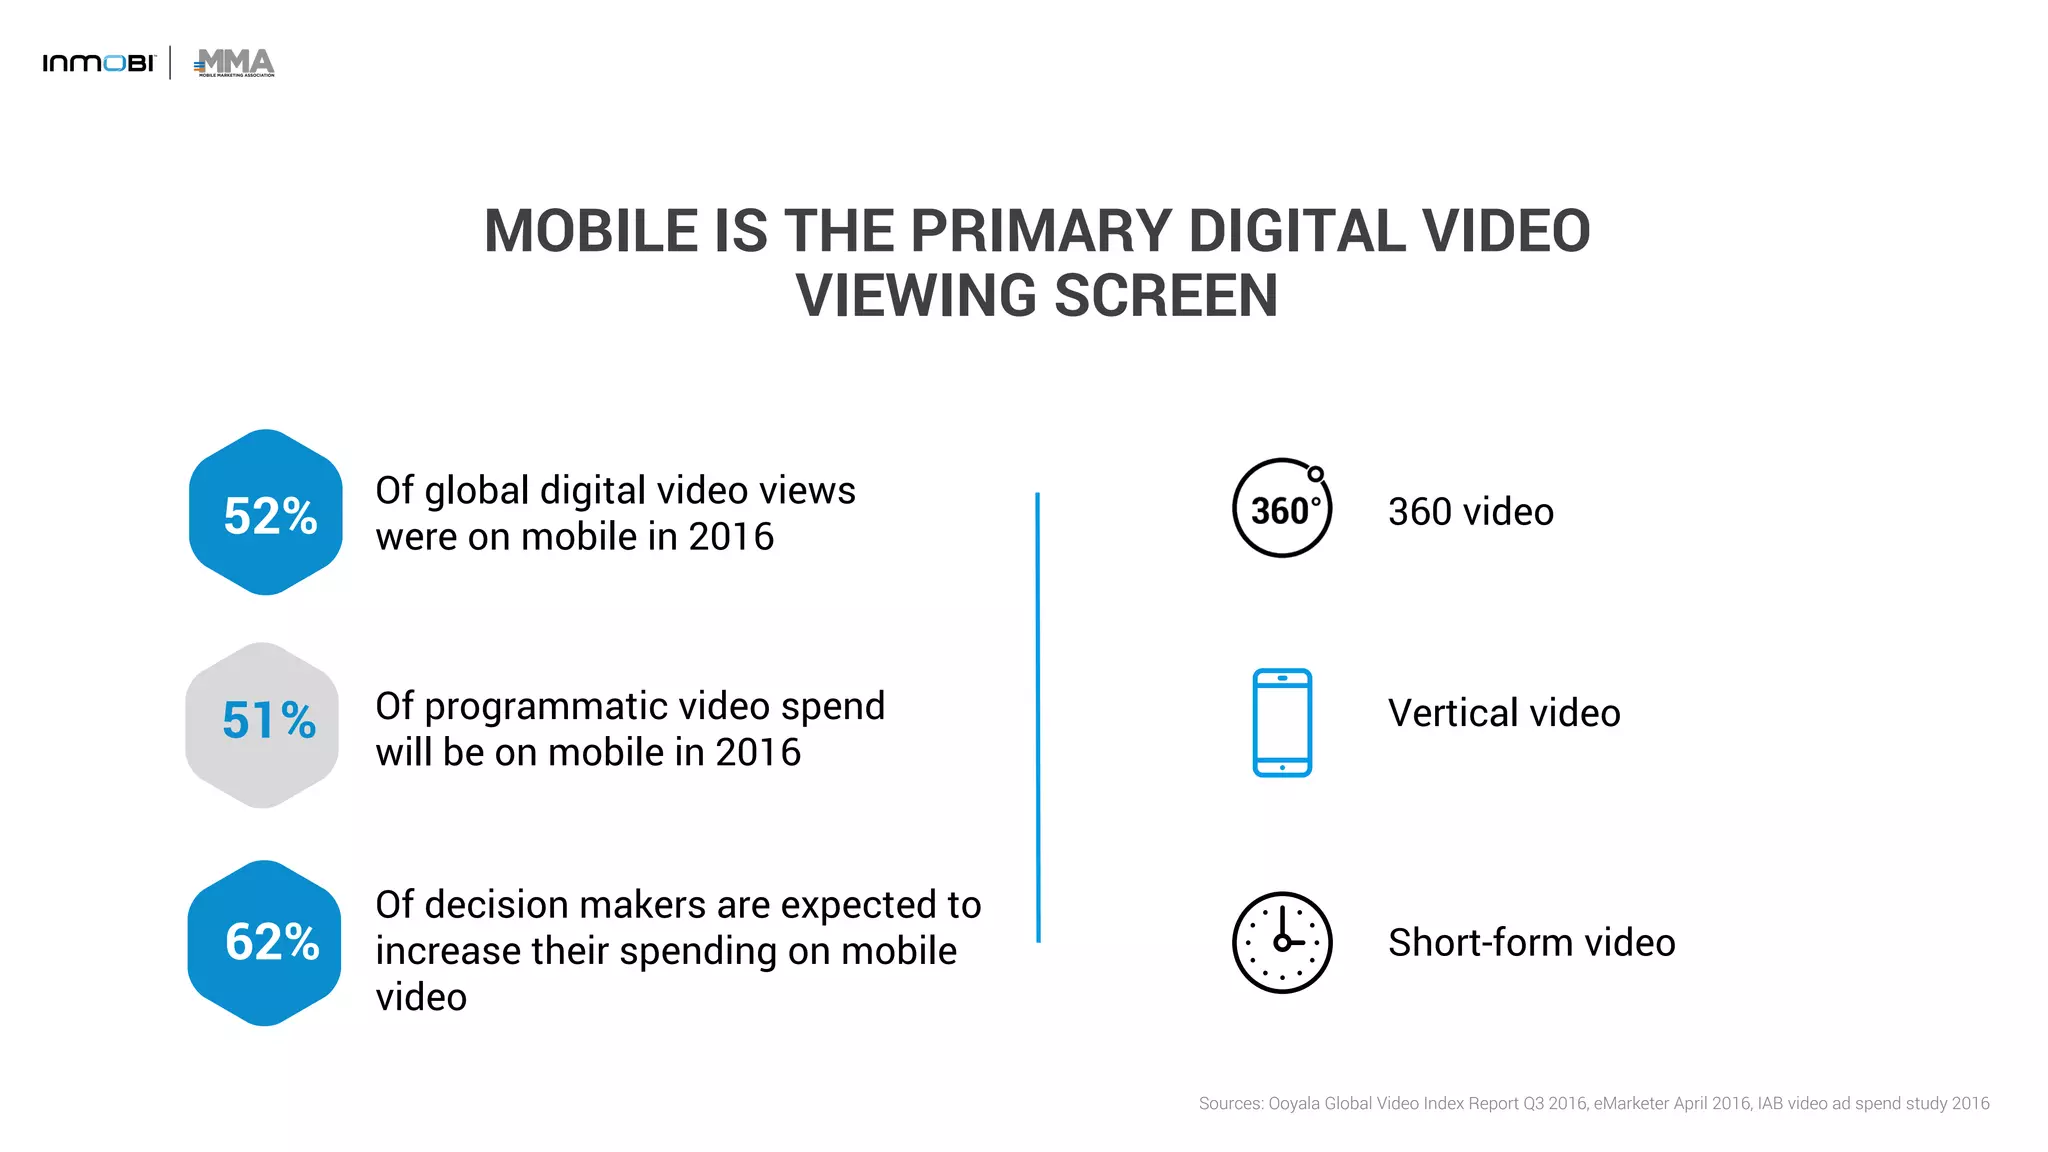

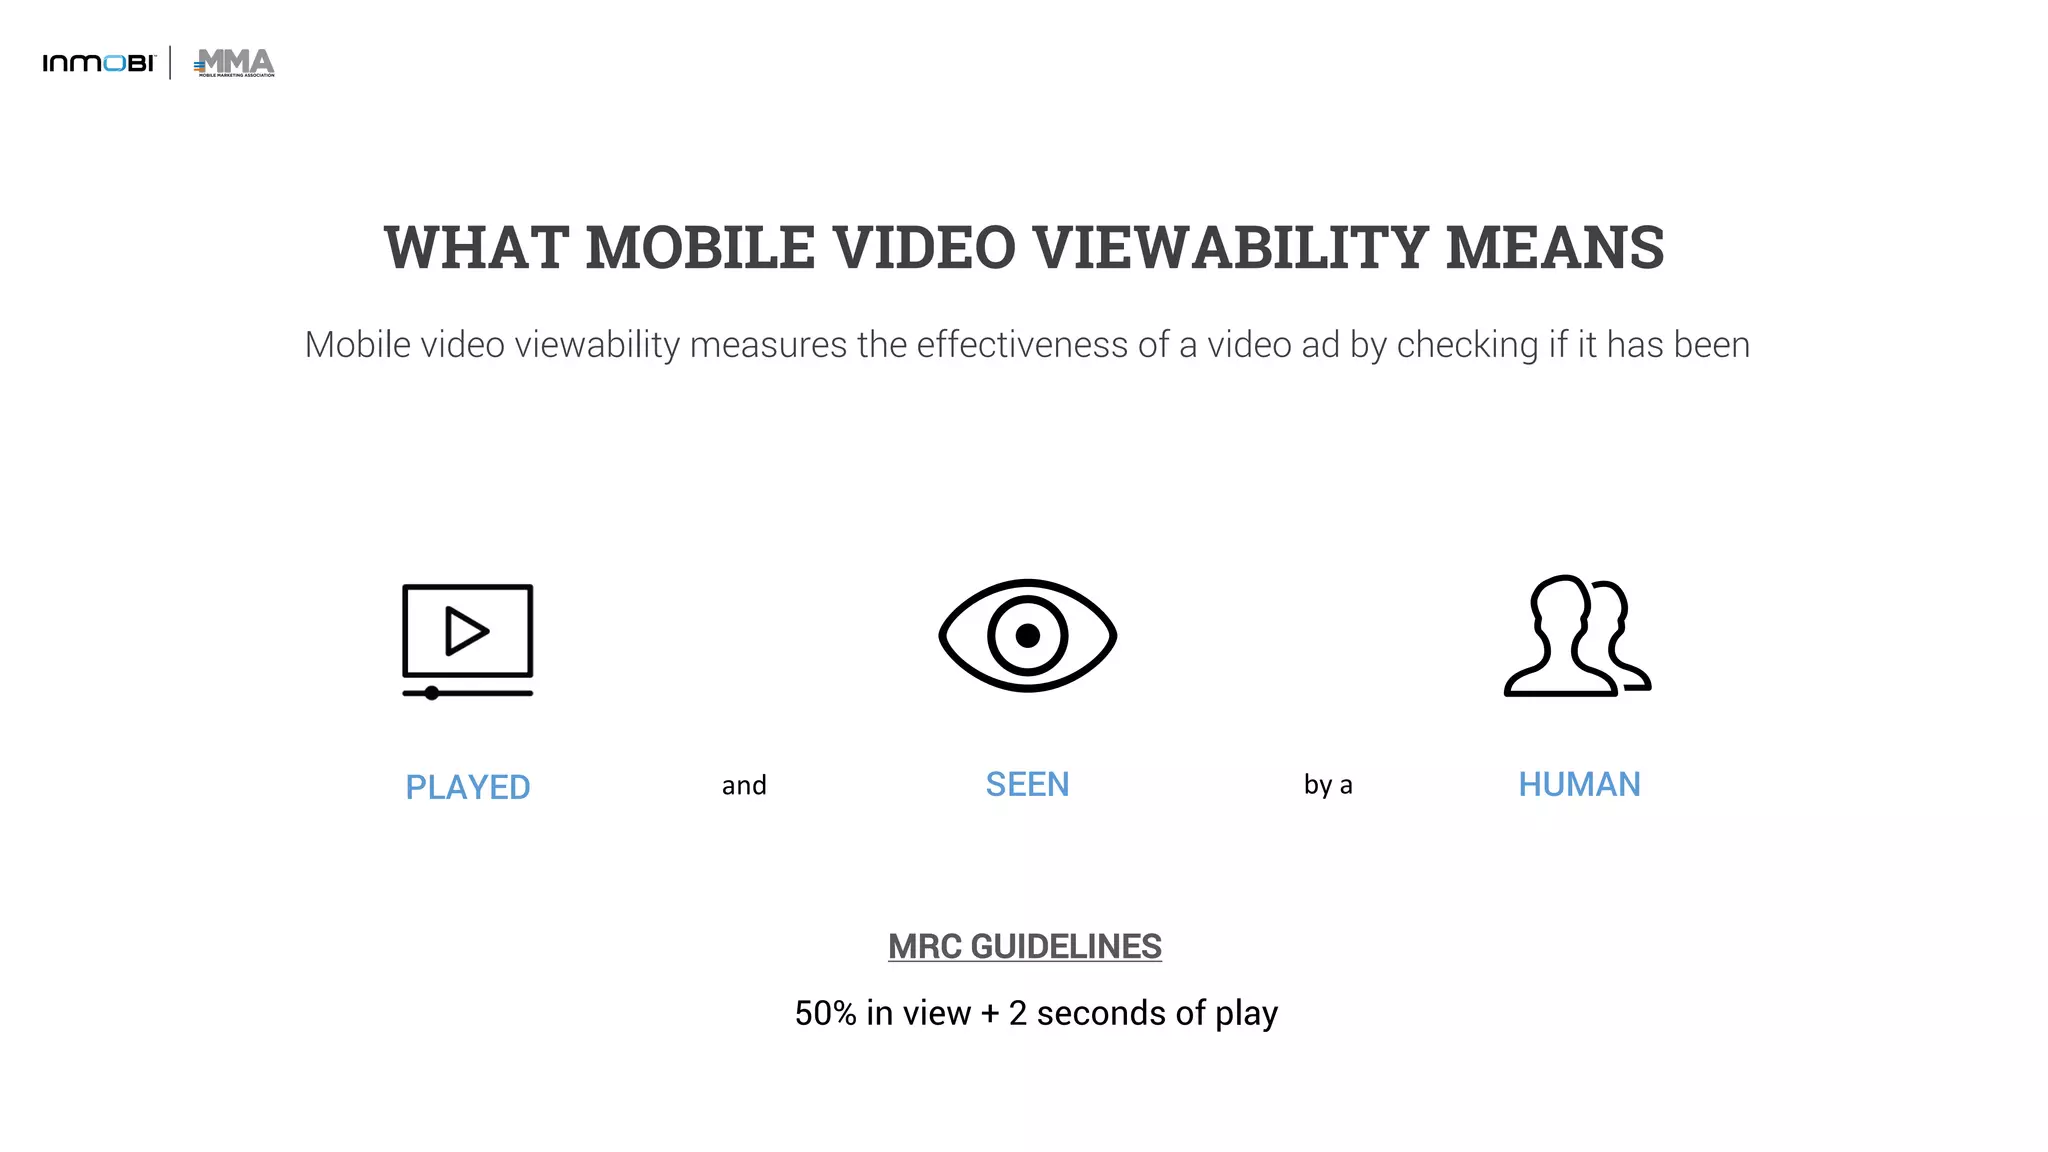


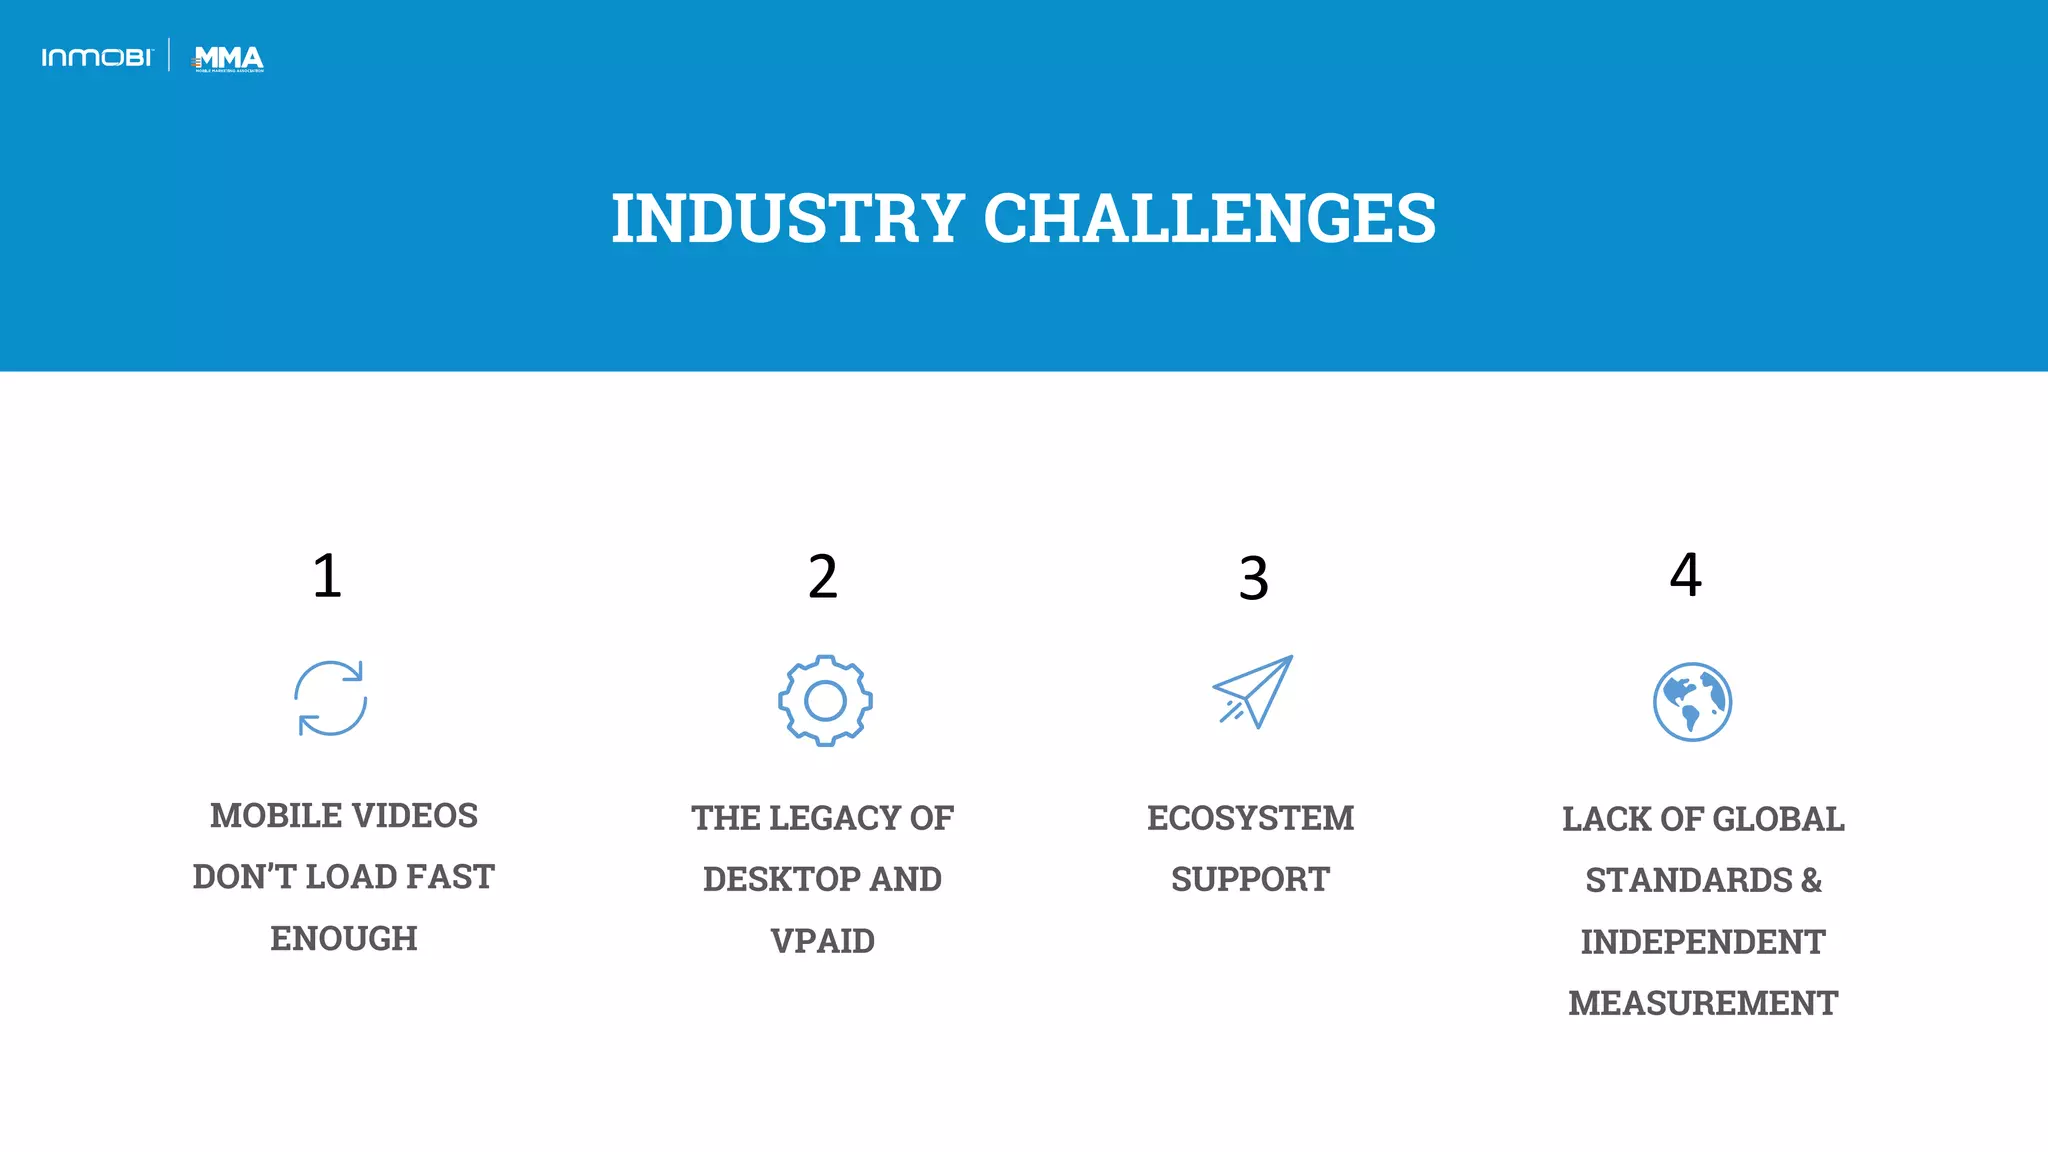


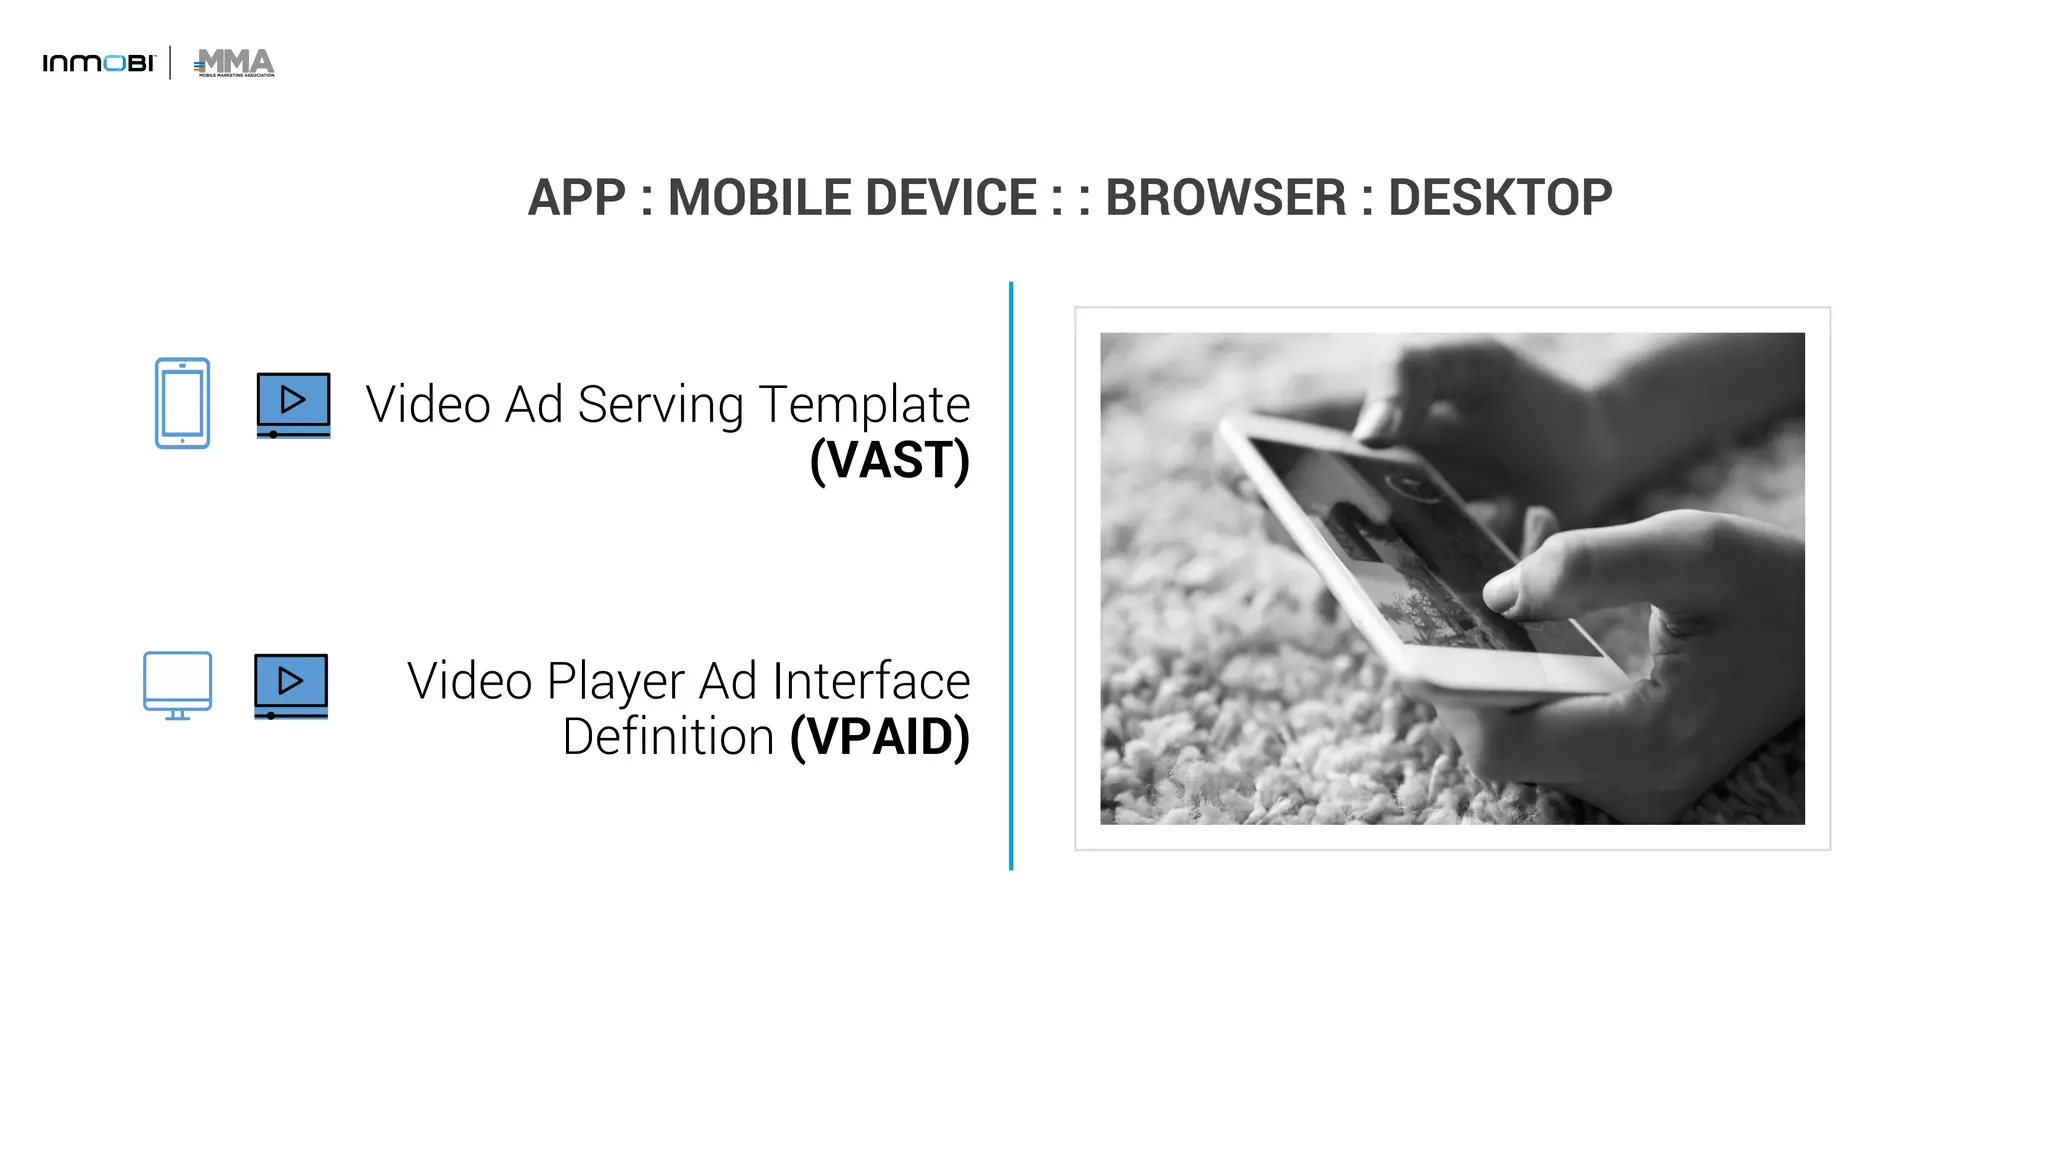

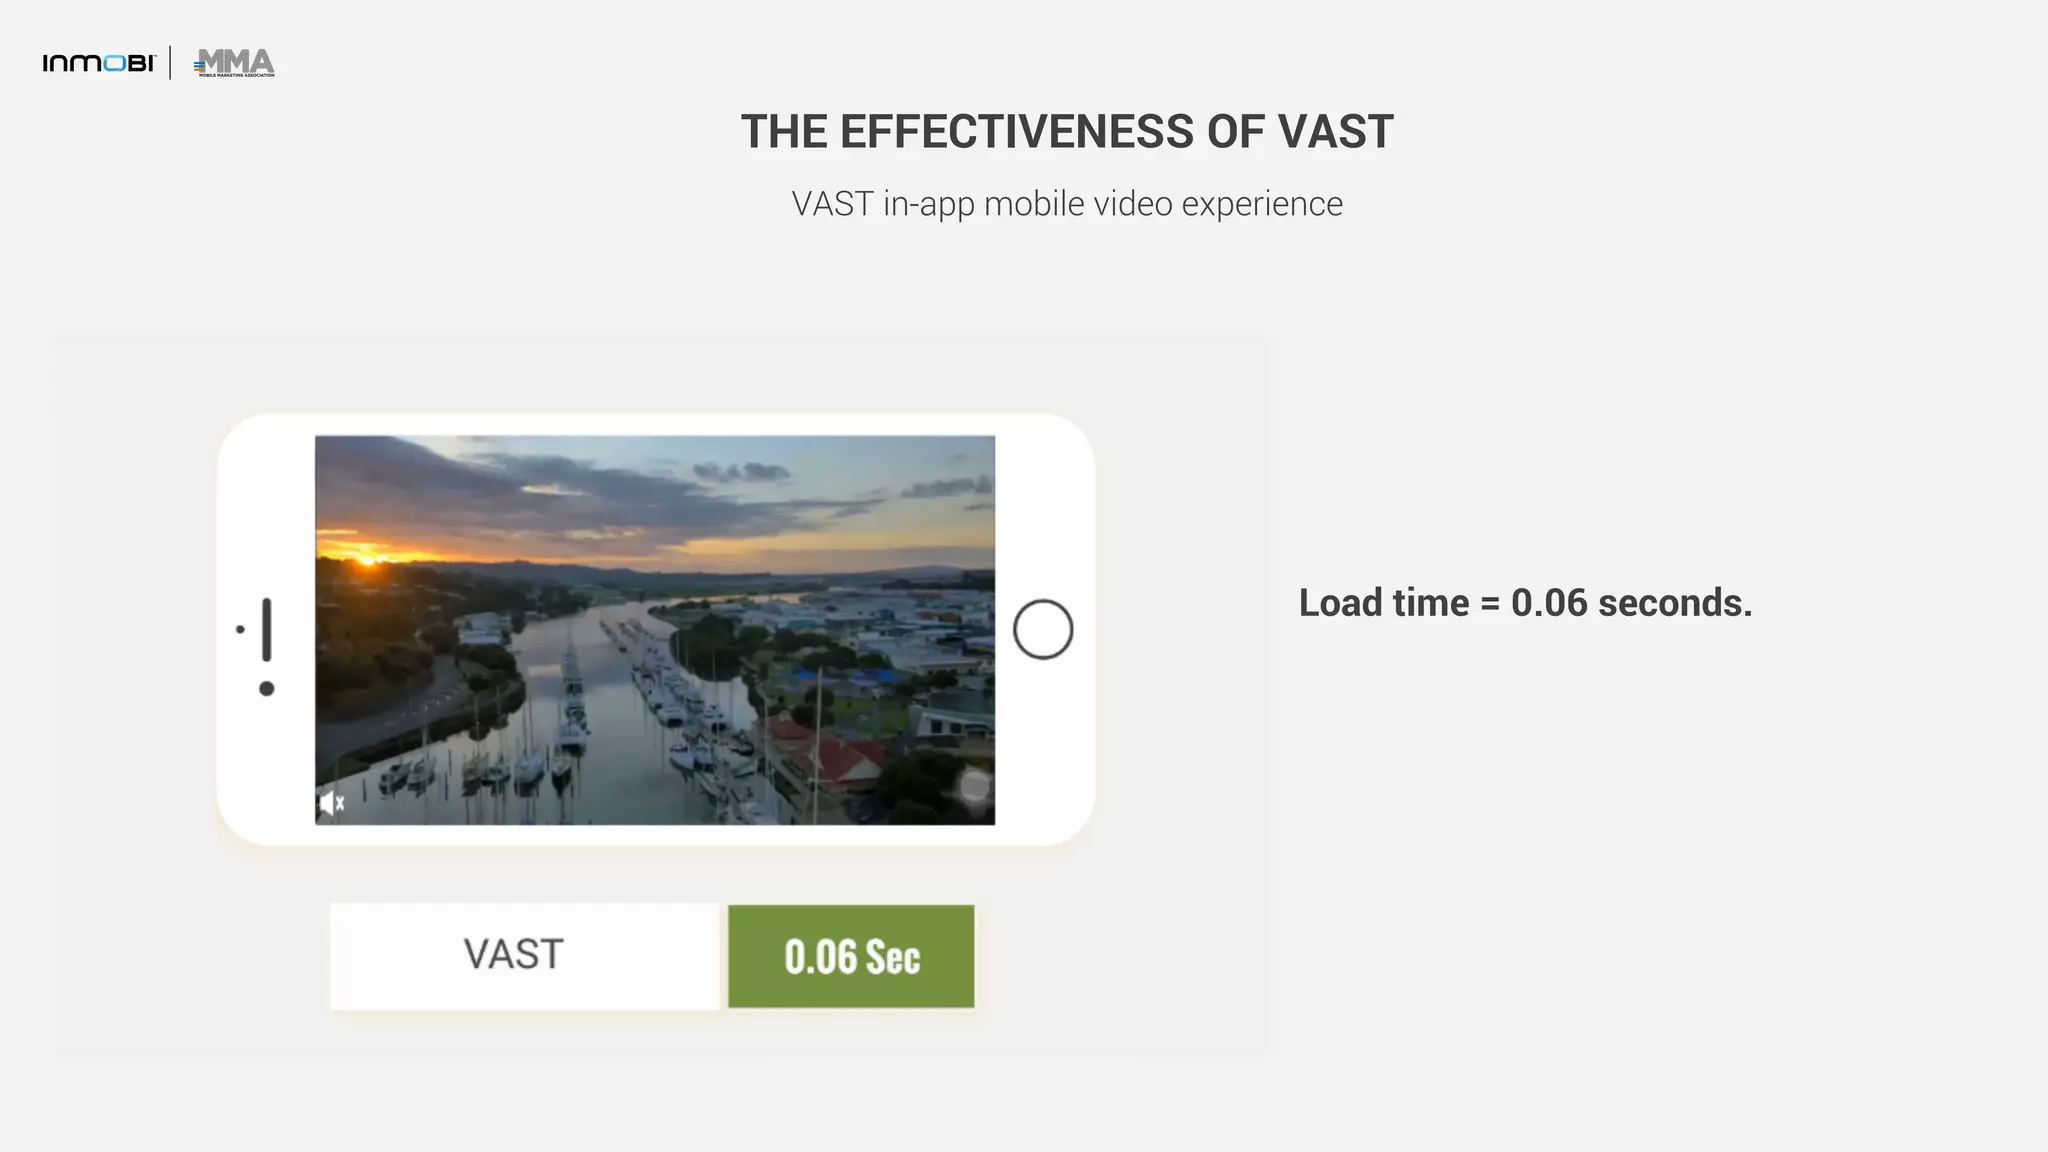
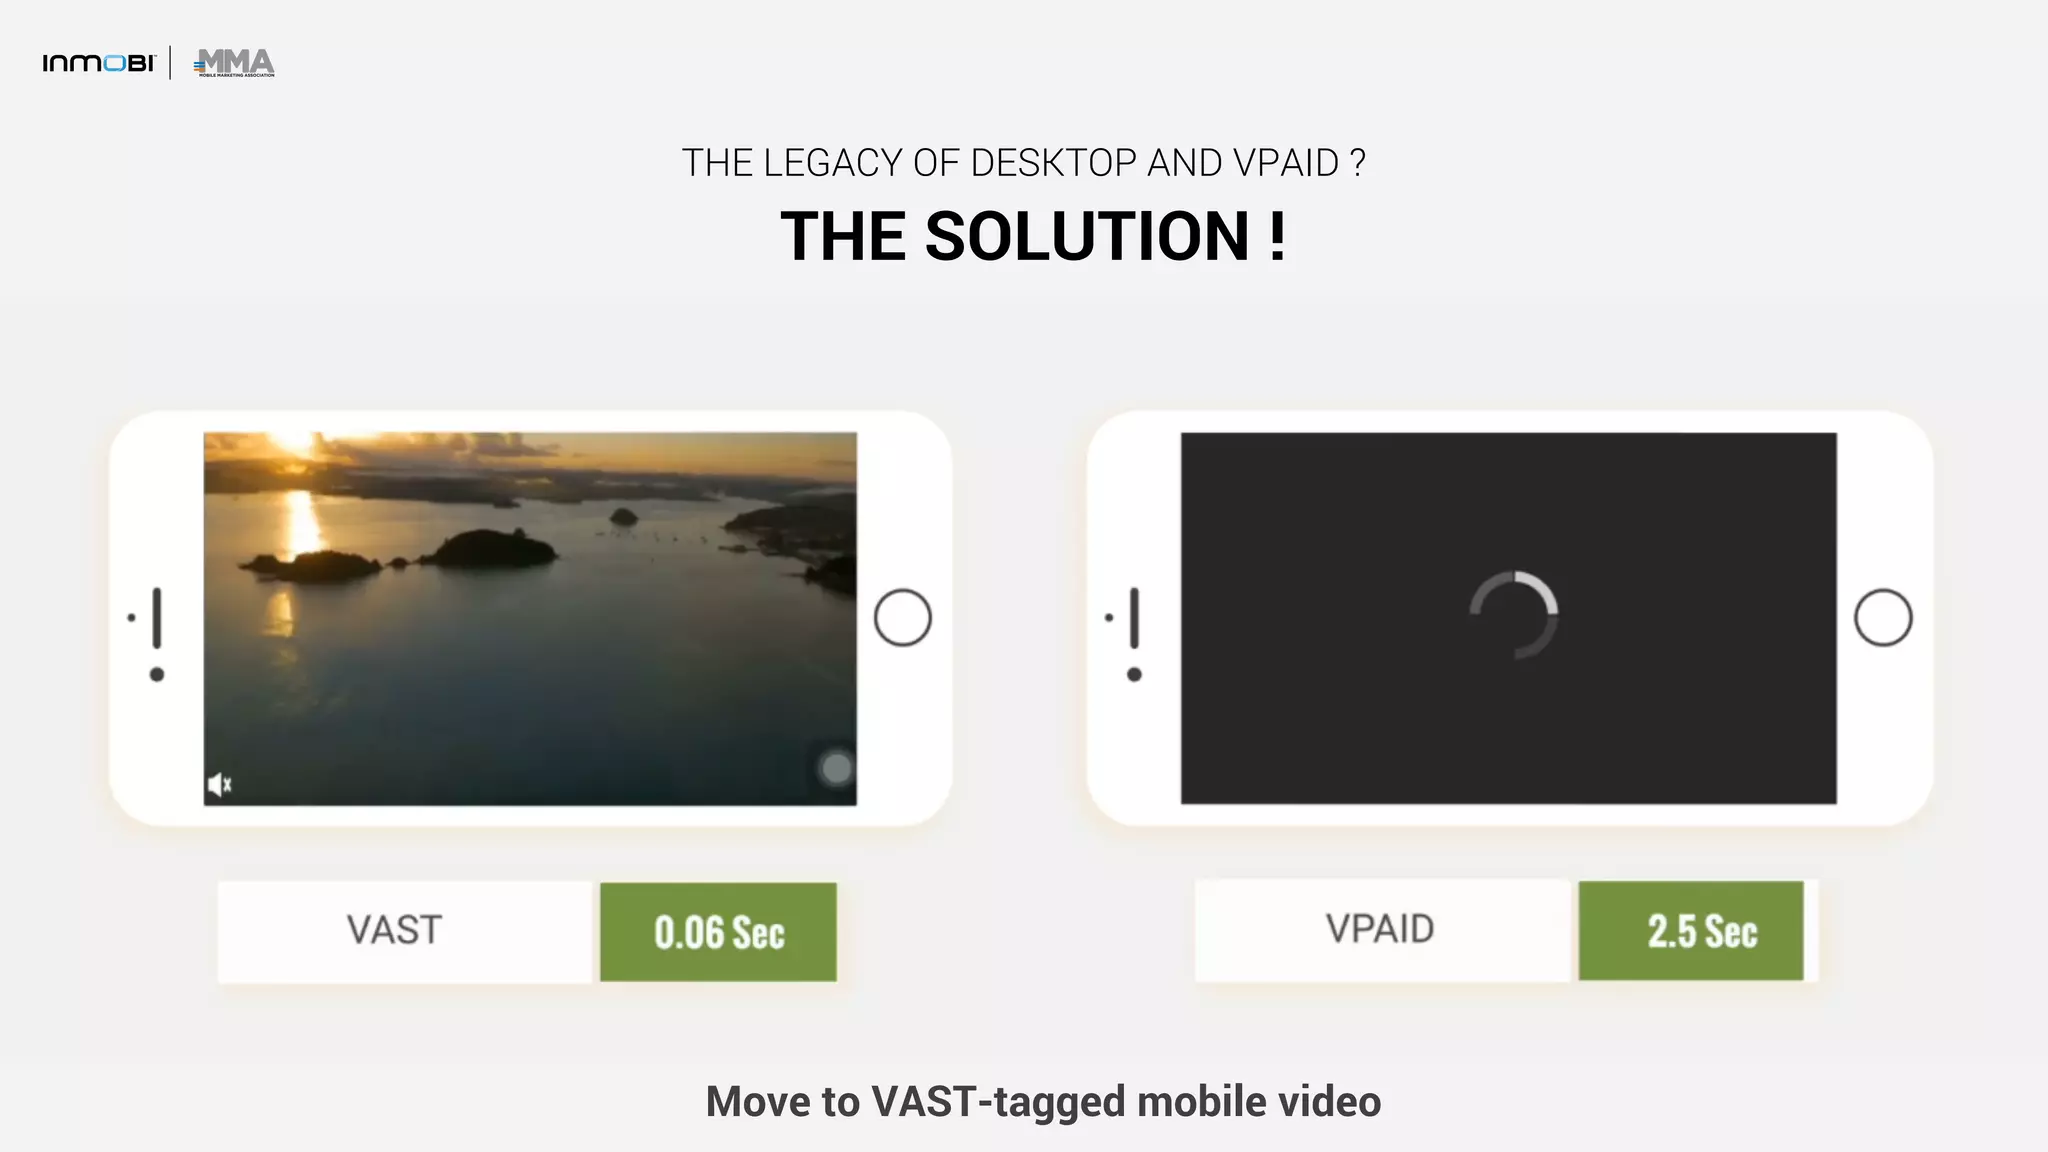


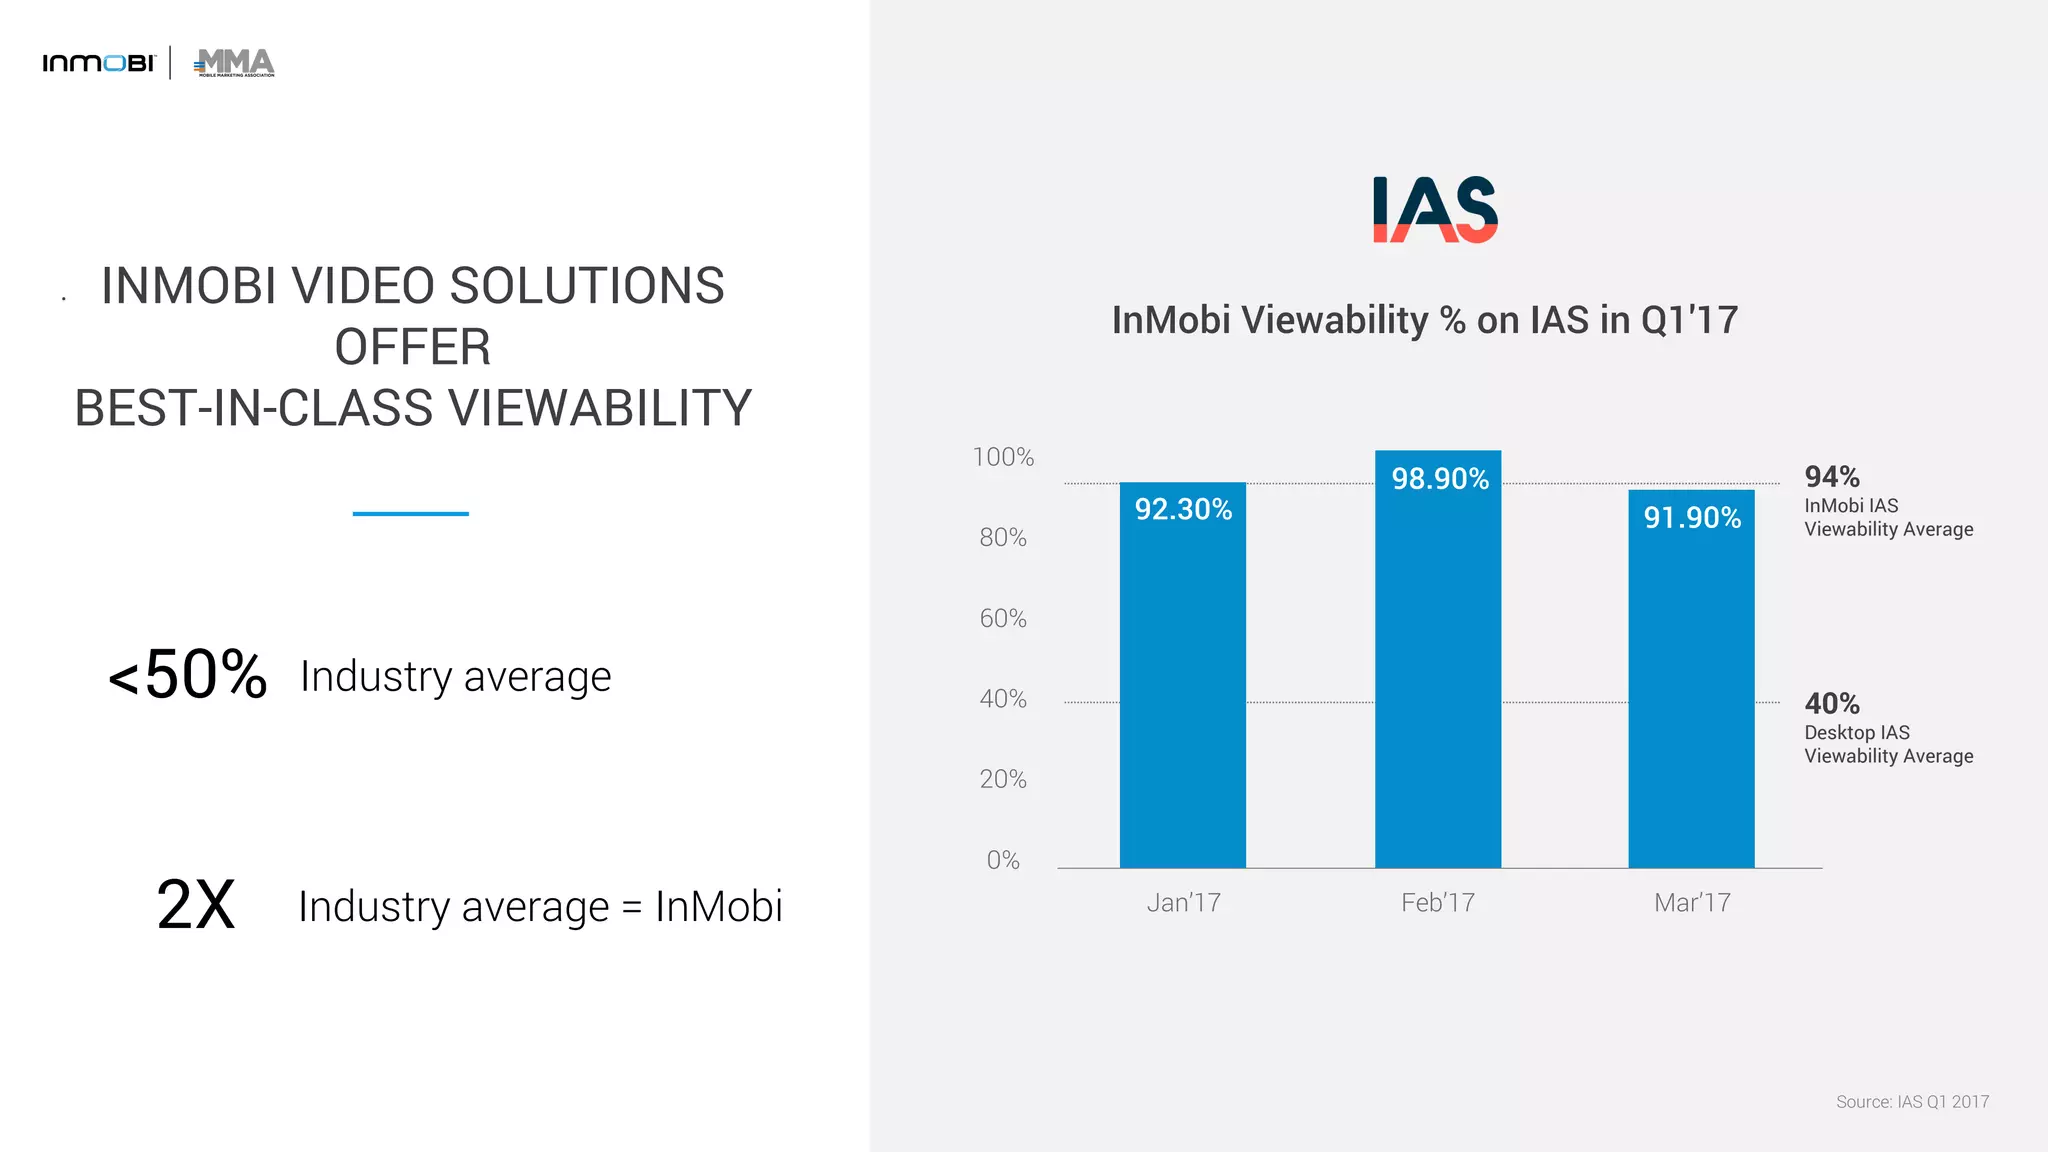
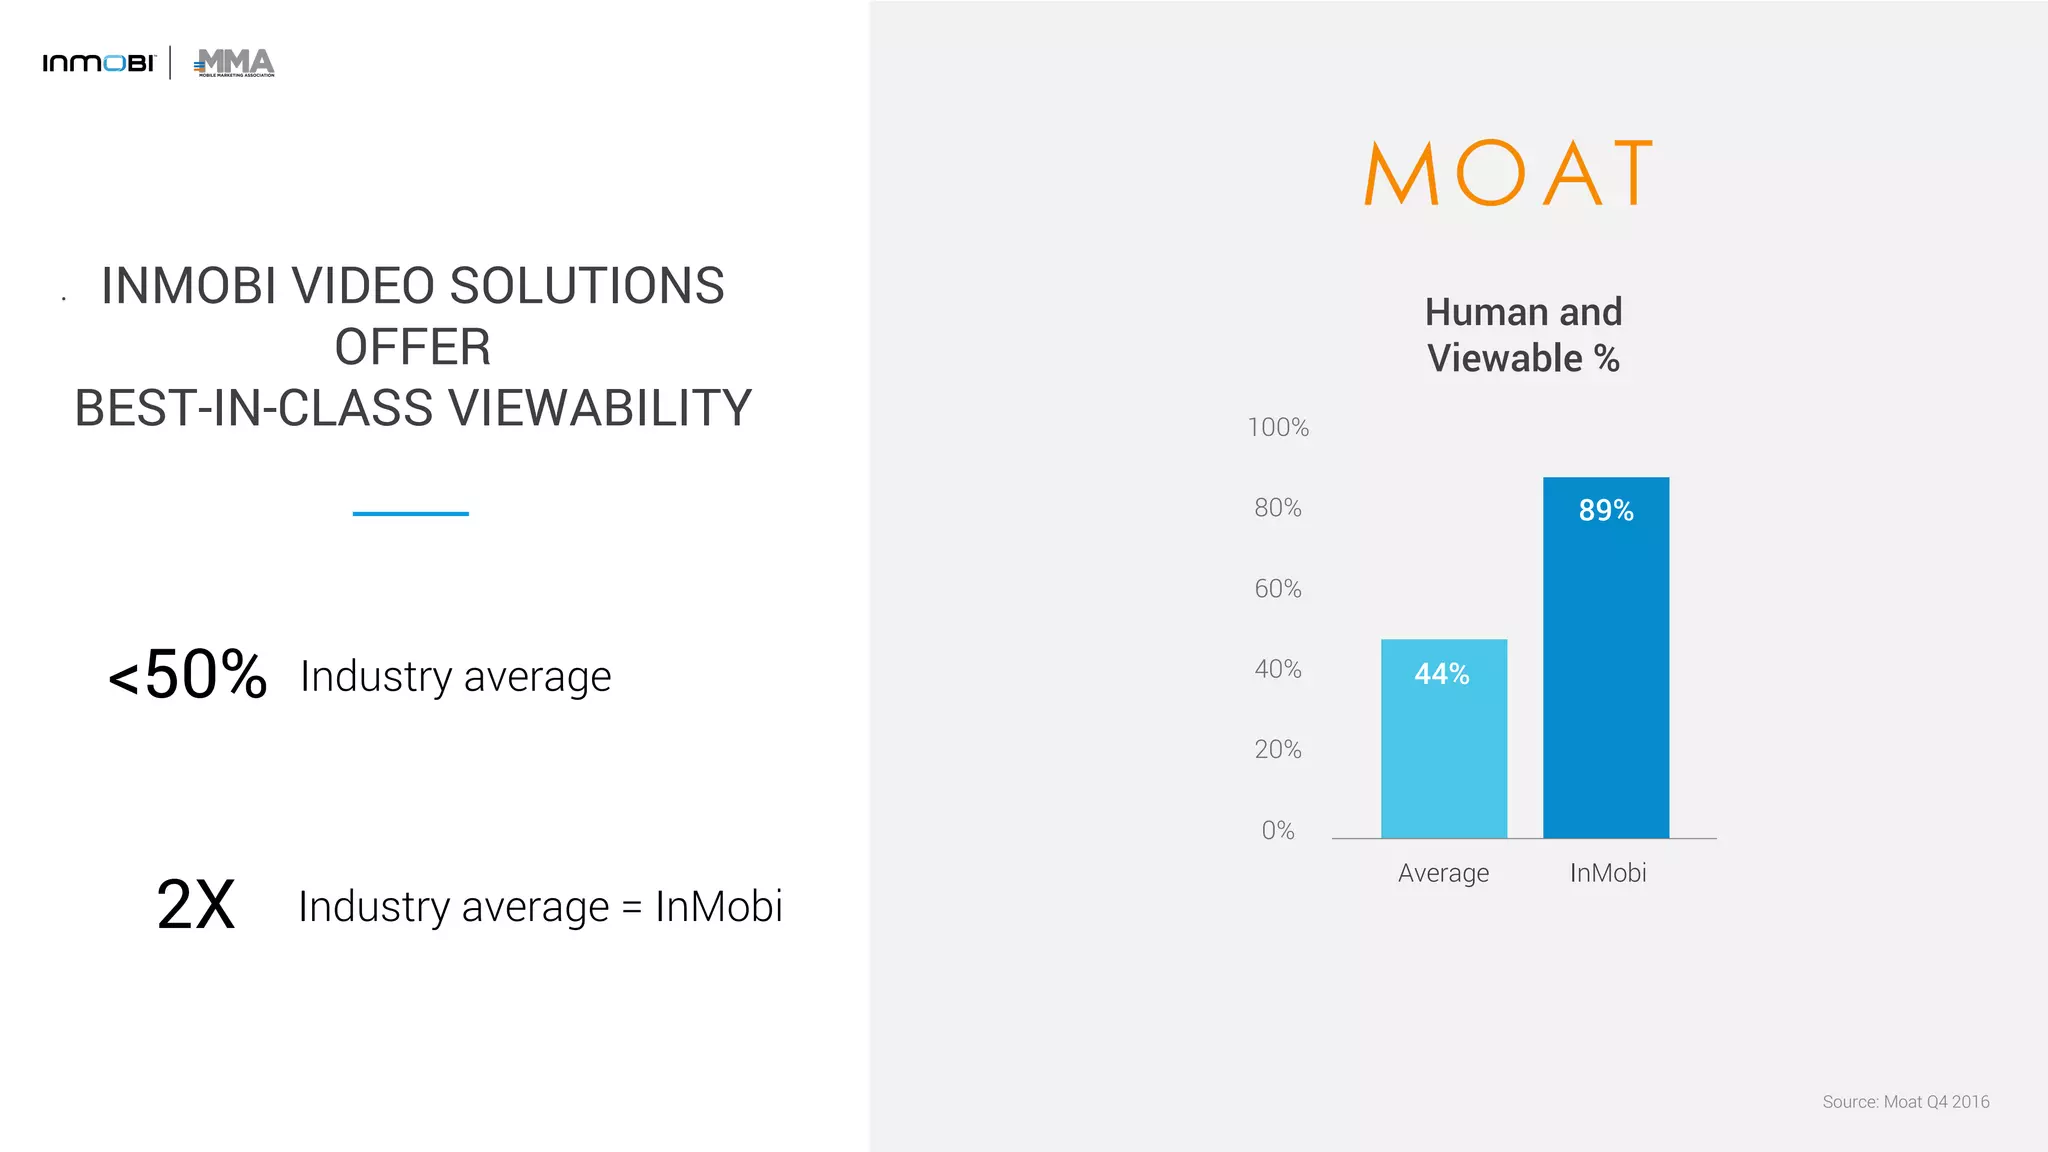
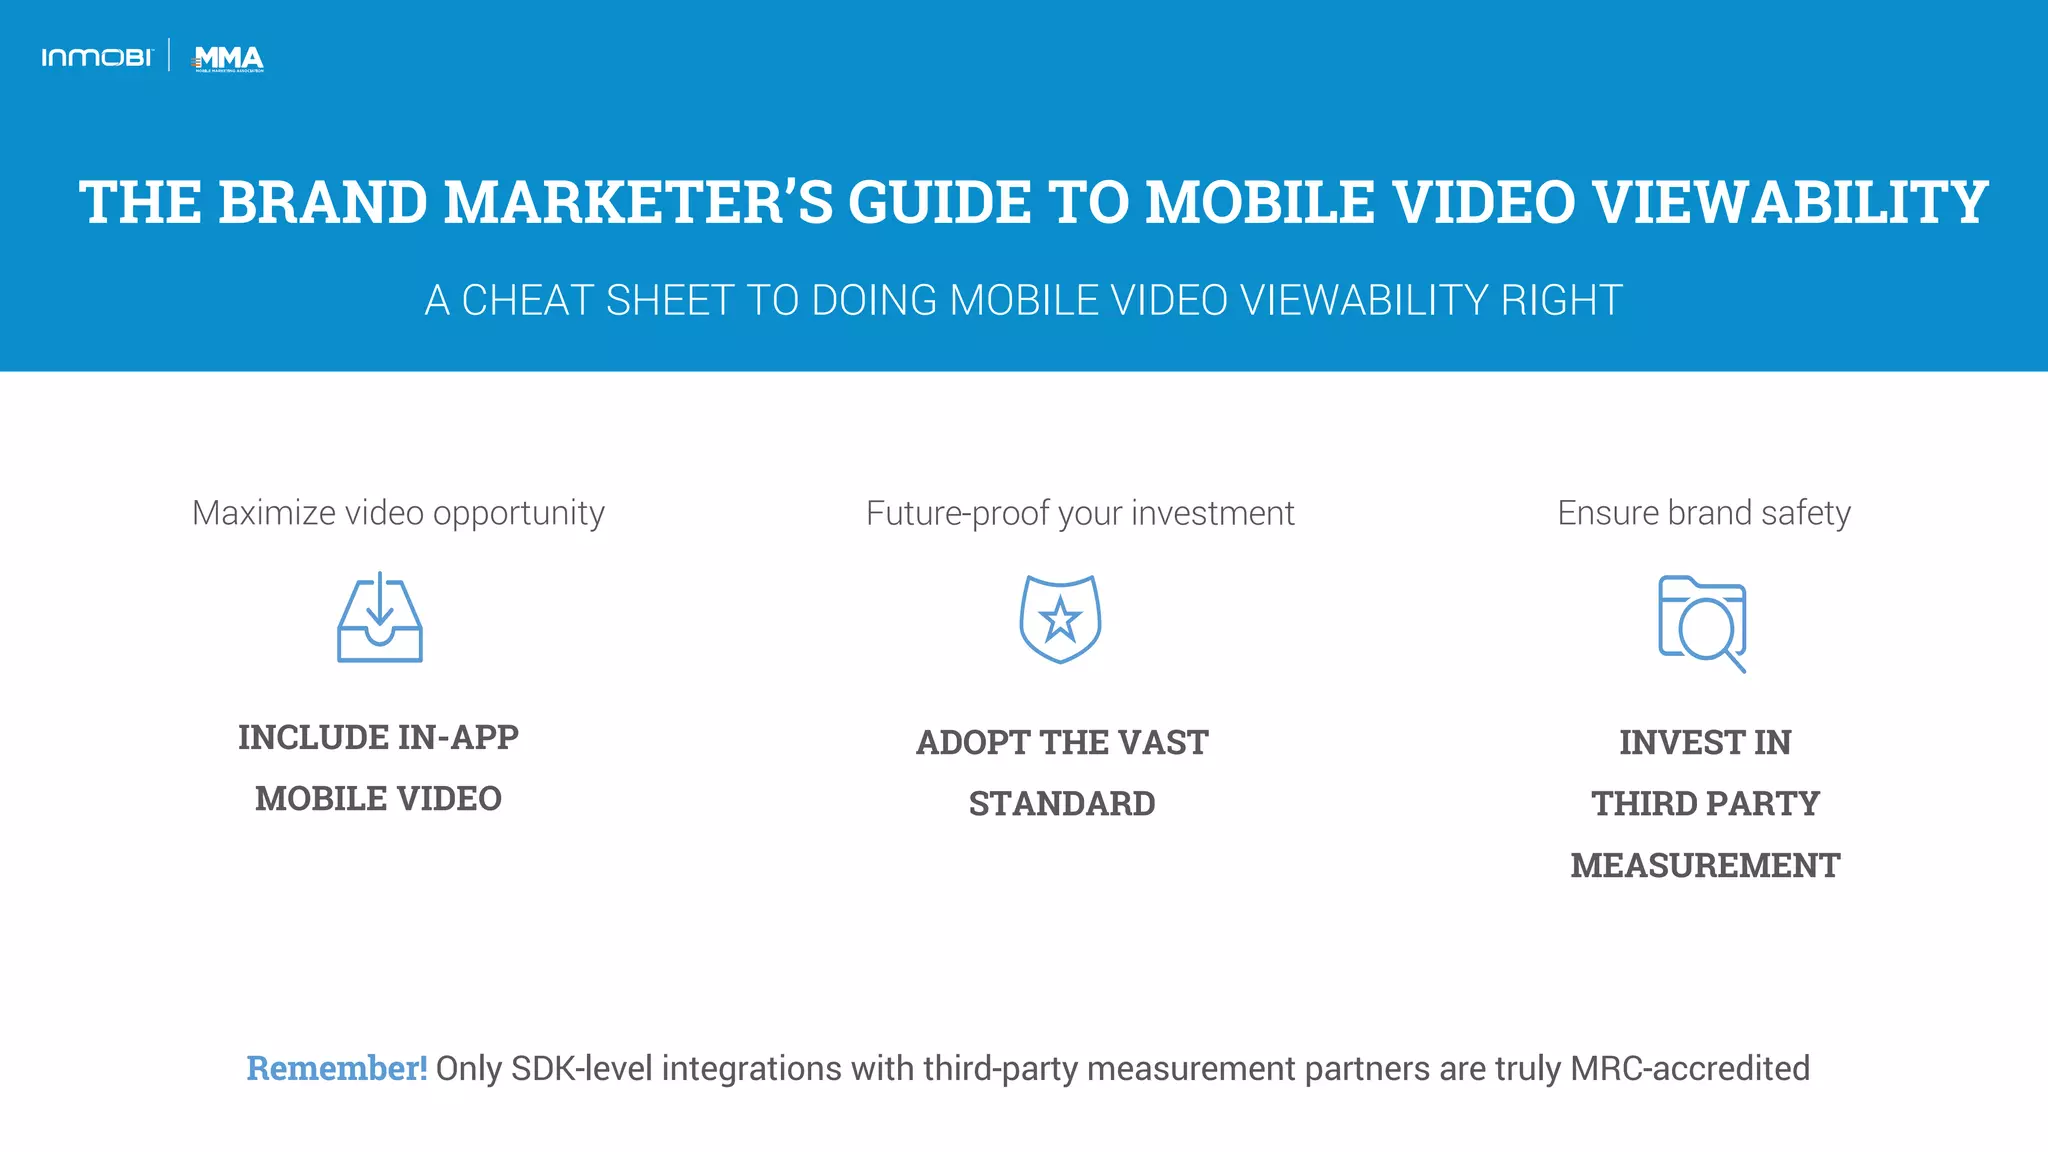


The document discusses the rise of mobile video viewability, highlighting that mobile devices dominate video consumption and advertising spend. It identifies challenges such as poor load speeds, ad clutter, and lack of standards that hinder mobile video ad effectiveness. Solutions include adopting native in-app video experiences, utilizing the VAST standard, and investing in third-party measurement to enhance viewability and consumer experience.


![[Webinar] driving accountability in mobile advertising](https://cdn.slidesharecdn.com/ss_thumbnails/webinardrivingaccountabilityinmobileadvertising-170728022321-thumbnail.jpg?width=640&height=640&fit=bounds)


