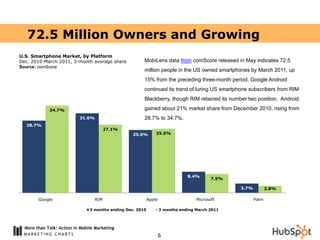
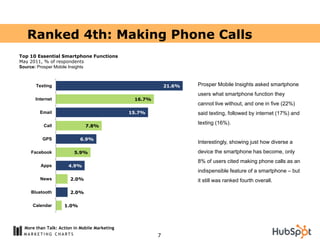
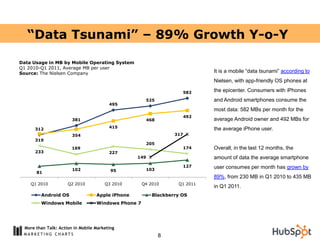
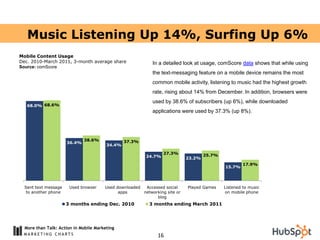
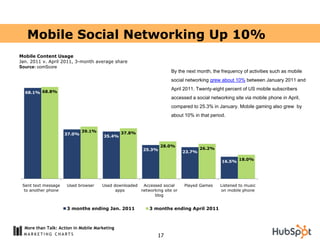
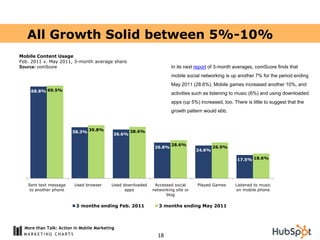
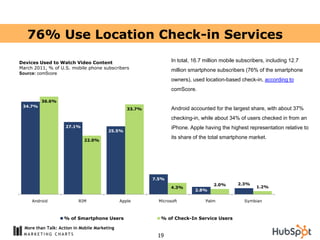
The document discusses mobile marketing trends based on research from various sources. It finds that while making phone calls ranks as the 4th most essential smartphone function, activities like texting, using the internet, and apps are driving significant growth in data usage and time spent on smartphones. Android and iOS are neck-in-neck in market share and desirability. The data shows solid and consistent growth across most mobile activities between 5-10% quarter-over-quarter.
eMarketer Webinar: Social Media Marketing on Mobile DeviceseMarketer
This webinar explores how consumers’ social media usage is shifting, how their social activities differ on the desktop vs. mobile, and what businesses can do to embrace the new opportunities that the mobile environment provides.
TrendsSpotting's 2010 Social Media Influencers - Trend Predictions in 140 Cha...Taly Weiss
"2010 Social Media Influencers" is the first report from the series "2010 Influencers Series: Trend Predictions in 140 Characters".
TrendsSpotting Market Research is now running its third annual prediction reports following major trends in six categories. We will be featuring the predictions of digital and marketing experts on the big changes awaiting us in the coming year.
This year we are adopting a new “tweet style” format, easier for you to focus on, comprehend and forward.
TV and the Second Screen: A Red Bee Media and Decipher white paperMIP Markets
Descriptif du whitepaper
Over the last decade, television has changed beyond recognition. Significant technological advancements have helped to achieve milestone developments such as multichannel TV and digital broadcast, high definition, 3D, on demand, and most recently, new ways for consumers to watch television content through a multitude of connected devices and screens. The consequences of these changes have impacted how and where audiences can access television content – things which have remained largely static until recently.
The most recent evolutionary shift in television, however, has been different: a shift not in where audiences access content, but a shift in what audiences do while they are watching television, brought about by the arrival and proliferation of connected, ‘second screen’ devices.
Decipher and Red Bee Media investigated this change through a research study conducted among both consumers and media industry experts across the UK. We explored the definitions and dynamics of the second screen landscape, assessed audience demand for synchronised, companion experiences, and revealed the opportunities and challenges afforded by the second screen for content creators, broadcasters, platforms and advertisers.
Are you interested in learning more about mobile marketing? If so, then this mobile marketing SlideShare deck is for you. It was compiled by Jamie Turner from the 60 Second Marketer and Jeanne Hopkins while she was at HubSpot.
Here are just some of the amazing facts you'll learn in this SlideShare deck:
• 91% of adults have their mobile devices within arm's reach 24/7
• 25% of Americans only use mobile devices to access the internet
• There are 5 times as many cell phones in the world as there are PCs
If you're interested in learning more about mobile marketing, this deck is for you.
Our analysis of the key trends emerging from the Cannes 2011 Cyber Lions. From Social TV to the rise of HTML 5 to the impact of collaborative storytelling, our view of the trends shaping the best work and likely to impact 2012's winners.
Mobilizing The Shopping Experience: Tips for Building Relevant mCommerce Rela...G3 Communications
This webinar is designed to help retailers move off the sidelines offering how-to tips for:
* Getting started with mobile
* Getting buy-in for mobile apps in the store
Industry analysts have predicted that retailers that get in early and learn what their customers want from their mobile experience will drive the evolutionary curve of mobile shopping. Those who sit on the sidelines watching will quickly find themselves too far behind to catch up with any competitively differentiating capabilities.
Marketers are starting to use the second screen (smartphones, tablets, PCs) to complement the first screen (TV). While it’s still early days—with tactics so far ranging from basic to innovative—this report highlights the potential here for brands, with examples to illustrate.
SMITH presents , "Hospitality Marketing, Trends and Best Practices for 2012." This was presented live by SMITH Vice President Marni Blythe in Shalotte, NC with the NC Brunswick TDA as the sponsor and hosts.
This seminar covers everything from integrated marketing, user generated reviews, mobile marketing, social media marketing, how to measure ROI as well as other helpful statistics that have been aggregated from around the industry. Enjoy!
SMITH is a full service award-winning integrated, contemporary advertising agency based in Fayetteville, NC.
Please visit our website at www.smithadv.com
3.3 Billion active mobile accounts worldwide. That’s 1 phone for every 2 people on the planet. Broadband, “real” web browsing, widgets, social extensions, and streaming television are changing the marketplace, requiring us to write new best practices.
What is SoLoMo, and why is it important for marketers? We explore the reasons why location-based mobile social is gaining momentum all over the world, and share 7 case studies of best-in-class SoLoMo marketing.
The importance of adopting mobile technology in real estate. Mobile technology has changed the way people search for homes. As experts in our field we need to understand the benefits and leverage mobile.
157 Mobile App Stats You Should Know AboutStuart Dredge
More stats about the mobile apps market than you can shake a stick at, including data on app stores, consumer usage of apps, analyst forecasts, and some of the success stories in the apps market. Produced by Mobile Entertainment.
Activate is the strategy consulting firm redefined, and "What Matters" is our look at the ideas that will help companies at the intersection of media, technology and entertainment grow their businesses.
A really quick review of the state of mobile marketing from the Global Head of the Mobile Marketing Association. Slapped together in 2 hours to manage your expectations.
From Hubspot:
Did you know that 20% of US consumers access a social networking site via mobile phone? Or that text-messaging remains the most common mobile activity?
Key Insights from 2011 and What They Mean for the Coming Year
This report examines the mobile and connected device landscape
across the mobile markets measured by comScore – primarily
the United States, United Kingdom, France, Germany, Italy, Spain,
Japan, and Canada – through an exploration of dominant themes
in smartphone adoption growth, mobile media use in areas such as
social networking and retail, platform ecosystem dynamics, and shifts
in multi-device digital media consumption.
Mobile future in focus - ComScore - Février 2012Romain Fonnier
2011 was a pivotal year for the mobile industry, marked by the
dramatic rise of smartphones in the mainstream, the burgeoning of
tablets and other web-enabled connected devices, and a cultural
shift toward cross-platform digital media consumption. With mobile
becoming an increasing part of comprehensive digital marketing
strategies, it becomes more important than ever to understand how
the current trends are shaping the mobile environment, with an eye to
what lies ahead for 2012.
This report examines the mobile and connected device landscape
across the mobile markets measured by comScore – primarily
the United States, United Kingdom, France, Germany, Italy, Spain,
Japan, and Canada – through an exploration of dominant themes
in smartphone adoption growth, mobile media use in areas such as
social networking and retail, platform ecosystem dynamics, and shifts
in multi-device digital media consumption.
ComScore 2012 Mobile Future in Focus (ComScore) -Feb12Retelur Marketing
Motivados por la ola de innovación de los dispositivos digitales y las nuevas plataformas tecnológicas de software, las cuales, los consumidores han adoptado rápidamente, introduciéndolas en sus hábitos de consumo digitales. 2011 marcó un emocionante año para la industria de medios digitales y marcó un año aún más trascendental por delante. (inglés)
2016 Mid Year State of the Mobile IndustryJudd Wheeler
The 2016 Mid-Year State of the Mobile Industry Report dives into stats and reports from January to June 2016. It takes a look at mobile devices, mobile user behaviors, mobile apps, mobile video, mobile advertising, ad blocking, SMS, social media, OTT messaging, email, mobile search, mobile couponing, mobile commerce and payments, mobile's influence in retail, the Internet of Things and wearables.
Explore the customer relationship management role that mobile can play as part of a broader advertising campaign and the mobile operator business transition from communications services to a more holistic client service model. While it is now commonplace for billboards and television commercials to call on viewers to send a text to a short code, the growing popularity of location-based social networking services opens up the possibility of combining the mobile medium and the physical world in much more sophisticated ways
Transcript: Selling digital books in 2024: Insights from industry leaders - T...BookNet Canada
The publishing industry has been selling digital audiobooks and ebooks for over a decade and has found its groove. What’s changed? What has stayed the same? Where do we go from here? Join a group of leading sales peers from across the industry for a conversation about the lessons learned since the popularization of digital books, best practices, digital book supply chain management, and more.
Link to video recording: https://bnctechforum.ca/sessions/selling-digital-books-in-2024-insights-from-industry-leaders/
Presented by BookNet Canada on May 28, 2024, with support from the Department of Canadian Heritage.
Elevating Tactical DDD Patterns Through Object CalisthenicsDorra BARTAGUIZ
After immersing yourself in the blue book and its red counterpart, attending DDD-focused conferences, and applying tactical patterns, you're left with a crucial question: How do I ensure my design is effective? Tactical patterns within Domain-Driven Design (DDD) serve as guiding principles for creating clear and manageable domain models. However, achieving success with these patterns requires additional guidance. Interestingly, we've observed that a set of constraints initially designed for training purposes remarkably aligns with effective pattern implementation, offering a more ‘mechanical’ approach. Let's explore together how Object Calisthenics can elevate the design of your tactical DDD patterns, offering concrete help for those venturing into DDD for the first time!
Key Trends Shaping the Future of Infrastructure.pdfCheryl Hung
Keynote at DIGIT West Expo, Glasgow on 29 May 2024.
Cheryl Hung, ochery.com
Sr Director, Infrastructure Ecosystem, Arm.
The key trends across hardware, cloud and open-source; exploring how these areas are likely to mature and develop over the short and long-term, and then considering how organisations can position themselves to adapt and thrive.
Securing your Kubernetes cluster_ a step-by-step guide to success !KatiaHIMEUR1
Today, after several years of existence, an extremely active community and an ultra-dynamic ecosystem, Kubernetes has established itself as the de facto standard in container orchestration. Thanks to a wide range of managed services, it has never been so easy to set up a ready-to-use Kubernetes cluster.
However, this ease of use means that the subject of security in Kubernetes is often left for later, or even neglected. This exposes companies to significant risks.
In this talk, I'll show you step-by-step how to secure your Kubernetes cluster for greater peace of mind and reliability.
UiPath Test Automation using UiPath Test Suite series, part 3DianaGray10
Welcome to UiPath Test Automation using UiPath Test Suite series part 3. In this session, we will cover desktop automation along with UI automation.
Topics covered:
UI automation Introduction,
UI automation Sample
Desktop automation flow
Pradeep Chinnala, Senior Consultant Automation Developer @WonderBotz and UiPath MVP
Deepak Rai, Automation Practice Lead, Boundaryless Group and UiPath MVP
State of ICS and IoT Cyber Threat Landscape Report 2024 previewPrayukth K V
The IoT and OT threat landscape report has been prepared by the Threat Research Team at Sectrio using data from Sectrio, cyber threat intelligence farming facilities spread across over 85 cities around the world. In addition, Sectrio also runs AI-based advanced threat and payload engagement facilities that serve as sinks to attract and engage sophisticated threat actors, and newer malware including new variants and latent threats that are at an earlier stage of development.
The latest edition of the OT/ICS and IoT security Threat Landscape Report 2024 also covers:
State of global ICS asset and network exposure
Sectoral targets and attacks as well as the cost of ransom
Global APT activity, AI usage, actor and tactic profiles, and implications
Rise in volumes of AI-powered cyberattacks
Major cyber events in 2024
Malware and malicious payload trends
Cyberattack types and targets
Vulnerability exploit attempts on CVEs
Attacks on counties – USA
Expansion of bot farms – how, where, and why
In-depth analysis of the cyber threat landscape across North America, South America, Europe, APAC, and the Middle East
Why are attacks on smart factories rising?
Cyber risk predictions
Axis of attacks – Europe
Systemic attacks in the Middle East
Download the full report from here:
https://sectrio.com/resources/ot-threat-landscape-reports/sectrio-releases-ot-ics-and-iot-security-threat-landscape-report-2024/
Builder.ai Founder Sachin Dev Duggal's Strategic Approach to Create an Innova...Ramesh Iyer
In today's fast-changing business world, Companies that adapt and embrace new ideas often need help to keep up with the competition. However, fostering a culture of innovation takes much work. It takes vision, leadership and willingness to take risks in the right proportion. Sachin Dev Duggal, co-founder of Builder.ai, has perfected the art of this balance, creating a company culture where creativity and growth are nurtured at each stage.
GraphRAG is All You need? LLM & Knowledge GraphGuy Korland
Guy Korland, CEO and Co-founder of FalkorDB, will review two articles on the integration of language models with knowledge graphs.
1. Unifying Large Language Models and Knowledge Graphs: A Roadmap.
https://arxiv.org/abs/2306.08302
2. Microsoft Research's GraphRAG paper and a review paper on various uses of knowledge graphs:
https://www.microsoft.com/en-us/research/blog/graphrag-unlocking-llm-discovery-on-narrative-private-data/
Connector Corner: Automate dynamic content and events by pushing a buttonDianaGray10
Here is something new! In our next Connector Corner webinar, we will demonstrate how you can use a single workflow to:
Create a campaign using Mailchimp with merge tags/fields
Send an interactive Slack channel message (using buttons)
Have the message received by managers and peers along with a test email for review
But there’s more:
In a second workflow supporting the same use case, you’ll see:
Your campaign sent to target colleagues for approval
If the “Approve” button is clicked, a Jira/Zendesk ticket is created for the marketing design team
But—if the “Reject” button is pushed, colleagues will be alerted via Slack message
Join us to learn more about this new, human-in-the-loop capability, brought to you by Integration Service connectors.
And...
Speakers:
Akshay Agnihotri, Product Manager
Charlie Greenberg, Host
The Art of the Pitch: WordPress Relationships and SalesLaura Byrne
Clients don’t know what they don’t know. What web solutions are right for them? How does WordPress come into the picture? How do you make sure you understand scope and timeline? What do you do if sometime changes?
All these questions and more will be explored as we talk about matching clients’ needs with what your agency offers without pulling teeth or pulling your hair out. Practical tips, and strategies for successful relationship building that leads to closing the deal.
Generating a custom Ruby SDK for your web service or Rails API using Smithyg2nightmarescribd
Have you ever wanted a Ruby client API to communicate with your web service? Smithy is a protocol-agnostic language for defining services and SDKs. Smithy Ruby is an implementation of Smithy that generates a Ruby SDK using a Smithy model. In this talk, we will explore Smithy and Smithy Ruby to learn how to generate custom feature-rich SDKs that can communicate with any web service, such as a Rails JSON API.
Knowledge engineering: from people to machines and back
Marketingcharts mobile-marketing-data-2011
1. More than
Talk: Action
in Mobile
Marketing
A Research Collection for Marketers
SPONSORED BY:
D ATA I N S I G H T S
2. More than Talk: Action
in Mobile Marketing
“More than Talk: Action in Mobile Marketing ” is part of Watershed Publishing‟s Data Insights series
featuring trends, data and research. This collection brings together months of surveys, reports and insights
released by nationally recognized research and marketing organizations focused on what is happening with
mobile marketing. It is a time saver for the busy marketing professional.
The charts in this collection are ready to use, download, format, and otherwise support your marketing goals.
Feel free to share the whole presentation or any slide, with your colleagues and business partners, but please
preserve credits to our sponsor, HubSpot, our research partners who provide the source data, and our links to
MarketingCharts.com.
D ATA I N S I G H T S
3. Gone are the days when talking to someone was the prime reason to use a phone. In fact, if you own a
smartphone, chances are you use it far more for things other than calling.
And that‟s big news for marketers.
In “More than Talk: Action in Mobile Marketing” MarketingCharts has amassed a quantity of data that is
invaluable to companies serious about mobile marketing.
The section on Mobile Growth provides all the proof you need about the rising surge of smartphone users.
In Mobile Actions you‟ll find out how these consumers are using their smartphones.
But who are these people? In Mobile People you‟ll get the gender, ethnic and generational breakdowns.
And in the last section on Mobile Marketing, you‟ll find out what everyone is spending trying to reach this fast-
growing audience.
There are 53 data slides and accompanying analysis in this eBook, more than enough current data to support
your mobile marketing efforts.
Enjoy,
The HubSpot team
4. Table of Contents
Mobile Growth Half Make Purchases with a Smartphone 92% of Ad Spend at National Level
72.5 Million Owners and Growing 25% Would Pay for Groceries $100M for Local Mobile Promotions
Ranked 4th: Making Phone Calls Security of Mobile-Pay a Big Concern 43% of Marketers Using Mobile Channel
“Data Tsunami” – 89% Growth Y-o-Y Mobile Browsing In-store Grows 78% 128% Growth in Campaigns over 2 Years
Total Data Costs Drop 43% YOY Smartphone Owners See 5x More Ads
Smartphones: 68% of Impressions Mobile People 30% of Campaigns Focused on Leads
Next Smartphone, Android or iOS? Men Double Mobile Purchasing Y-o-Y Apple iOS Has Double CTR of Android
Android Gets Half of Recent Sales Fewer Women Purchase, Browse 26% Drive to App Downloads
Overall, Android Lead is Smaller Both Genders Clicking More Ads Mobile-Social Action Mix Up 39% M-o-M
Apple iOS Has More Share of All Devices Hispanics Have Higher Mobile Use SocNet Convergence Higher from Twitter
Breakdown of Non-Computer Traffic Hispanics Search More via Mobile Targeted Ads Up; Local at 56%
Music Listening Up 14%, Surfing Up 6% Growing Up Digital, Kids Impact Usage Impressions: Android– 53%, iOS– 28%
Mobile Social Networking Up 10% Families, Young Adults Equal Boomers By Branded Carrier, Verizon Has 19%
All Growth Solid between 5%-10% Mobile Shoppers are Young, Wealthy By Manufacturer, Apple Has 33%
76% Use Location Check-in Services Young React More Frequently to Ads
Video Phone Viewing Equal with In-Car 61% of m-Retail Shoppers are under 35 Sponsors and Partners
13.1 Million Mobile Consumers
Mobile Actions Younger Shoppers Recommend via SMS About HubSpot
123% Growth in Mobile Purchasing Our Data Partners
Mobile Banking, Navigation to Grow Mobile Marketing
Sponsorship Information
Device “Look” and Brand are Influential Marketing Spend to Reach $56.5 Billion
Tablets Users are Online Shoppers Local Mobile Ads: 51% Share by 2015
Tablet Owners Make More Purchases 1,342% Growth in Retail, Restaurants
6. 72.5 Million Owners and Growing
U.S. Smartphone Market, by Platform
Dec. 2010-March 2011, 3-month average share MobiLens data from comScore released in May indicates 72.5
Source: comScore
million people in the US owned smartphones by March 2011, up
15% from the preceding three-month period. Google Android
continued its trend of luring US smartphone subscribers from RIM
Blackberry, though RIM retained its number two position. Android
34.7% gained about 21% market share from December 2010, rising from
31.6% 28.7% to 34.7%.
28.7%
27.1%
25.0% 25.5%
8.4%
7.5%
3.7% 2.8%
Google RIM Apple Microsoft Palm
3 months ending Dec. 2010 3 months ending March 2011
More than Talk: Action in Mobile Marketing
6
7. Ranked 4th: Making Phone Calls
Top 10 Essential Smartphone Functions
May 2011, % of respondents
Source: Prosper Mobile Insights
Texting 21.6% Prosper Mobile Insights asked smartphone
users what smartphone function they
Internet 16.7%
cannot live without, and one in five (22%)
Email 15.7% said texting, followed by internet (17%) and
texting (16%).
Call 7.8%
GPS 6.9%
Interestingly, showing just how diverse a
Facebook 5.9% device the smartphone has become, only
8% of users cited making phone calls as an
Apps 4.9%
indispensible feature of a smartphone – but
News 2.0% it still was ranked fourth overall.
Bluetooth 2.0%
Calendar 1.0%
More than Talk: Action in Mobile Marketing
7
8. “Data Tsunami” – 89% Growth Y-o-Y
Data Usage in MB by Mobile Operating System
Q1 2010-Q1 2011, Average MB per user
Source: The Nielsen Company It is a mobile “data tsunami” according to
Nielsen, with app-friendly OS phones at
582 the epicenter. Consumers with iPhones
525 and Android smartphones consume the
495
most data: 582 MBs per month for the
492
381 468 average Android owner and 492 MBs for
415
312 the average iPhone user.
354 317
319
205
169 174 Overall, in the last 12 months, the
233 227
149 amount of data the average smartphone
127 user consumes per month has grown by
102 95 103
81
89%, from 230 MB in Q1 2010 to 435 MB
Q1 2010 Q2 2010 Q3 2010 Q4 2010 Q1 2011
in Q1 2011.
Android OS Apple iPhone Blackberry OS
Windows Mobile Windows Phone 7
More than Talk: Action in Mobile Marketing
8
9. Total Data Costs Drop 43% YOY
Smartphone Data: Effective Cost per MB
Q1 2010-Q1 2011, Total data charge/Data consumption
Source: The Nielsen Company
Perhaps more importantly, the
amount the average smartphone
user pays per unit of data has
$0.14
$0.13 dropped by 43% percent in the last
year, from 14 cents per megabyte
$0.10 (MB) to 8 cents per MB, according
$0.09
$0.08 to The Nielsen Company.
Even as data usage has almost
doubled, most users are paying
around what they did a year ago
for data – meaning a lower cost
per unit of data consumed.
Q1 2010 Q2 2010 Q3 2010 Q4 2010 Q1 2011
More than Talk: Action in Mobile Marketing
9
10. Smartphones: 68% of Impressions
Connected Device, Category Mix
April 2011, % share
Source: Millennial Media
Combining smartphones, feature phones and connected
devices, Millennial Media finds that smartphones
accounted for more than two in three mobile impressions
16%
onto the Millennial mobile advertising network in May
2011. Feature phones (17%) and connected devices
(16%) were responsible for virtually equal shares.
16% 68%
Within connected devices, mobile gaming devices and
MP3 players combined to generate 70% of the
connected device impressions, and tablets accounted
for another 29%.
Smartphones Feature Phones
Connected Devices
More than Talk: Action in Mobile Marketing
10
11. Next Smartphone, Android or iOS?
Desired OS of Next Smartphone
2010 v. 2011, % of consumers who plan to
purchase new smartphone Nielsen data shows that Android has taken the lead on Apple iOS as
Source: The Nielsen Company
the most desired OS for consumers planning on getting a new
smartphone in the next year. 31% of consumers desire the Android
OS, narrowly beating the 30% who want iOS. About one-fifth remain
33% unsure.
31%
30%
26%
20%
18%
12%
11%
7%
6%
2% 1%
Android iOS RIM BlackBerry Microsoft Windows Palm/WebOS Not sure
Mobile
July-Sept. 2010 Jan.-Mar 2011
More than Talk: Action in Mobile Marketing
11
12. Android Gets Half of Recent Sales
U.S. Smartphone Market Share, Recent Acquires
March 2011, % of US mobile phone subscribers
Source: The Nielsen Company
Nielsen analysis indicates the dynamics around
1% desired future smartphone OS are already translating
2%
3%
into sales. Half of those surveyed in March 2011 who
7% 15% indicated they had purchased a smartphone in the past
six months said they had chosen an Android device.
Another quarter of recent acquirers said they bought
an iPhone and 15% said they had picked a Blackberry
24%
phone.
48%
RIM Blackberry OS Apple iPhone OS
Android OS Microsoft Windows Mobile
Linux Palm OS
Symbian OS
More than Talk: Action in Mobile Marketing
12
13. Overall, Android Lead is Smaller
U.S. Smartphone Market Share
March-May 2011, % of US mobile phone subscribers
Source: The Nielsen Company When Nielsen measures market share according to all mobile
phone subscribers, Android continues to be the most popular
smartphone OS with 38% percent of smartphone consumers
2% 2% 1% owning Android devices, Apple iPhone that has shown the most
2%
growth recently.
9%
37% Android OS
Apple iPhone OS
21% RIM Blackberry OS
Windows Mobile
Other
Windows 7
Symbian OS
Palm / Web OS
26%
More than Talk: Action in Mobile Marketing
13
14. Apple iOS Has More Share of All Devices
Apple iOS v. Android OS across All Mobile Devices
December-February 2011, Total base (000) / % of subscribers
Source: comScore Despite the Android lead in smartphone market
share, when examining the total reach of the Apple
iOS platform, which resides on iPhones, iPads and
iPod Touches, the combined platform reach of 37.9
234,000
million among all US mobile phones, tablets and
other such connected media devices, outreaching
the Android platform by 59%.
Android platform has almost 23.8 million users
across all devices. In addition, 14.2% of iPad users
had Android phones.
16.2%
10.2%
This report from comScore released in April
37,868
23,763 measured the two platforms across three months.
Total subscribers Apple iOS Android OS
More than Talk: Action in Mobile Marketing
14
15. Breakdown of Non-Computer Traffic
U.S. Non-Computer Device Traffic
May 2011, % share
Source: comScore A new service reporting on digital traffic by device,
– including mobile phones, tablets, music players,
e-readers, gaming devices, and other web-enabled
devices – was launched by comScore in June. The
35.6%
report aims to show activity of all mobile and non-
computer devices by category.
23.5%
21.8%
7.8%
6.7%
2.4%
1.5%
0.6% 0.1%
iPad Android Other tablet iPhone Android Other Feature iPod Touch Other
tablet Smartphone Phone
More than Talk: Action in Mobile Marketing
15
16. Music Listening Up 14%, Surfing Up 6%
Mobile Content Usage
Dec. 2010-March 2011, 3-month average share In a detailed look at usage, comScore data shows that while using
Source: comScore
the text-messaging feature on a mobile device remains the most
common mobile activity, listening to music had the highest growth
rate, rising about 14% from December. In addition, browsers were
used by 38.6% of subscribers (up 6%), while downloaded
68.0% 68.6%
applications were used by 37.3% (up 8%).
38.6% 37.3%
36.4%
34.4%
27.3% 25.7%
24.7% 23.2%
17.9%
15.7%
Sent text message Used browser Used downloaded Accessed social Played Games Listened to music
to another phone apps networking site or on mobile phone
blog
3 months ending Dec. 2010 3 months ending March 2011
More than Talk: Action in Mobile Marketing
16
17. Mobile Social Networking Up 10%
Mobile Content Usage
Jan. 2011 v. April 2011, 3-month average share
Source: comScore
By the next month, the frequency of activities such as mobile
social networking grew about 10% between January 2011 and
April 2011. Twenty-eight percent of US mobile subscribers
68.1% 68.8%
accessed a social networking site via mobile phone in April,
compared to 25.3% in January. Mobile gaming also grew by
about 10% in that period.
39.1% 37.8%
37.0%
35.4%
28.0%
25.3% 26.2%
23.7%
16.5% 18.0%
Sent text message Used browser Used downloaded Accessed social Played Games Listened to music
to another phone apps networking site or on mobile phone
blog
3 months ending Jan. 2011 3 months ending April 2011
More than Talk: Action in Mobile Marketing
17
18. All Growth Solid between 5%-10%
Mobile Content Usage
Feb. 2011 v. May 2011, 3-month average share
Source: comScore In its next report of 3-month averages, comScore finds that
mobile social networking is up another 7% for the period ending
May 2011 (28.6%). Mobile games increased another 10%, and
68.8% 69.5%
activities such as listening to music (6%) and using downloaded
apps (up 5%) increased, too. There is little to suggest that the
growth pattern would ebb.
38.3% 39.8% 38.6%
36.6%
28.6%
26.8% 26.9%
24.6%
17.5% 18.6%
Sent text message Used browser Used downloaded Accessed social Played Games Listened to music
to another phone apps networking site or on mobile phone
blog
3 months ending Feb. 2011 3 months ending May 2011
More than Talk: Action in Mobile Marketing
18
19. 76% Use Location Check-in Services
Devices Used to Watch Video Content In total, 16.7 million mobile subscribers, including 12.7
March 2011, % of U.S. mobile phone subscribers
million smartphone subscribers (76% of the smartphone
Source: comScore
owners), used location-based check-in, according to
comScore.
36.6%
34.7%
33.7% Android accounted for the largest share, with about 37%
checking-in, while about 34% of users checked in from an
27.1% iPhone. Apple having the highest representation relative to
25.5%
its share of the total smartphone market.
22.0%
7.5%
2.0% 2.3%
4.3% 1.2%
2.8%
Android RIM Apple Microsoft Palm Symbian
% of Smartphone Users % of Check-In Service Users
More than Talk: Action in Mobile Marketing
19
20. Phone Video Viewing Equal with In-Car
Devices Used to Watch Video Content
May 2011, % of U.S. households
Source: Consumer Electronics Association While television remains the most popular
device for video content by a large margin,
cell phones and smartphones are
93%
currently used to watch video by 13% of
households, on equal footing with car
video entertainment, according to the
Consumer Electronics Association (CEA).
49%
It is worth noting that 31% of households
view free video content on YouTube, and
13% 13% 11% another 27% use free online video
providers such as Hulu.
Television Computer (any Car video Cell phone or MP3 player
type) entertainment smartphone
More than Talk: Action in Mobile Marketing
20
22. 123% Growth in Mobile Purchasing
Consumer Trend in Mobile Purchases
2009-2010, % of consumers making 1 or more m-purchase Oracle and ATG research finds that three in
Source: Oracle / ATG
10 (29%) US consumers have made at
least one purchase via mobile device --
123% more than the 13% of consumers in
41%
40%
November 2009.
29% 40% of consumers age 18-34 had made a
27%
mobile purchase as of December 2010, up
23% 23% 23%
74% from 2009. 27% of 34-54-year-old
17% consumers had made a mobile purchase
13% as of December 2010, an increase of 145%
11%
9%
7%
from 11% 13 months earlier.
November 2009 July 2010 December 2010 While only 17% of consumers 55 and older
had made a mobile purchase in 2010, it‟s
18-34 35-54 55 and older Overall
up 142% from 7% recorded in 2009.
More than Talk: Action in Mobile Marketing
22
23. Mobile Banking, Navigation to Grow
Consumer Mobile Platform Activities
2010 v. 2011, % of respondents
Source: TNS Mobile Life
Download ringtones 29 26
Download caller tunes 24 23
Download graphics 23 22
Download music 21 22
Download apps 16 20
Download games 17 19 Mobile social networking, along with
Social networking 12 19 banking and navigation, are poised
Stream music 17
for strong year-over-year global
Watch social video 10 15
Mobile banking 9 14 growth in 2011, according to a white
Navigation 8 13 paper from TNS Mobile Life. from
Location services 9 12
“The Holistic Portfolio” indicates the
Blogging 8 12
Download TV/video 11 12
percentage of global mobile
Watch TV live 9 12 subscribers performing social
Subscriptions 9 12
networking should rise about 58%
Stream TV/video 11
Mobile wallet 6 10
this year, from 12% to 19%.
Speech to text 9
2010 2011
More than Talk: Action in Mobile Marketing
23
24. Device “Look” and Brand are Influential
Mobile Purchase Influencers in Mature Markets
May 2011, % of respondents
Source: TNS Mobile Life
The TNS report also found that across
Brand of handset 44%
global markets, headset brand is considered
an important purchase factor by the highest
Model of handset 38%
percentage of consumers. In developing
Look and feel of
device
53% markets, the brand had much more
importance -- cited by 86% of consumers in
Operating system 32%
emerging Tier II markets and 70% of
Input method 41% consumers in emerging Tier I markets.
Access new
features/services
31%
Only 44% of consumers in mature markets
Accessories available 19% consider this a top criteria. Consumers in
Brand of network mature markets are more likely to consider
provider
27%
look and feel of device, with 53% indicating
Content and
applications
32% that this is a top purchase influencer.
More than Talk: Action in Mobile Marketing
24
25. Tablets Users are Online Shoppers
Online Shopping via Mobile Device
May 2011, % of respondents A study from the etailing group and Coffee Table, “The „Shopping Mindset‟ of the
Source: etailing/Coffee Table
Mobile Consumer,” indicates that tablet users are more likely than smartphone
users to engage in online buying and/or browsing on a daily, weekly, several
times per month, and monthly basis than smartphone users.
25%
24%
19% 19%
17%
16%
15%
12%
11%
10% 10%
9%
7%
6%
Daily Weekly Several times per Once a month 4 or more times Less than 4 times Never
month per year per year
Smartphone Tablet
More than Talk: Action in Mobile Marketing
25
26. Tablet Owners Make More Purchases
Online Purchases via Mobile Device
May 2011, % of respondents making a purchase in past six months
Source: etailing/Coffee Table
Tablet users are more likely than smartphone users to say they have made
three to five, six to 10, and more than 10 online purchases in the last six
months. Smartphone users are slightly more likely to have made one
purchase in the last six months and 64% more likely to have made no online
purchases (36% compared to 22%).
39%
36%
30%
22%
18%
15%
12% 12%
9%
7%
None 1 2-5 6-10 >10
Smartphone Tablet
More than Talk: Action in Mobile Marketing
26
27. Half Make Purchases with a Smartphone
Consumer Smartphone Usage
May 2011, % of respondents
Source: Prosper Mobile Insights
81% of smartphone users have used their
Texting 21.6%
smartphone to browse or look for products
Internet 16.7% or services and 50% have made a
Email 15.7% purchase with their smartphone, according
to research from Prosper Mobile Insights.
Call 7.8%
Additional marketing-based activities are
GPS 6.9% even more popular, including receiving
special offers by text message (54%) or
Facebook 5.9%
scanning a QR code, about 58%.
Apps 4.9%
News 2.0%
Bluetooth 2.0%
Calendar 1.0%
More than Talk: Action in Mobile Marketing
27
28. 25% Would Pay for Groceries
Smartphone as Payment System
Q1 2011, % of respondents
Source: Compete
The adoption of NFC-equipped (near field
communication) mobile phone will
substitute for the use of a credit card or
debit card. Twenty-five percent of
25%
consumers said they would be likely to buy
21% groceries via mobile phone, according to
20%
19%
Compete data.
14% 14%
Respondents would also buy clothes
(21%), pay a bill (20%) or buy a coffee
(19%).
Groceries Clothes Phone bill at Coffee Sofa at Taxi ride
at at retailer a wireless at local shop a furniture
supermarket store store
More than Talk: Action in Mobile Marketing
28
29. Security of Mobile-Pay a Big Concern
Smartphone as Payment System
Q1 2011, % of respondents
Source: Compete
Use my mobile phone for
58%
communication only Consumers who said they were not likely to
use their phone for payments cited personal
Concerned about security 56%
preferences and concerns about security as
Concerned about losing phone
and someone else accessing 52% reasons. 58% preferred to only use their
my bank account
mobile phone for communication (calls, email,
Concerns about hidden fees 39% or text) while 56% indicated they were
concerned with the security of using the
Concerns about a dead battery
27%
meaning no payments phone for payments (more than one answer
permitted) and 52% were concerned about
Preference to pay with cash 26%
security if they lost their phone.
Not sure if I will need a data
21%
plan to use the technology
I do not carry mobile
17%
phone at all times
More than Talk: Action in Mobile Marketing
29
30. Mobile Browsing In-store Grows 78%
In-store Mobile Product Browsing
2009-2010, % of US consumers Overall, the percentage of US consumers who use mobile devices to browse
Source: Oracle / ATG
and research products while in a physical store grew 78% from 2009 to 2010.
48% of consumers browsed and researched products via mobile in 2010,
compared to 27% in 2009. The activity is more popular with younger consumers
were more apt to browse and research in-store, although older consumers had
a higher year-over-year growth rate.
60%
55%
48%
44%
41%
39%
36% 37%
27%
23% 22%
19%
18-34 35-54 55 and older Overall
Nov. 2009 July 2010 Dec. 2010
More than Talk: Action in Mobile Marketing
30
32. Men Double Mobile Purchasing Y-o-Y
Mobile Purchases by Men
2009-2010, % of men making 1 or more m-purchase
Source: Oracle / ATG
32% of men had made a mobile purchase in December
32%
29% 2010, double the 16% who had done so in 2009. A
substantial portion of this growth had occurred by July
16%
2010, when 29% of men had made a mobile purchase.
in-store in December 2010, compared to 27% in
November 2009 July 2010 December 2010
November 2009.
Mobile Browsing by Men Oracle/ATG found that men actually browsed and
Source: Oracle / ATG
researched products via mobile device while in-store at a
rate slightly higher (51%) than the overall average in
51%
45% December 2010. In November 2009, 30% of men
30% performed this activity, giving them a 70% growth rate
about 10% below the overall average.
November 2009 July 2010 December 2010
More than Talk: Action in Mobile Marketing
32
33. Fewer Women Purchase, Browse
Mobile Purchases by Women
2009-2010, % of women making 1 or more m-purchase
Source: Oracle / ATG
While a smaller percentage of women than
26% men had made a mobile purchase as of
December 2010 – only 26% compared to 32%
16%
of men -- their growth rate since 2009 was
10%
higher at 160%.
November 2009 July 2010 December 2010
The December 2010 in-store browsing rate
among women (44%) was almost 10% lower
Mobile Browsing by Women
Source: Oracle / ATG than the overall average. However, women‟s
growth rate in this activity since November
44%
2009 was about 83%, slightly ahead of the
30% overall growth rate.
24%
November 2009 July 2010 December 2010
More than Talk: Action in Mobile Marketing
33
34. Both Genders Clicking More Ads
Mobile Ad CTR, by Gender, Income
April-May 2011, % of total users Data from Jumptap‟s STAT report suggests that while its network reaches an even
Source: Jumptap
split of men and women, men are more likely to click on ads. Click-through for both
genders increased by about 5% since last month. Not surprisingly, household
income has the most impact on mobile ad click-through rates.
1.01%
0.83%
0.50%
0.47%
0.37%
0.32%
0.29% 0.31%
Male Female Under $50K Over $50K
CTR April data CTR May data
More than Talk: Action in Mobile Marketing
34
35. Hispanics Have Higher Mobile Use
Mobile Device Use by Hispanics
April 2011, % of respondents, n=24,754 A report from BIGresearch
Source: BIGresearch
Simultaneous Media Usage (SIMM17)
finds that Hispanic US adults are more
4% 6% likely to regularly use several new
3%
5% 4%
22% mobile devices than overall adults. For
9%
37%
example, 18.6% of Hispanic adults use
11%
42% 73% a Blackberry, 37% more than the
13%
52% 13% 13.6% of overall adults who do so.
10%
32%
Hispanic adults are also 59% more
13%
28% likely than overall adults to use an iPad
45%
29% 13% (7.8% compared to 4.9%). Other
23%
12% 7%
5% regular use discrepancies exist in
Email: Email: Non- Facebook: Facebook: Non- Twitter: usage rates of iPhones (Hispanics 59%
Smartphone smartphone Smartphone smartphone Smartphone
owners owners owners owners owners more likely to regularly use) and Droids
(Hispanics 64% more likely to use).
Constantly during the day Daily Weekly Less often Never
More than Talk: Action in Mobile Marketing
35
36. Hispanics Search More via Mobile
Mobile Device Use for Internet Search
April 2011, % of respondents, n=24,754
Source: BIGresearch
About one-quarter (26.3%) of Hispanic
adults regularly search the internet via
cell phone, 78% more than the 14.8% of
26.3%
overall adults.
In addition, a 73% difference exists in
16.8% regular use of Droid for internet search.
14.8%
13.5%
And while only 7.6% of Hispanic adults
12.8%
regularly use an iPad for internet
9.6%
7.8% 8.0% search, that figure is still 65% higher
7.6%
than the 4.6% of overall adults. Large
4.6%
discrepancies also exist in rates of
iPhone iPad Droid Cell phone Blackberry using iPhone and Blackberry devices for
% of adults % of Hispanics internet search.
More than Talk: Action in Mobile Marketing
36
37. Growing Up Digital, Kids Impact Usage
Internet Use by Household Income
April 2011, % of households High income US households represent a larger
Source: The Nielsen Company
percentage of the overall US internet universe,
according to “The New Digital American Family” from
Nielsen. Households earning $75,000 or more in
17%
16% annual income represent 17% of the internet
universe, a figure 30% larger than the 13% of total
13% US population they represent.
12%
11%
Interestingly, middle class households with children
8%
younger than 18 earning $50,000 to $74,999 also use
more internet. They constitute 11% of the internet
universe, a 37.5% larger figure than the 8% of the
total US population they represent. Households with
children younger than 18 earning less than $50,000
<$50,000 $50,000-$74,000 $75,000+
annually use the internet at a 33% higher rate than
% of US population % of US internet universe
their share of US population (16% compared to 12%).
More than Talk: Action in Mobile Marketing
37
38. Families, Young Adults Equal Boomers
Current Family Marketplace
April 2011, % of households
Source: The Nielsen Company
Overall, Nielsen finds that one-third of households
have children.
And while the largest single share of the US family
33.6%
marketplace is comprised of Baby Boomers and
49.3% older generations (born in 1964 or earlier) without
children -- who represent 49% of all households –
the “wired with children” set and the young adults
who have not yet (presumably) settled down, make
17.2% up a slightly bigger share of the US marketplace.
Baby Boomer & older, no kids
Generation X & younger, no kids
Households with kids
More than Talk: Action in Mobile Marketing
38
39. Mobile Shoppers are Young, Wealthy
Mobile Retail Users, by Income
2010 Study, % of audience In terms of mobile impact and adoption of
Source: Millennial Media, comScore
what‟s new, mobile retail users skew
34% younger and wealthier than the general
mobile audience, according to data from
“Mobile Intel Series: Retail” from
27%
Millennial Media and comScore.
23%
21%
20%
18% 34% of mobile retail users earn $100,000
16% 16%
15% or more annually, and 18% of mobile
users earn $75,000 to $99,000.
11%
About the same percentage of mobile
retail users (21%) as overall mobile users
<$25K $25K to $50K $50K to $75 $75K to <$100K $100K+ (20%) earns $50,000 to $74,000. Below
Total mobile audience Mobile retail users this income bracket, overall mobile users
have a larger share.
More than Talk: Action in Mobile Marketing
39
40. Young React More Frequently to Ads
Reaction to Mobile Advertising, by Age
Q1 2011, % of audience
Source: The Nielsen Company
Mobile advertising is increasingly
Age 13-
13% 45% 42% finding its way into mobile apps, and
17
currently teenagers are much more
Age 18- receptive than their elders.58% of
6% 40% 54%
24
teens say they “always” or
sometimes” look at mobile ads,
Age 25-
8% 35% 57% according to Nielsen‟s "State of the
34
Media: Trends in Advertising Spend
Age 35- and Effectiveness, Q1 2011."
7% 35% 58%
44
Age 1% 27% 72%
55+
I always look at it I sometimes look at it I never look at it
More than Talk: Action in Mobile Marketing
40
41. 61% of m-Retail Shoppers are under 35
Mobile Retail Users, by Age
2010 Study, % of audience
Source: Millennial Media, comScore
The highest percentage of mobile retail
users, 36%, are between the ages of
36% 25-34, while 22% of mobile retail users
are 18-24, and 5% are 13-17. In total,
almost two-thirds (63%) of mobile retail
users are younger than 35.
22%
21%
18% 18% 18%
13% 13%
12%
11%
8%
5% 2%
4%
13-17 18-24 25-34 35-44 45-54 55-64 65+
Total mobile audience Mobile retail users
More than Talk: Action in Mobile Marketing
41
42. 13.1 Million Mobile Consumers
Mobile Retail Users, by Access Method
2010 Study, Audience in millions
Source: Millennial Media, comScore
In total, 13.1 million consumers perform
mobile retail. Of those, almost 63% (8.2
million) use their mobile browser. Another
13.1
32% (4.2 million) use SMS text messaging,
while 24% (3.2 million) use an app. About
42% use mobile devices for research.
8.2 Actual purchasing via mobile devices is
performed by 38% of mobile consumers,
while 29% do comparison shopping.
4.2
3.2
Total Browser SMS App
More than Talk: Action in Mobile Marketing
42
43. Younger Shoppers Recommend via SMS
Method of Product Recommendation The Colloquy 2011 “Word of Mouth” study found that how shoppers
2011 Study, % of respondents
Source: Colloquy communicate is impacted by mobile devices. 58% of young adults
recommend products via social networking communities while 35% of the
general population do so. A lower percentage of young adults (48%)
84%
recommends products via SMS mobile messaging, but this figure is about
77% 150% more than the 19% of the general population.
70%
58%
56%
53%
50% 50%
48%
36% 35% 36%
22%
19% 18% 19% 19%
17%
14% 14%
12%
5%
Face-to-face Email Landline Cell phone SocNets Instant Mobile Company Product Personal Microblog
messenger messaging website reviews/ blogs
Shopping
sites
Young adults General Population
More than Talk: Action in Mobile Marketing
43
45. Marketing Spend to Reach $56.5 Billion
U.S. Mobile Marketing Spend
2010 v. 2015, US$ millions The total amount of money spent by US
Source: Mobitrove
marketers on mobile advertising and promotions
will reach about $56.5 billion by 2015, according
$40,731
to Mobitrove. That expected figure is more than
six times the almost $9.3 billion spent on mobile
advertising and promotions in 2010.
By 2015, Mobitrove forecasts total US mobile
$15,795 marketing spend will be tilted even more in favor
of advertising. Projections indicate mobile
advertising spend will reach close to $41 billion,
$3,002
$6,272 while mobile promotions spend will only total
about 15.8 billion. This means marketers will
2010 2015
spend about 2.5 times as much on mobile
Advertising Promotions advertising in 2015.
More than Talk: Action in Mobile Marketing
45
46. Local Mobile Ads: 51% Share by 2015
Local vs. National Ad Spend in Mobile
2010-2015, US$ billions
Source: BIA/Kelsey
In a more conservative forecast,
BIA/Kelsey says that total US mobile ad
spending will grow from $790 million in
2010 to $4 billion in 2015. The local
portion of that total is projected to
$2.84
increase from $404 million to $2.8 billion.
$2.03
Among the drivers of mobile ad revenue
$1.40
growth are smartphone penetration,
$0.99
$0.89 mobile web usage and related increases
$0.40 $1.22
$0.92 in ad inventory.
$0.61 $0.73
$0.39 $0.49
2010 2011 2012 2013 2014 2015
National Local
More than Talk: Action in Mobile Marketing
46
47. 1,342% Growth in Retail, Restaurants
Verticals Growth in Mobile Campaigns
Q1 2010 v. Q1 2011, % growth
Source: Millennial Media Six verticals experienced triple-digit growth – or greater – year-over-year
according to Millennial Media's Q1 2011 report released in June.
1342% Health: Fitness & Wellness is a newcomer on a ranking of top advertising
verticals. This is an indication that advertisers in new verticals are starting
to take a keen interest and to heavily invest in creating a mobile presence.
723%
379%
242%
183%
130%
Retail & Automotive Finance Telecomm Health: Fitness Education
Restaurants & Wellness
More than Talk: Action in Mobile Marketing
47
48. 92% of Ad Spend at National Level
U.S. Mobile Marketing: Advertising
2010 Totals, US$ millions
Source: Mobitrove
Looking at total US mobile advertising spend
$6,272
in 2010, it becomes clear that last year,
$5,767 marketers focused the vast majority of their
dollars on national campaigns. Out of roughly
$6.3 billion spent in total, about $5.8 billion
was allocated toward national advertising and
only about $500 million on local advertising.
This means roughly 92% of all mobile
$505 advertising dollars were spent at a national
level.
Local National Total
More than Talk: Action in Mobile Marketing
48
49. $100M for Local Mobile Promotions
U.S. Mobile Marketing: Promotions
2010 Totals, US$ millions
Source: Mobitrove
Total US mobile promotional spend in
$3,002 2010 shows an even more pronounced
$2,897
focus on national, rather than local,
campaigns. Almost $2.9 billion of $3
billion was spent on national
promotions. This means about 97% of
mobile promotional dollars spent in
2010 went toward national campaigns.
$106
Local National Total
More than Talk: Action in Mobile Marketing
49
50. 43% of Marketers Using Mobile Channel
Mobile Marketing Adoption
May 2011, % of respondents
Source: Unica 43% of marketers currently use mobile technology, according to
a study from Unica, “The State of Marketing 2011.” Another
25% plan to do so within the next 12 months, and 16% plan to
do so in more than 12 months. Only 15% of marketers have no
43%
plans to use mobile technology.
25%
16% 15%
Current activity Planned activity Planned activity No plans
(next 12 months) (>12 months)
More than Talk: Action in Mobile Marketing
50
51. 128% Growth in Campaigns over 2 Years
Category Share in Mobile Display Ads
3-month average share ending March 2011, US mobile subscribers
Source: comScore
Research from comScore estimates that
689 advertisers used mobile display
advertising campaigns to reach
Used Browser 19.1%
consumers, up 128% from two years prior.
Mobile content and publishing contributed
Used App 15.9%
to half of all products advertised on mobile
device. 26% of mobile display
advertisements were for consumer
Saw ad on web discretionary goods, IT accounted for 7%,
5.0%
or within App
and financial services accounted for 6% of
mobile display ads.
Responded to SMS
3.5%
ad
More than Talk: Action in Mobile Marketing
51
52. Smartphone Owners See 5x More Ads
Smartphone, Feature Phone Service Penetration
3-month average share ending March 2011, US mobile subscribers
Source: comScore
Smartphone users were also far more likely to see
web or in app ads (27.5% compared to 5% of
85.0% feature phone users) due to their heavier usage of
82.3%
mobile browsers and applications. Smartphone
users were also about twice as likely to respond to
SMS ads (7.7% compared to 3.5%). This is
consistent with the data showing that smartphone
users are employing their browsers and apps at a
rate four to five times that of feature phone users.
19.1% 27.5%
15.9%
5.0% 3.5%
7.7%
Used Browser Used App Saw ad on web Responded to SMS ad
or within App
Feature phone Smartphone
More than Talk: Action in Mobile Marketing
52
53. 30% of Campaigns Focused on Leads
Mobile Advertiser Campaign Goals
April 2011, % of campaigns
Source: Millennial Media With the growing sophistication of handsets, mobile
advertisers are already creating a more sophisticated
3%
goal set for mobile campaigns. 30% of the mobile ad
8% campaigns were run in order to generate leads, followed
by sustained in-market presence as the advertiser goal
30%
of 29% of mobile advertisers.
13%
Advertisers in another 17% of the campaigns had a goal
of launching or releasing a product, and 13% of the
17%
campaigns had an advertiser goal of brand awareness,
according to Millennial Media‟s April 2011 SMART
29%
Report.
Lead Gen/Registrations Sustained in-market presence
Product launch/release Brand awareness
Increased foot traffic Site Traffic
More than Talk: Action in Mobile Marketing
53
54. Apple iOS Has Double CTR of Android
Click-Through Rates by Mobile OS
May 2011, % of users
Source: Jumptap
Apple‟s iOS sees the highest
click-through-rate with the
0.72%
0.67% ads run on iOS devices have
almost double the CTR
(.72%) of those on Android
devices (.41%), according to
0.41% 0.41% 0.41% the Jumptap STAT. This is
despite the fact that Android
0.32%
is leading in overall market
share.
Android iOS Blackberry Symbian webOS Other
More than Talk: Action in Mobile Marketing
54
55. 26% Drive to App Downloads
Mobile Advertiser Campaign Destination Goals
April 2011, % of campaigns
Source: Millennial Media
Almost half of mobile campaigns
on the Millennial network were
driving traffic to a website, while
49%
26% sent users to the an app
download page. The last quarter
were aiming to send traffic to a
custom landing page.
26% 25%
Traffic to site Application download Custom landing page
More than Talk: Action in Mobile Marketing
55
56. Mobile-Social Action Mix Up 39% M-o-M
Post-Click Action Campaign Mix Mobile-social media experienced growth of 39% month-over-
April 2011, % of campaigns
Source: Millennial Media month, reported Millennial Media, with a 17% share of the
post-click campaign action mix in April. Telecom,
42% entertainment, and retail advertisers utilized mobile-social as a
40%
post-click campaign action to acquire social media followers
and gather feedback on new movie releases and new product
32%
launches.
24%
19%
17%
15%
13%
12%
11%
2%
Application Enroll/join m-commerce Place call Retail Site Mobile- Store Subscribe View map Watch
download promotion search social media locator video
More than Talk: Action in Mobile Marketing
56
57. SocNet Convergence Higher from Twitter
Social Media Usage by Location
June 2011, % of respondents Twitter users are more likely to perform social networking via mobile device than
Source: Compete
users of Facebook or LinkedIn, according to Compete. 43% of Twitter users
access via phone and 9% access via tablet. In contrast, 34% of Facebook users
and only 9% of LinkedIn users access social networks via phone, while 7% of
98% 98% Facebook users and 4% of LinkedIn users employ a tablet.
92%
43%
34%
4%
9% 7% 9%
Desktop Phone Tablet
Facebook LinkedIn Twitter
More than Talk: Action in Mobile Marketing
57
58. Targeted Ads Up; Local at 56%
Mobile Campaign Targeting Mix
April 2011, % of campaigns
Source: Millennial Media
Targeted-audience campaigns --
local market, demographic, and
behavioral audience -- grew 23%
10% month-over-month, 48% of
campaigns.
48%
34% Of those targeted campaigns, 56%
52% 56%
targeted a local market, while 34%
targeted a demographic and only
10% targeted a behavioral
Local market
Demographic audience.
Behavoral audience
Broad reach
Targeted audience reach
More than Talk: Action in Mobile Marketing
58
59. Impressions: Android– 53%, iOS– 28%
Device OS Mix
April 2011, % of campaigns
Source: Millennial Media
Device Impression Share Smartphone OS Mix
1% 1%
1% Smartphones represented 68%
16% of the connected device
16% impressions on the Millennial
Media network. Of
smartphones on the Millennial
16% 68%
53% network, the two most popular
28% platforms by share of
impressions were Android
(53%) and iOS (28%).
Android iOS
Smartphones RIM Other
Feature Phones Symbian Windows Mobile
Connected Devices
More than Talk: Action in Mobile Marketing
59
60. By Branded Carrier, Verizon Has 19%
Device Carrier Mix
April 2011, % of campaigns
Source: Millennial Media
A combination of various Wi-Fi providers was the carrier with
the largest share of devices on the Millennial network at 29%.
Verizon followed with 19%, while Sprint-Nextel held 11% and
29%
AT&T and T-Mobile held 10% each.
19%
11%
10% 10%
5% 5% 2%
3%
Wi-Fi Verizon Sprint- AT&T T-Mobile Metro Cricket Other Boost
Nextel PCS Mobile
More than Talk: Action in Mobile Marketing
60
61. By Manufacturer, Apple Has 33%
Top Manufacturers of Mobile Devices
April 2011, % of campaigns
Source: Millennial Media Apple, including iPhone, iPad and iPod Touch, represented 32% of
impression share by device manufacturer in April. Samsung is the no. 2
device, followed by HTC and RIM. As well, the report found that the Apple
iPhone was the most popular mobile phone on the Millennial network in April,
responsible for about 20% of all impressions. This was four times the
32.8%
impression share of the no. 2 mobile phone, Blackberry Curve (5%).
15.6%
11.7%
10.6% 9.8%
6.4%
2.3% 1.7% 1.0% 0.8%
Apple Samsung HTC RIM Motorola LG HUAWB Nokia Sanyo SonyEricsson
More than Talk: Action in Mobile Marketing
61
64. Data Partners
Our data partners for the 2011 “More than Talk: Action in Mobile Marketing” are:
BIA/Kelsey • BIGresearch • Colloquy • Compete • comScore • Consumer Electronics Association •
etailing / Coffee Table • Jumptap • Millennial Media • Mobitrove • Oracle / ATG • Prosper Mobile
Insights • The Nielsen Company • TNS Mobile Life • Unica
At MarketingCharts, we consistently follow and locate new data sets from our partners in order to publish
the most relevant resources for our readers, including our daily data partners at MarketingCharts.com that
are also feature in this report:
MarketingCharts.com is part of the Watershed Publishing network of business-to-business
online trade publications. More than Talk: Action in Mobile Marketing is from Watershed
Publishing‟s Data Insights series.
Please contact Sarah Roberts at sarah@watershed-publishing.com to become a sponsor of
a Data Insights package.
64