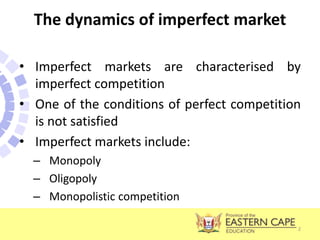
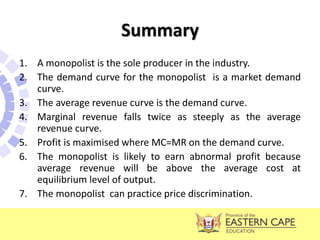
1) The document discusses monopoly as a market structure characterized by a single seller of a unique product or service with significant barriers to entry.
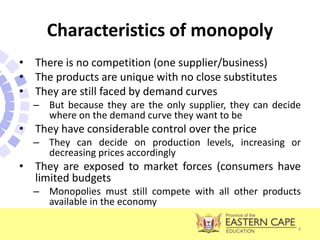
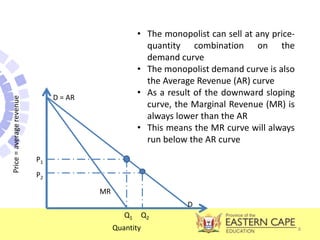
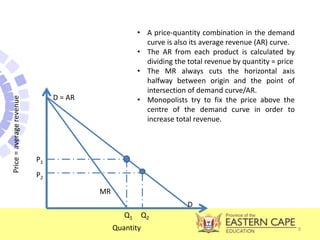
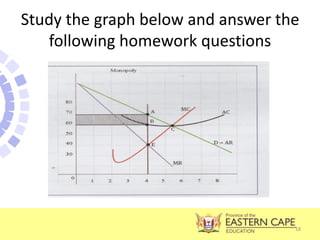
2) Under monopoly, output is lower and prices are higher than under perfect competition, resulting in inefficient production. A monopolist faces a downward-sloping demand curve and sets price along the curve.
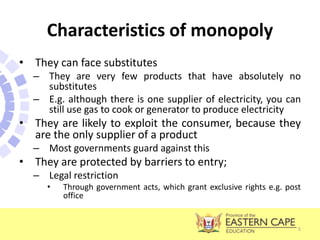
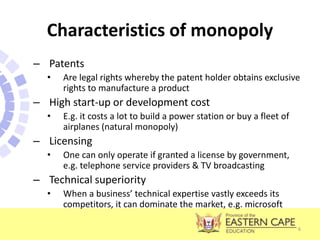
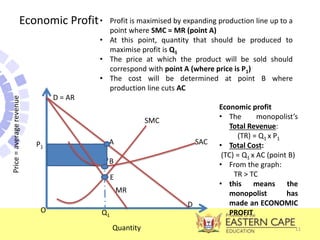
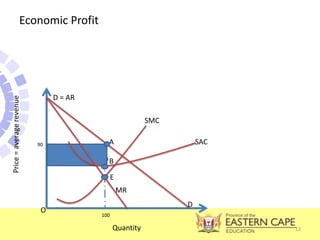
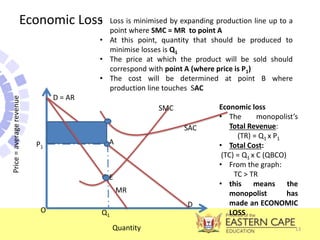
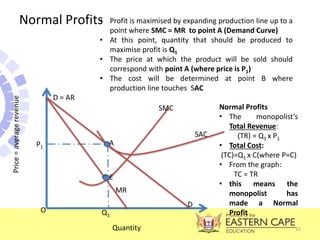
3) The monopolist maximizes profits by producing at the quantity where marginal revenue equals marginal cost, resulting in economic profits as average revenue exceeds average costs. The monopoly can earn economic profits even in the long run due to barriers to entry.