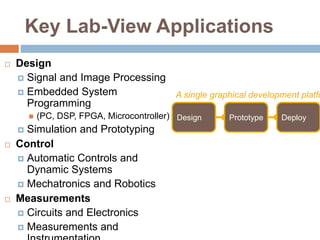
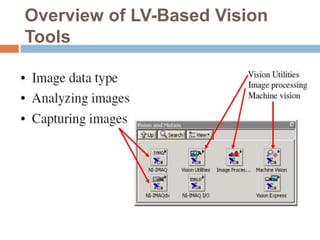
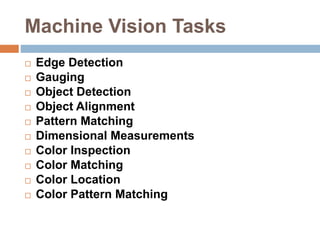
PRESENTATION ON
IMAGE PROCESSING &
LABVIEW
Dr. Vikram Mutneja
Associate Professor
Shaheed Bhagat Singh State University, Ferozepur
Key Lab-View Applications
 Design
 Signal and Image Processing
 Embedded System
Programming
 (PC, DSP, FPGA, Microcontroller)
 Simulation and Prototyping
 Control
 Automatic Controls and
Dynamic Systems
 Mechatronics and Robotics
 Measurements
 Circuits and Electronics
 Measurements and
Design Prototype Deploy
A single graphical development platfo
LabVIEW-based Vision
 LabVIEW Vision enables to read/create image
Files and provides means for managing those
files
 Built-in functions (VIs) for analyzing image files
(select areas of interest, measure intensity,
etc.)
 Based on LabVIEW IMAQ software which enables
to acquire images from cameras
 use these software tools to develop a simple
visionbased
 measurement system, particularly for object
 motion
Overview of LV-Based Vision
Tools
Image Analysis
 Image analysis combines techniques that
compute statistics and measurements based on
the gray-level intensities of the image pixels
 Image analysis functions are used determine
whether the image quality is good enough for your
inspection task.
 You can also analyze an image to understand its
content and to decide which type of inspection
tools to use to handle your application.
 Image analysis functions also provide
measurements you can use to perform basic
inspection tasks such as presence or absence
verification.
Tools for Image Analysis
 Vision Utilities – VIs for creating and
manipulating images, etc.
 Image Processing – provides ‘low level’ Vis
for analyzing images
 Machine Vision – groups many practical
Vis for performing image analysis.
 E.g. “Count and Measure Objects” VI is found
under this group.
Histogram
 A histogram counts and graphs the total number of
pixels at each gray-scale level
 Histogram is used to determine if the overall intensity in
the image is suitable for an inspection task
 To adjust your image acquisition conditions to acquire
higher quality images
 To analyze if a sensor is underexposed or saturated
 An underexposed image contains a large number of
pixels with low gray-level values
 The low gray-level values appear as a peak at the lower
end of the histogram
Underexposed Image &
Histogram
Overexposed Image &
Histogram
Use of Contrast
 A strategy to separate the objects from the
background relies on a difference in the
intensities of both, for example, bright particles
and a darker background.
 The analysis of the histogram of an image may
reveals how many well-separated intensity
populations it does has.
 Adjust your imaging setup until the histogram
of your acquired images has the contrast
required by your application
Contrast and Histogram
Analysis
 The analysis of the histogram in this image
reveals that it has two or more well-separated
intensity populations
Generating Intensity
Histogram
 Within the ROI, a histogram is generated of
the intensity values
 Note that most of the image is made up of
pixels with intensity greater than about 180.
White is 255.
Line Profile
 A line profile plots the variations of intensity
along a line
 It returns the gray-scale values of the pixels
along a line and graphs it
 Line profiles are helpful for examining
boundaries between components, quantifying
the magnitude of intensity variations, and
detecting the presence of repetitive patterns
A Line & its Line Profile
 A bright object with uniform intensity appears in the
profile as a plateau
 Higher the contrast between an object and its
surrounding background, the steeper the slopes of the
plateau. Noisy pixels, on the other hand, produce a
series of narrow peaks
Create an Image data object
 Menu: NI Measurements->Vision->Vision Utilities-
>Image Management
Image Data Types
Blob Analysis
 A blob (binary large object) is an area of touching
pixels with the same logical state. All pixels in an
image that belong to a blob are in a foreground
state. All other pixels are in a background state
 In a binary image, pixels in the background have
values=0 while every nonzero pixel is part of a
binary object
 Blob analysis is used to
 Detect blobs in an image and make selected
measurements of those blobs
 Find statistical information-such as the size of blobs or
the number, location, and presence of blob regions
Applications of Blob Analysis
 Detecting flaws on silicon wafers
 Detecting soldering defects on electronic
boards
 Inspection applications such as finding
structural defects on wood planks or detecting
cracks on plastics sheets
 To locate objects in motion control applications
when there is significant variance in part
shape or orientation
 To define a feature set that uniquely defines
the shape of the object
Thresholding
 Used to select ranges of pixel values in
grayscale and color images that separate the
objects under consideration from the
background
 Converts an image into a binary image, with
pixel values of 0 or 1
 This process works by setting to 1 all pixels
whose value falls within a certain range, called
the threshold interval, and setting all other
pixel values in the image to 0
Thresholding applied on an
Image
Machine Vision Tasks
 Edge Detection
 Gauging
 Object Detection
 Object Alignment
 Pattern Matching
 Dimensional Measurements
 Color Inspection
 Color Matching
 Color Location
 Color Pattern Matching
Thanks for Patient Listening...
 Any Queries Please

Image processing using labview

  • 1.
    PRESENTATION ON IMAGE PROCESSING& LABVIEW Dr. Vikram Mutneja Associate Professor Shaheed Bhagat Singh State University, Ferozepur
  • 2.
    Key Lab-View Applications Design  Signal and Image Processing  Embedded System Programming  (PC, DSP, FPGA, Microcontroller)  Simulation and Prototyping  Control  Automatic Controls and Dynamic Systems  Mechatronics and Robotics  Measurements  Circuits and Electronics  Measurements and Design Prototype Deploy A single graphical development platfo
  • 3.
    LabVIEW-based Vision  LabVIEWVision enables to read/create image Files and provides means for managing those files  Built-in functions (VIs) for analyzing image files (select areas of interest, measure intensity, etc.)  Based on LabVIEW IMAQ software which enables to acquire images from cameras  use these software tools to develop a simple visionbased  measurement system, particularly for object  motion
  • 4.
  • 5.
    Image Analysis  Imageanalysis combines techniques that compute statistics and measurements based on the gray-level intensities of the image pixels  Image analysis functions are used determine whether the image quality is good enough for your inspection task.  You can also analyze an image to understand its content and to decide which type of inspection tools to use to handle your application.  Image analysis functions also provide measurements you can use to perform basic inspection tasks such as presence or absence verification.
  • 6.
    Tools for ImageAnalysis  Vision Utilities – VIs for creating and manipulating images, etc.  Image Processing – provides ‘low level’ Vis for analyzing images  Machine Vision – groups many practical Vis for performing image analysis.  E.g. “Count and Measure Objects” VI is found under this group.
  • 7.
    Histogram  A histogramcounts and graphs the total number of pixels at each gray-scale level  Histogram is used to determine if the overall intensity in the image is suitable for an inspection task  To adjust your image acquisition conditions to acquire higher quality images  To analyze if a sensor is underexposed or saturated  An underexposed image contains a large number of pixels with low gray-level values  The low gray-level values appear as a peak at the lower end of the histogram
  • 8.
  • 9.
  • 10.
    Use of Contrast A strategy to separate the objects from the background relies on a difference in the intensities of both, for example, bright particles and a darker background.  The analysis of the histogram of an image may reveals how many well-separated intensity populations it does has.  Adjust your imaging setup until the histogram of your acquired images has the contrast required by your application
  • 11.
    Contrast and Histogram Analysis The analysis of the histogram in this image reveals that it has two or more well-separated intensity populations
  • 12.
    Generating Intensity Histogram  Withinthe ROI, a histogram is generated of the intensity values  Note that most of the image is made up of pixels with intensity greater than about 180. White is 255.
  • 13.
    Line Profile  Aline profile plots the variations of intensity along a line  It returns the gray-scale values of the pixels along a line and graphs it  Line profiles are helpful for examining boundaries between components, quantifying the magnitude of intensity variations, and detecting the presence of repetitive patterns
  • 14.
    A Line &its Line Profile  A bright object with uniform intensity appears in the profile as a plateau  Higher the contrast between an object and its surrounding background, the steeper the slopes of the plateau. Noisy pixels, on the other hand, produce a series of narrow peaks
  • 15.
    Create an Imagedata object  Menu: NI Measurements->Vision->Vision Utilities- >Image Management
  • 16.
  • 17.
    Blob Analysis  Ablob (binary large object) is an area of touching pixels with the same logical state. All pixels in an image that belong to a blob are in a foreground state. All other pixels are in a background state  In a binary image, pixels in the background have values=0 while every nonzero pixel is part of a binary object  Blob analysis is used to  Detect blobs in an image and make selected measurements of those blobs  Find statistical information-such as the size of blobs or the number, location, and presence of blob regions
  • 18.
    Applications of BlobAnalysis  Detecting flaws on silicon wafers  Detecting soldering defects on electronic boards  Inspection applications such as finding structural defects on wood planks or detecting cracks on plastics sheets  To locate objects in motion control applications when there is significant variance in part shape or orientation  To define a feature set that uniquely defines the shape of the object
  • 19.
    Thresholding  Used toselect ranges of pixel values in grayscale and color images that separate the objects under consideration from the background  Converts an image into a binary image, with pixel values of 0 or 1  This process works by setting to 1 all pixels whose value falls within a certain range, called the threshold interval, and setting all other pixel values in the image to 0
  • 20.
  • 21.
    Machine Vision Tasks Edge Detection  Gauging  Object Detection  Object Alignment  Pattern Matching  Dimensional Measurements  Color Inspection  Color Matching  Color Location  Color Pattern Matching
  • 22.
    Thanks for PatientListening...  Any Queries Please