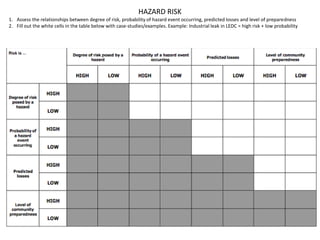
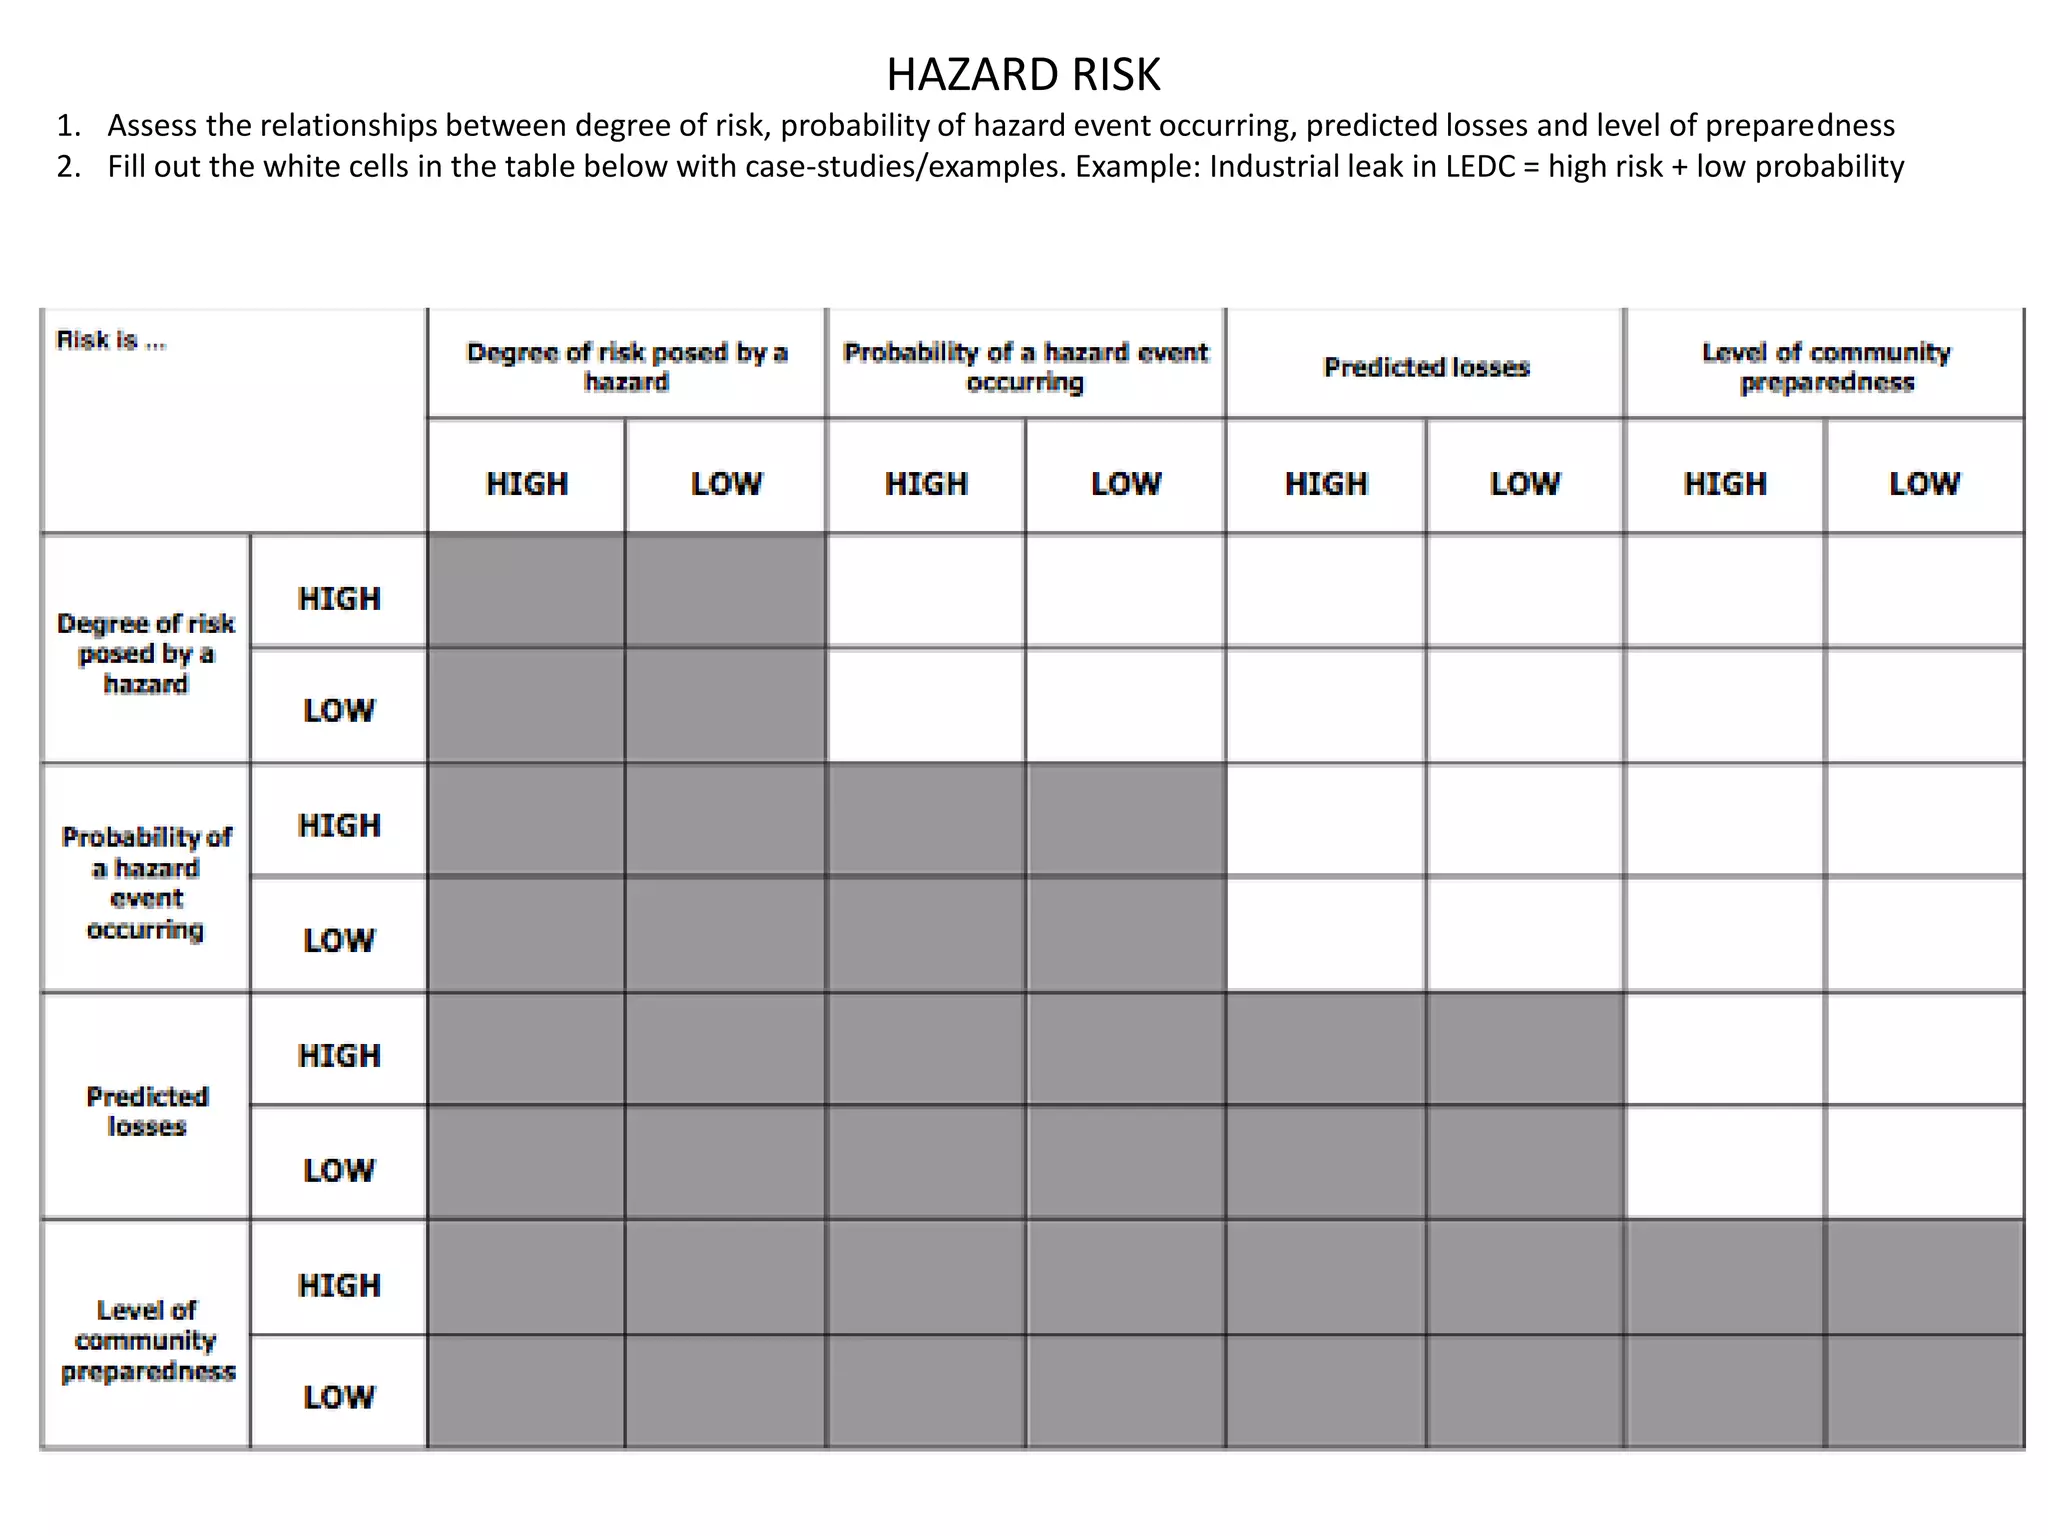
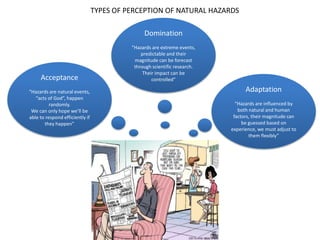
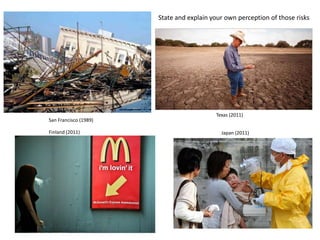
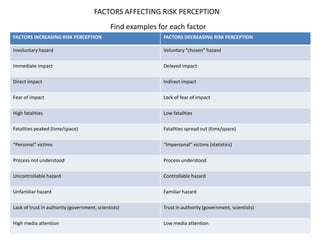
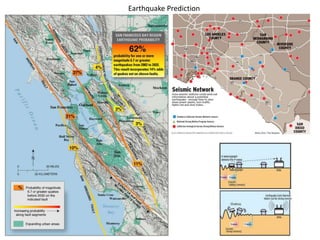
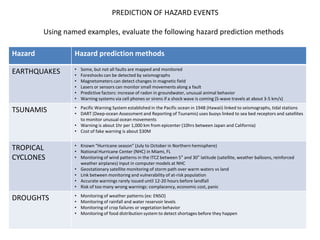
HAZARD RISK
1. Assess the relationships between degree of risk, probability of hazard event occurring, predicted losses and level of preparedness
2. Fill out the white cells in the table below with case-studies/examples. Example: Industrial leak in LEDC = high risk + low probability
TYPES OF PERCEPTION OF NATURAL HAZARDS

                                                Domination
                                           “Hazards are extreme events,
                                               predictable and their
                                            magnitude can be forecast
                                            through scientific research.
                                                Their impact can be
     Acceptance                                     controlled”

“Hazards are natural events,                                                     Adaptation
   “acts of God”, happen
          randomly.                                                          “Hazards are influenced by
 We can only hope we’ll be                                                    both natural and human
able to respond efficiently if                                              factors, their magnitude can
       they happen”                                                             be guessed based on
                                                                           experience, we must adjust to
                                                                                   them flexibly”
State and explain your own perception of those risks


                                          Texas (2011)
San Francisco (1989)

Finland (2011)                              Japan (2011)
FACTORS AFFECTING RISK PERCEPTION
                                              Find examples for each factor
FACTORS INCREASING RISK PERCEPTION                            FACTORS DECREASING RISK PERCEPTION

Involuntary hazard                                            Voluntary “chosen” hazard

Immediate impact                                              Delayed impact

Direct impact                                                 Indirect impact

Fear of impact                                                Lack of fear of impact

High fatalities                                               Low fatalities

Fatalities peaked (time/space)                                Fatalities spread out (time/space)

“Personal” victims                                            “Impersonal” victims (statistics)

Process not understood                                        Process understood

Uncontrollable hazard                                         Controllable hazard

Unfamiliar hazard                                             Familiar hazard

Lack of trust in authority (government, scientists)           Trust in authority (government, scientists)

High media attention                                          Low media attention
Earthquake Prediction
Tsunami Prediction


                     Which regions are more/less
                     protected?
PREDICTION OF HAZARD EVENTS

         Using named examples, evaluate the following hazard prediction methods

Hazard            Hazard prediction methods
                  •   Some, but not all faults are mapped and monitored
EARTHQUAKES       •   Foreshocks can be detected by seismographs
                  •   Magnetometers can detect changes in magnetic field
                  •   Lasers or sensors can monitor small movements along a fault
                  •   Predictive factors: increase of radon in groundwater, unusual animal behavior
                  •   Warning systems via cell phones or sirens if a shock wave is coming (S-wave travels at about 3-5 km/s)
                  • Pacific Warning System established in the Pacific ocean in 1948 (Hawaii) linked to seismographs, tidal stations
TSUNAMIS          • DART (Deep-ocean Assessment and Reporting of Tsunamis) uses buoys linked to sea bed receptors and satellites
                    to monitor unusual ocean movements
                  • Warning is about 1hr per 1,000 km from epicenter (10hrs between Japan and California)
                  • Cost of fake warning is about $30M

                  • Known “Hurricane season” (July to October in Northern hemisphere)
TROPICAL          • National Hurricane Center (NHC) in Miami, FL
CYCLONES          • Monitoring of wind patterns in the ITCZ between 5° and 30° latitude (satellite, weather balloons, reinforced
                    weather airplanes) input in computer models at NHC
                  • Geostationary satellite monitoring of storm path over warm waters vs land
                  • Link between monitoring and vulnerability of at-risk population
                  • Accurate warnings rarely issued until 12-20 hours before landfall
                  • Risk of too many wrong warnings: complacency, economic cost, panic
                  •   Monitoring of weather patterns (ex: ENSO)
DROUGHTS          •   Monitoring of rainfall and water reservoir levels
                  •   Monitoring of crop failures or vegetation behavior
                  •   Monitoring of food distribution system to detect shortages before they happen

III. Risk and Risk Assessment

  • 1.
    HAZARD RISK 1. Assessthe relationships between degree of risk, probability of hazard event occurring, predicted losses and level of preparedness 2. Fill out the white cells in the table below with case-studies/examples. Example: Industrial leak in LEDC = high risk + low probability
  • 2.
    TYPES OF PERCEPTIONOF NATURAL HAZARDS Domination “Hazards are extreme events, predictable and their magnitude can be forecast through scientific research. Their impact can be Acceptance controlled” “Hazards are natural events, Adaptation “acts of God”, happen randomly. “Hazards are influenced by We can only hope we’ll be both natural and human able to respond efficiently if factors, their magnitude can they happen” be guessed based on experience, we must adjust to them flexibly”
  • 3.
    State and explainyour own perception of those risks Texas (2011) San Francisco (1989) Finland (2011) Japan (2011)
  • 4.
    FACTORS AFFECTING RISKPERCEPTION Find examples for each factor FACTORS INCREASING RISK PERCEPTION FACTORS DECREASING RISK PERCEPTION Involuntary hazard Voluntary “chosen” hazard Immediate impact Delayed impact Direct impact Indirect impact Fear of impact Lack of fear of impact High fatalities Low fatalities Fatalities peaked (time/space) Fatalities spread out (time/space) “Personal” victims “Impersonal” victims (statistics) Process not understood Process understood Uncontrollable hazard Controllable hazard Unfamiliar hazard Familiar hazard Lack of trust in authority (government, scientists) Trust in authority (government, scientists) High media attention Low media attention
  • 5.
  • 6.
    Tsunami Prediction Which regions are more/less protected?
  • 7.
    PREDICTION OF HAZARDEVENTS Using named examples, evaluate the following hazard prediction methods Hazard Hazard prediction methods • Some, but not all faults are mapped and monitored EARTHQUAKES • Foreshocks can be detected by seismographs • Magnetometers can detect changes in magnetic field • Lasers or sensors can monitor small movements along a fault • Predictive factors: increase of radon in groundwater, unusual animal behavior • Warning systems via cell phones or sirens if a shock wave is coming (S-wave travels at about 3-5 km/s) • Pacific Warning System established in the Pacific ocean in 1948 (Hawaii) linked to seismographs, tidal stations TSUNAMIS • DART (Deep-ocean Assessment and Reporting of Tsunamis) uses buoys linked to sea bed receptors and satellites to monitor unusual ocean movements • Warning is about 1hr per 1,000 km from epicenter (10hrs between Japan and California) • Cost of fake warning is about $30M • Known “Hurricane season” (July to October in Northern hemisphere) TROPICAL • National Hurricane Center (NHC) in Miami, FL CYCLONES • Monitoring of wind patterns in the ITCZ between 5° and 30° latitude (satellite, weather balloons, reinforced weather airplanes) input in computer models at NHC • Geostationary satellite monitoring of storm path over warm waters vs land • Link between monitoring and vulnerability of at-risk population • Accurate warnings rarely issued until 12-20 hours before landfall • Risk of too many wrong warnings: complacency, economic cost, panic • Monitoring of weather patterns (ex: ENSO) DROUGHTS • Monitoring of rainfall and water reservoir levels • Monitoring of crop failures or vegetation behavior • Monitoring of food distribution system to detect shortages before they happen