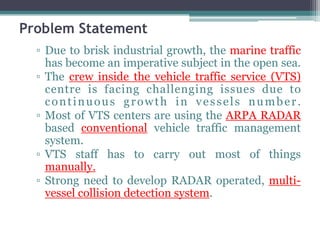
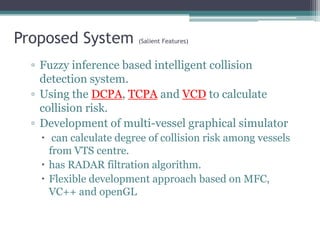
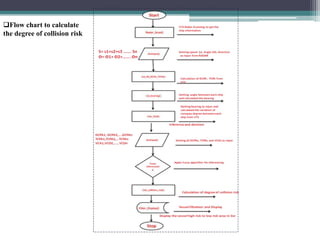
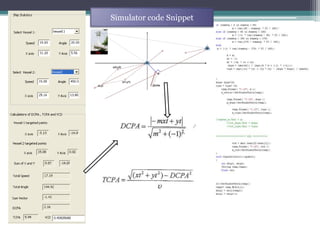
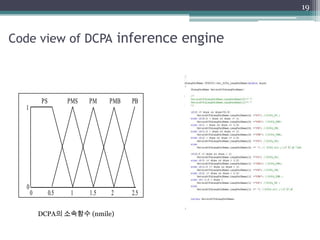
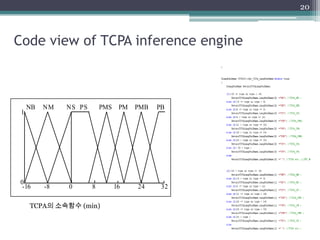
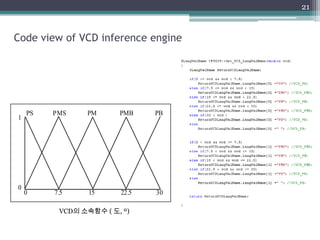
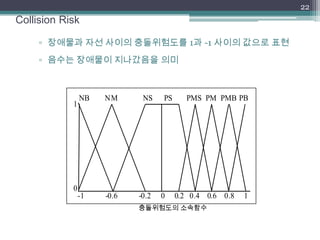
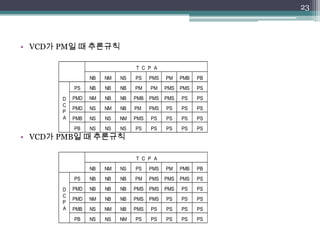
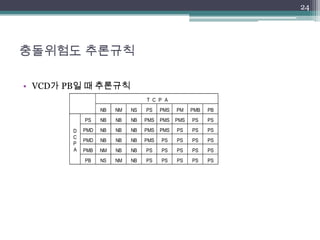
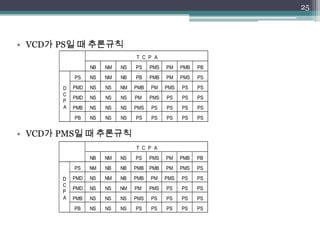
VTS를 위한 상황별 충돌위험도 연구
경상대학교
컴퓨터과학과
Contents
 Problem statement
 Proposed System
 Introduction and Background study
▫ Calculation of DCPA
▫ Calculation of TCPA
▫ Calculation of VCD
 Multi-vessel collision risk calculation
▫ Fuzzy inference system
▫ Utilization of Fuzzy Inference for collision risk calculation
 Application
▫ Simulator Development
▫ Techniques , tools
 Results
 Future Work
Problem Statement
▫ Due to brisk industrial growth, the marine traffic
has become an imperative subject in the open sea.
▫ The crew inside the vehicle traffic service (VTS)
centre is facing challenging issues due to
continuous growth in vessels number.
▫ Most of VTS centers are using the ARPA RADAR
based conventional vehicle traffic management
system.
▫ VTS staff has to carry out most of things
manually.
▫ Strong need to develop RADAR operated, multi-
vessel collision detection system.
Proposed System (Salient Features)
▫ Fuzzy inference based intelligent collision
detection system.
▫ Using the DCPA, TCPA and VCD to calculate
collision risk.
▫ Development of multi-vessel graphical simulator
 can calculate degree of collision risk among vessels
from VTS centre.
 has RADAR filtration algorithm.
 Flexible development approach based on MFC,
VC++ and openGL
Flow chart to calculate
the degree of collision risk
Calculation of DCPA
•DCPA is considered the closet point of approach between the two vessels.
•The blue line in the following figure is displaying the DCPA between A & B.
Projection Vectors
Resultant Vector
Mathematical Calculation of DCPA
0°< θ < 90° Then m = tan (90°- θ) (1)
90°< θ < 180° Then m = -tan(θ - 90°) (2)
180°< θ < 270° Then m = tan(270°- θ) (3)
270°< θ < 360° Then m = -tan(θ - 270°) (4)
Where θ is the angle between the vessels, calculated from VTS centre
and x, y ,m are the coordinates and the slope respectively.
mx - y - mtx + ty = 0 (5)
2)1(2m
ytmxt
DCPA
(6)
Suppose ‘V’ is the vessel and ‘I’ denotes the number
of vessels which comes in the range of RADAR.
If the total number of vessel in particular scenario
n=6. Then, mathematically we can calculate,
for how many times, we have to calculate the
DCPA using the following calculation.
=
Ship 1 case: 1 2, 1 3, 1 4, 1 5, 1 6
Ship 2 case: 2 3, 2 4, 2 5, 2 6
. . . . . .
. . . . . .
Calculation of DCPA among vessel from VTS
Calculation of TCPA
• TCPA is the time to closet point of approach.
According to figure (mentioned in the previous
slide) the TCPA is the time, which the vessel A
takes to reach the vessel B.
For reference
222
)( DCPAytxt
TCPA
(7)
Where x and y are the co-ordinates and DCPA is the distance to
the closet point of approach
송재욱, 1995. PC를 이용한 ARPA RADAR SIMULATOR의 개발에 관한 연구,
한국해양대학교
Calculation of VCD
• VCD is the variance of a compass direction which can be
measured with the difference of two consecutive bearing.
Calculation of VCD among vessel from VTS centre
Calculation of VCD
• For the calculation of VCD, first we have to calculate the
bearings among all the vessels from VTS centre using RADAR
input.
Calculation of VCD
Calculation of degree of collision risk
 Input arrays to calculate the degree of collision risk among vessels
from VTS centre
Calculation of degree of collision risk
• To calculate the degree of collision risk. We used fuzzy inference system.
Fuzzy Inference System
Fuzzy inference is the process of formulating the mapping from a given input to an
output using fuzzy logic.
Fuzzy Logic
Fuzzy logic is based on fuzzy set theory which is introduced by Lotfi A. Zadeh and
Dieter Klauain 1965
Fuzzy set theory
Fuzzy sets are sets whose elements have degrees of membership.
an extension of the classical notion of set.
In classical set theory, the membership of elements in a set is assessed in binary terms.
By contrast, fuzzy set theory permits the gradual assessment of the membership of
elements in a set
fuzzy set theory can be used in a wide range of domains in which information is
incomplete or imprecise.
Simulation and scenario
To validate the accuracy of our algorithm. We developed a
simulator.
In simulation we took 11 vessels
Each vessel is considered as an autonomous object which
means; each have its own
 Position (x,y)
 Speed (we can derive velocity from speed)
 Angle (course)
 DCPA (can be measured from VTS)
 TCPA (can be measured from VTS )
We supposed in our scenario that ships are moving randomly.
Vessels Statistics Display Module
DCPA, TCPA and VCD Module
Simulation Panel
RADAR Filtration
Module
Collision Risk Calculation
Module
What is inside the ship simulator code !!
Simulator code Snippet
Code view of DCPA inference engine
19
PS PMS PM PMB PB
0 0.5 1 1.5 2 2.5
0
1
DCPA의 소속함수 (nmile)
Code view of TCPA inference engine
20
-16 -8 0 8 16 24 32
NB NM NS PS PMS PM PMB PB
0
1
TCPA의 소속함수 (min)
Code view of VCD inference engine
21
PS PMS PM PMB PB
0 7.5 15 22.5 30
0
1
VCD의 소속함수 ( 도, º)
▫ 장애물과 자선 사이의 충돌위험도를 1과 -1 사이의 값으로 표현
▫ 음수는 장애물이 지나갔음을 의미
22
0
1
-1 -0.6 -0.2 0 0.2 0.4 0.6 0.8 1
NB NM NS PS PMS PM PMB PB
충돌위험도의 소속함수
Collision Risk
• VCD가 PM일 때 추론규칙
• VCD가 PMB일 때 추론규칙
23
NB NM NS PS PMS PM PMB PB
PS NB NB NB PM PM PMS PMS PS
PMD NM NB NB PMB PMS PMS PS PS
PMD NS NM NB PM PMS PS PS PS
PMB NS NS NM PMS PS PS PS PS
PB NS NS NS PS PS PS PS PS
D
C
P
A
T C P A
NB NM NS PS PMS PM PMB PB
PS NB NB NB PM PMS PMS PMS PS
PMD NB NB NB PMS PMS PMS PS PS
PMD NM NB NB PMS PMS PS PS PS
PMB NS NM NB PMS PS PS PS PS
PB NS NS NM PS PS PS PS PS
D
C
P
A
T C P A
충돌위험도 추론규칙
• VCD가 PB일 때 추론규칙
24
NB NM NS PS PMS PM PMB PB
PS NB NB NB PMS PMS PMS PS PS
PMD NB NB NB PMS PMS PS PS PS
PMD NB NB NB PMS PS PS PS PS
PMB NM NB NB PS PS PS PS PS
PB NS NM NB PS PS PS PS PS
D
C
P
A
T C P A
• VCD가 PS일 때 추론규칙
• VCD가 PMS일 때 추론규칙
25
NB NM NS PS PMS PM PMB PB
PS NS NM NB PB PMB PM PMS PS
PMD NS NS NM PMB PM PMS PS PS
PMD NS NS NS PM PMS PS PS PS
PMB NS NS NS PMS PS PS PS PS
PB NS NS NS PS PS PS PS PS
D
C
P
A
T C P A
NB NM NS PS PMS PM PMB PB
PS NM NB NB PMB PMB PM PMS PS
PMD NS NM NB PMB PM PMS PS PS
PMD NS NS NM PM PMS PS PS PS
PMB NS NS NS PMS PS PS PS PS
PB NS NS NS PS PS PS PS PS
D
C
P
A
T C P A
Code Snippet of inference tables
Collision risk calculation
Radar Filtration
The simulation area shows the results after 1800 milli-
second delay. (It can be decreased by using multi-core processor)
The filtration module filters the vessel which come in
5 NM radius of selected vessel.
This module create easiness to filter the degree of
collision risk around specific vessel.
Radar Filtration
This area display the vessel
which come in radar range.
Degree of collision around a
specific vessel.
Many Thanks

AN Intelligent Realtime multiple vessel collision risk assessment system

  • 1.
    VTS를 위한 상황별충돌위험도 연구 경상대학교 컴퓨터과학과
  • 2.
    Contents  Problem statement Proposed System  Introduction and Background study ▫ Calculation of DCPA ▫ Calculation of TCPA ▫ Calculation of VCD  Multi-vessel collision risk calculation ▫ Fuzzy inference system ▫ Utilization of Fuzzy Inference for collision risk calculation  Application ▫ Simulator Development ▫ Techniques , tools  Results  Future Work
  • 3.
    Problem Statement ▫ Dueto brisk industrial growth, the marine traffic has become an imperative subject in the open sea. ▫ The crew inside the vehicle traffic service (VTS) centre is facing challenging issues due to continuous growth in vessels number. ▫ Most of VTS centers are using the ARPA RADAR based conventional vehicle traffic management system. ▫ VTS staff has to carry out most of things manually. ▫ Strong need to develop RADAR operated, multi- vessel collision detection system.
  • 4.
    Proposed System (SalientFeatures) ▫ Fuzzy inference based intelligent collision detection system. ▫ Using the DCPA, TCPA and VCD to calculate collision risk. ▫ Development of multi-vessel graphical simulator  can calculate degree of collision risk among vessels from VTS centre.  has RADAR filtration algorithm.  Flexible development approach based on MFC, VC++ and openGL
  • 5.
    Flow chart tocalculate the degree of collision risk
  • 6.
    Calculation of DCPA •DCPAis considered the closet point of approach between the two vessels. •The blue line in the following figure is displaying the DCPA between A & B. Projection Vectors Resultant Vector
  • 7.
    Mathematical Calculation ofDCPA 0°< θ < 90° Then m = tan (90°- θ) (1) 90°< θ < 180° Then m = -tan(θ - 90°) (2) 180°< θ < 270° Then m = tan(270°- θ) (3) 270°< θ < 360° Then m = -tan(θ - 270°) (4) Where θ is the angle between the vessels, calculated from VTS centre and x, y ,m are the coordinates and the slope respectively. mx - y - mtx + ty = 0 (5) 2)1(2m ytmxt DCPA (6)
  • 8.
    Suppose ‘V’ isthe vessel and ‘I’ denotes the number of vessels which comes in the range of RADAR. If the total number of vessel in particular scenario n=6. Then, mathematically we can calculate, for how many times, we have to calculate the DCPA using the following calculation. = Ship 1 case: 1 2, 1 3, 1 4, 1 5, 1 6 Ship 2 case: 2 3, 2 4, 2 5, 2 6 . . . . . . . . . . . . Calculation of DCPA among vessel from VTS
  • 9.
    Calculation of TCPA •TCPA is the time to closet point of approach. According to figure (mentioned in the previous slide) the TCPA is the time, which the vessel A takes to reach the vessel B. For reference 222 )( DCPAytxt TCPA (7) Where x and y are the co-ordinates and DCPA is the distance to the closet point of approach 송재욱, 1995. PC를 이용한 ARPA RADAR SIMULATOR의 개발에 관한 연구, 한국해양대학교
  • 10.
    Calculation of VCD •VCD is the variance of a compass direction which can be measured with the difference of two consecutive bearing. Calculation of VCD among vessel from VTS centre
  • 11.
    Calculation of VCD •For the calculation of VCD, first we have to calculate the bearings among all the vessels from VTS centre using RADAR input.
  • 12.
  • 13.
    Calculation of degreeof collision risk  Input arrays to calculate the degree of collision risk among vessels from VTS centre
  • 14.
    Calculation of degreeof collision risk • To calculate the degree of collision risk. We used fuzzy inference system. Fuzzy Inference System Fuzzy inference is the process of formulating the mapping from a given input to an output using fuzzy logic. Fuzzy Logic Fuzzy logic is based on fuzzy set theory which is introduced by Lotfi A. Zadeh and Dieter Klauain 1965 Fuzzy set theory Fuzzy sets are sets whose elements have degrees of membership. an extension of the classical notion of set. In classical set theory, the membership of elements in a set is assessed in binary terms. By contrast, fuzzy set theory permits the gradual assessment of the membership of elements in a set fuzzy set theory can be used in a wide range of domains in which information is incomplete or imprecise.
  • 15.
    Simulation and scenario Tovalidate the accuracy of our algorithm. We developed a simulator. In simulation we took 11 vessels Each vessel is considered as an autonomous object which means; each have its own  Position (x,y)  Speed (we can derive velocity from speed)  Angle (course)  DCPA (can be measured from VTS)  TCPA (can be measured from VTS ) We supposed in our scenario that ships are moving randomly.
  • 16.
    Vessels Statistics DisplayModule DCPA, TCPA and VCD Module Simulation Panel RADAR Filtration Module Collision Risk Calculation Module
  • 17.
    What is insidethe ship simulator code !!
  • 18.
  • 19.
    Code view ofDCPA inference engine 19 PS PMS PM PMB PB 0 0.5 1 1.5 2 2.5 0 1 DCPA의 소속함수 (nmile)
  • 20.
    Code view ofTCPA inference engine 20 -16 -8 0 8 16 24 32 NB NM NS PS PMS PM PMB PB 0 1 TCPA의 소속함수 (min)
  • 21.
    Code view ofVCD inference engine 21 PS PMS PM PMB PB 0 7.5 15 22.5 30 0 1 VCD의 소속함수 ( 도, º)
  • 22.
    ▫ 장애물과 자선사이의 충돌위험도를 1과 -1 사이의 값으로 표현 ▫ 음수는 장애물이 지나갔음을 의미 22 0 1 -1 -0.6 -0.2 0 0.2 0.4 0.6 0.8 1 NB NM NS PS PMS PM PMB PB 충돌위험도의 소속함수 Collision Risk
  • 23.
    • VCD가 PM일때 추론규칙 • VCD가 PMB일 때 추론규칙 23 NB NM NS PS PMS PM PMB PB PS NB NB NB PM PM PMS PMS PS PMD NM NB NB PMB PMS PMS PS PS PMD NS NM NB PM PMS PS PS PS PMB NS NS NM PMS PS PS PS PS PB NS NS NS PS PS PS PS PS D C P A T C P A NB NM NS PS PMS PM PMB PB PS NB NB NB PM PMS PMS PMS PS PMD NB NB NB PMS PMS PMS PS PS PMD NM NB NB PMS PMS PS PS PS PMB NS NM NB PMS PS PS PS PS PB NS NS NM PS PS PS PS PS D C P A T C P A
  • 24.
    충돌위험도 추론규칙 • VCD가PB일 때 추론규칙 24 NB NM NS PS PMS PM PMB PB PS NB NB NB PMS PMS PMS PS PS PMD NB NB NB PMS PMS PS PS PS PMD NB NB NB PMS PS PS PS PS PMB NM NB NB PS PS PS PS PS PB NS NM NB PS PS PS PS PS D C P A T C P A
  • 25.
    • VCD가 PS일때 추론규칙 • VCD가 PMS일 때 추론규칙 25 NB NM NS PS PMS PM PMB PB PS NS NM NB PB PMB PM PMS PS PMD NS NS NM PMB PM PMS PS PS PMD NS NS NS PM PMS PS PS PS PMB NS NS NS PMS PS PS PS PS PB NS NS NS PS PS PS PS PS D C P A T C P A NB NM NS PS PMS PM PMB PB PS NM NB NB PMB PMB PM PMS PS PMD NS NM NB PMB PM PMS PS PS PMD NS NS NM PM PMS PS PS PS PMB NS NS NS PMS PS PS PS PS PB NS NS NS PS PS PS PS PS D C P A T C P A
  • 26.
    Code Snippet ofinference tables
  • 27.
  • 28.
    Radar Filtration The simulationarea shows the results after 1800 milli- second delay. (It can be decreased by using multi-core processor) The filtration module filters the vessel which come in 5 NM radius of selected vessel. This module create easiness to filter the degree of collision risk around specific vessel.
  • 29.
    Radar Filtration This areadisplay the vessel which come in radar range. Degree of collision around a specific vessel.
  • 30.