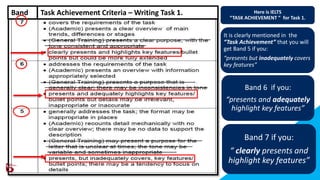
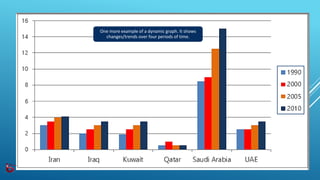
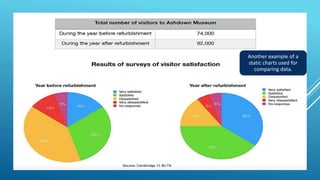
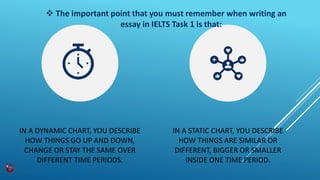
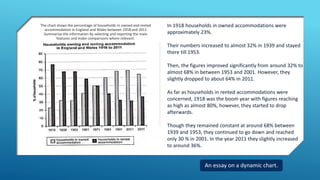
Static & Dynamic
Graphs.
IELTS Writing Task 1
(Academic).
Why it is important
to understand
graphs for the IELTS
Writing Task 1?
IT IS A VERY VALID QUESTION.
IELTS is a proficiency test for the
English language, why I need to
worry about graphs?
“Task Achievement” of Task 1
clearly states that you will not
get band 7 if you do not clearly
present key features of the chart.
The reason why it is important to understand graphs is:
Task Achievement Criteria – Writing Task 1.Band Here is IELTS
“TASK ACHIEVEMENT ” for Task 1.
It is clearly mentioned in the
“Task Achievement” that you will
get Band 5 if you:
“presents but inadequately covers
key features”
Band 6 if you:
“presents and adequately
highlight key features”
Band 7 if you:
“ clearly presents and
highlight key features”
Static & Dynamic
Graphs.
IELTS Writing Task 1
(Academic).
 Before writing your answer to Task 1, the first thing you need to do is to decide if
the chart is static or dynamic.
Static means that the data comes from one point in time.
STATIC Charts contain data points belonging to either a
single time frame - such as one year, one month etc. - or
have no time reference at all.
Dynamic means the data comes from more than
one point in time. DYNAMIC charts contain data
points in several time periods – for example 24
hours from 10 am to 10 pm, 10 years from 2000
to 2020 or days from Monday to Sunday.
Example of
Dynamic
GraphsThe graph is dynamic because it represents
trends/changes over a period of time from
2011 and 2014
Another example of a dynamic Graph. Again, it represents
trends/changes in three different categories over five years.
Another example of a dynamic graph. It show
tends over three different periods of time.
One more example of a dynamic graph. It shows
changes/trends over four periods of time.
Example
of Static
GraphsThe static graph does not have any timeline. It does not represent trends
over a period of time. In this example, you have to simply compare counties
and their average wealth. Here you can not describe the increase or decrease
over any period of time because there is no timeline.
Another example of a static charts used for comparing data.
Another example of a
static charts used for
comparing data.
IN A DYNAMIC CHART, YOU DESCRIBE
HOW THINGS GO UP AND DOWN,
CHANGE OR STAY THE SAME OVER
DIFFERENT TIME PERIODS.
IN A STATIC CHART, YOU DESCRIBE
HOW THINGS ARE SIMILAR OR
DIFFERENT, BIGGER OR SMALLER
INSIDE ONE TIME PERIOD.
 The important point that you must remember when writing an
essay in IELTS Task 1 is that:
In 1918 households in owned accommodations were
approximately 23%.
Their numbers increased to almost 32% in 1939 and stayed
there till 1953.
Then, the figures improved significantly from around 32% to
almost 68% in between 1953 and 2001. However, they
slightly dropped to about 64% in 2011.
As far as households in rented accommodations were
concerned, 1918 was the boom year with figures reaching
as high as almost 80%, however, they started to drop
afterwards.
Though they remained constant at around 68% between
1939 and 1953, they continued to go down and reached
only 30 % in 2001. In the year 2011 they slightly increased
to around 36%.
The chart shows the percentage of households in owned and rented
accommodation in England and Wales between 1918 and 2011
Summarise the information by selecting and reporting the main
features and make comparisons where relevant.
An essay on a dynamic chart.
The charts below show what the UK graduate and
postgraduate students who did not go into full-time work did
after leaving college in 2008.
Summarize the information by selecting and reporting the
main features and make comparisons where relevant.
An essay on a static chart.
Majority of both undergraduate and postgraduate
students went for higher studies. Almost thirty thousand
graduate students opted for further study and 2725
postgraduate students went for higher studies.
There was a significant difference between the student
undergoing part-time work and higher studies among the
undergraduate. While for the postgraduates this the
difference was negligible Almost eighteen thousand
undergraduate students took a part-time job compared to
the twenty-five hundred postgraduate.
Student opting for voluntary work was the lowest choice
in both cases.
It is also noticeable that a large proportion of
undergraduate and post-graduate students were
unemployed after the completion of their degree, that is
about 16,236 and 1,625 respectively.
for watching
This is the end of this presentation
For a complete IELTS training course
and practice.
Visit: www.ieltsbackup.com
Send us your feedback and suggestions on
info@ieltsbackup.com
Hi,
I have developed a systematic approach for all question types frequently
appearing in IELTS. Students who tired them in their IELTS exams have
received amazing results.
(Zafar Yar Khan)
Author and Publisher
If you need help in achieving your goals in IELTS,
write to me at info@ieltsbackup.com or visit
www.ieltsbackup.com
and click on “IELTS Tuition”.
I will contact you as soon as I can.

IELTS Writing Task 1 - Static - Dynamic Graphs

  • 2.
    Static & Dynamic Graphs. IELTSWriting Task 1 (Academic).
  • 3.
    Why it isimportant to understand graphs for the IELTS Writing Task 1?
  • 4.
    IT IS AVERY VALID QUESTION. IELTS is a proficiency test for the English language, why I need to worry about graphs?
  • 5.
    “Task Achievement” ofTask 1 clearly states that you will not get band 7 if you do not clearly present key features of the chart. The reason why it is important to understand graphs is:
  • 6.
    Task Achievement Criteria– Writing Task 1.Band Here is IELTS “TASK ACHIEVEMENT ” for Task 1. It is clearly mentioned in the “Task Achievement” that you will get Band 5 if you: “presents but inadequately covers key features” Band 6 if you: “presents and adequately highlight key features” Band 7 if you: “ clearly presents and highlight key features”
  • 7.
    Static & Dynamic Graphs. IELTSWriting Task 1 (Academic).
  • 8.
     Before writingyour answer to Task 1, the first thing you need to do is to decide if the chart is static or dynamic. Static means that the data comes from one point in time. STATIC Charts contain data points belonging to either a single time frame - such as one year, one month etc. - or have no time reference at all. Dynamic means the data comes from more than one point in time. DYNAMIC charts contain data points in several time periods – for example 24 hours from 10 am to 10 pm, 10 years from 2000 to 2020 or days from Monday to Sunday.
  • 9.
    Example of Dynamic GraphsThe graphis dynamic because it represents trends/changes over a period of time from 2011 and 2014
  • 10.
    Another example ofa dynamic Graph. Again, it represents trends/changes in three different categories over five years.
  • 11.
    Another example ofa dynamic graph. It show tends over three different periods of time.
  • 12.
    One more exampleof a dynamic graph. It shows changes/trends over four periods of time.
  • 13.
    Example of Static GraphsThe staticgraph does not have any timeline. It does not represent trends over a period of time. In this example, you have to simply compare counties and their average wealth. Here you can not describe the increase or decrease over any period of time because there is no timeline.
  • 14.
    Another example ofa static charts used for comparing data.
  • 15.
    Another example ofa static charts used for comparing data.
  • 16.
    IN A DYNAMICCHART, YOU DESCRIBE HOW THINGS GO UP AND DOWN, CHANGE OR STAY THE SAME OVER DIFFERENT TIME PERIODS. IN A STATIC CHART, YOU DESCRIBE HOW THINGS ARE SIMILAR OR DIFFERENT, BIGGER OR SMALLER INSIDE ONE TIME PERIOD.  The important point that you must remember when writing an essay in IELTS Task 1 is that:
  • 17.
    In 1918 householdsin owned accommodations were approximately 23%. Their numbers increased to almost 32% in 1939 and stayed there till 1953. Then, the figures improved significantly from around 32% to almost 68% in between 1953 and 2001. However, they slightly dropped to about 64% in 2011. As far as households in rented accommodations were concerned, 1918 was the boom year with figures reaching as high as almost 80%, however, they started to drop afterwards. Though they remained constant at around 68% between 1939 and 1953, they continued to go down and reached only 30 % in 2001. In the year 2011 they slightly increased to around 36%. The chart shows the percentage of households in owned and rented accommodation in England and Wales between 1918 and 2011 Summarise the information by selecting and reporting the main features and make comparisons where relevant. An essay on a dynamic chart.
  • 18.
    The charts belowshow what the UK graduate and postgraduate students who did not go into full-time work did after leaving college in 2008. Summarize the information by selecting and reporting the main features and make comparisons where relevant. An essay on a static chart. Majority of both undergraduate and postgraduate students went for higher studies. Almost thirty thousand graduate students opted for further study and 2725 postgraduate students went for higher studies. There was a significant difference between the student undergoing part-time work and higher studies among the undergraduate. While for the postgraduates this the difference was negligible Almost eighteen thousand undergraduate students took a part-time job compared to the twenty-five hundred postgraduate. Student opting for voluntary work was the lowest choice in both cases. It is also noticeable that a large proportion of undergraduate and post-graduate students were unemployed after the completion of their degree, that is about 16,236 and 1,625 respectively.
  • 19.
    for watching This isthe end of this presentation For a complete IELTS training course and practice. Visit: www.ieltsbackup.com Send us your feedback and suggestions on info@ieltsbackup.com
  • 20.
    Hi, I have developeda systematic approach for all question types frequently appearing in IELTS. Students who tired them in their IELTS exams have received amazing results. (Zafar Yar Khan) Author and Publisher If you need help in achieving your goals in IELTS, write to me at info@ieltsbackup.com or visit www.ieltsbackup.com and click on “IELTS Tuition”. I will contact you as soon as I can.