Downloaded 735 times


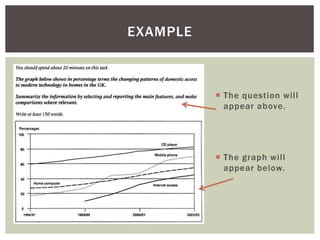

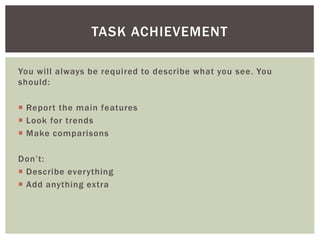
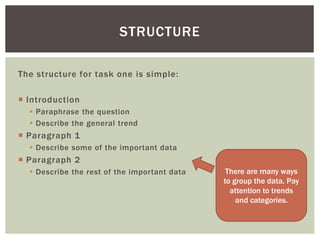

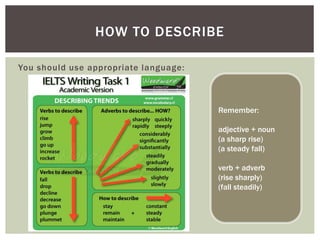
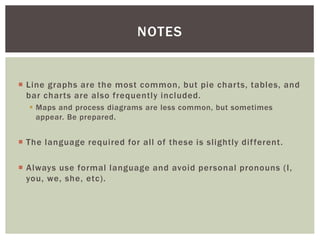

The document provides an overview of IELTS Writing Task 1, outlining its purpose, which is to assess one's ability to organize ideas and accurately describe visual data such as tables, graphs, and charts. It emphasizes the importance of reporting main features and making comparisons, along with a recommended structure for responses. Key tips include focusing on trends, using appropriate language, and adhering to a minimum word count of 150 within a 20-minute time frame.


![IELTS Revision - Task 1 Writing (1) [Autosaved] v2.pptx](https://cdn.slidesharecdn.com/ss_thumbnails/ieltsrevision-task1writing1autosavedv2-230814121437-d82ee472-thumbnail.jpg?width=640&height=640&fit=bounds)


