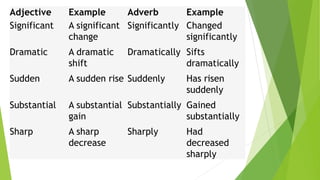
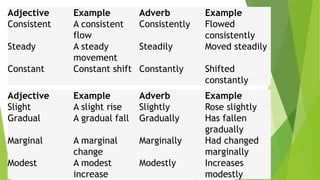
This document provides guidance on writing Task 1 of the IELTS Academic Writing exam. It addresses how to summarize charts and graphs in 3 paragraphs within 20 minutes. The introductory paragraph should restate the title and topic. The second and third paragraphs should group the information into trends, exceptions, and other categories. The conclusion should summarize the overall trends. Writers are advised to use appropriate vocabulary like percentages and fractions, and verbs and adjectives that accurately describe changes over time. Care should be taken to remain objective and use the correct verb tenses corresponding to the timeframes depicted.


![IELTS Revision - Task 1 Writing (1) [Autosaved] v2.pptx](https://cdn.slidesharecdn.com/ss_thumbnails/ieltsrevision-task1writing1autosavedv2-230814121437-d82ee472-thumbnail.jpg?width=640&height=640&fit=bounds)


