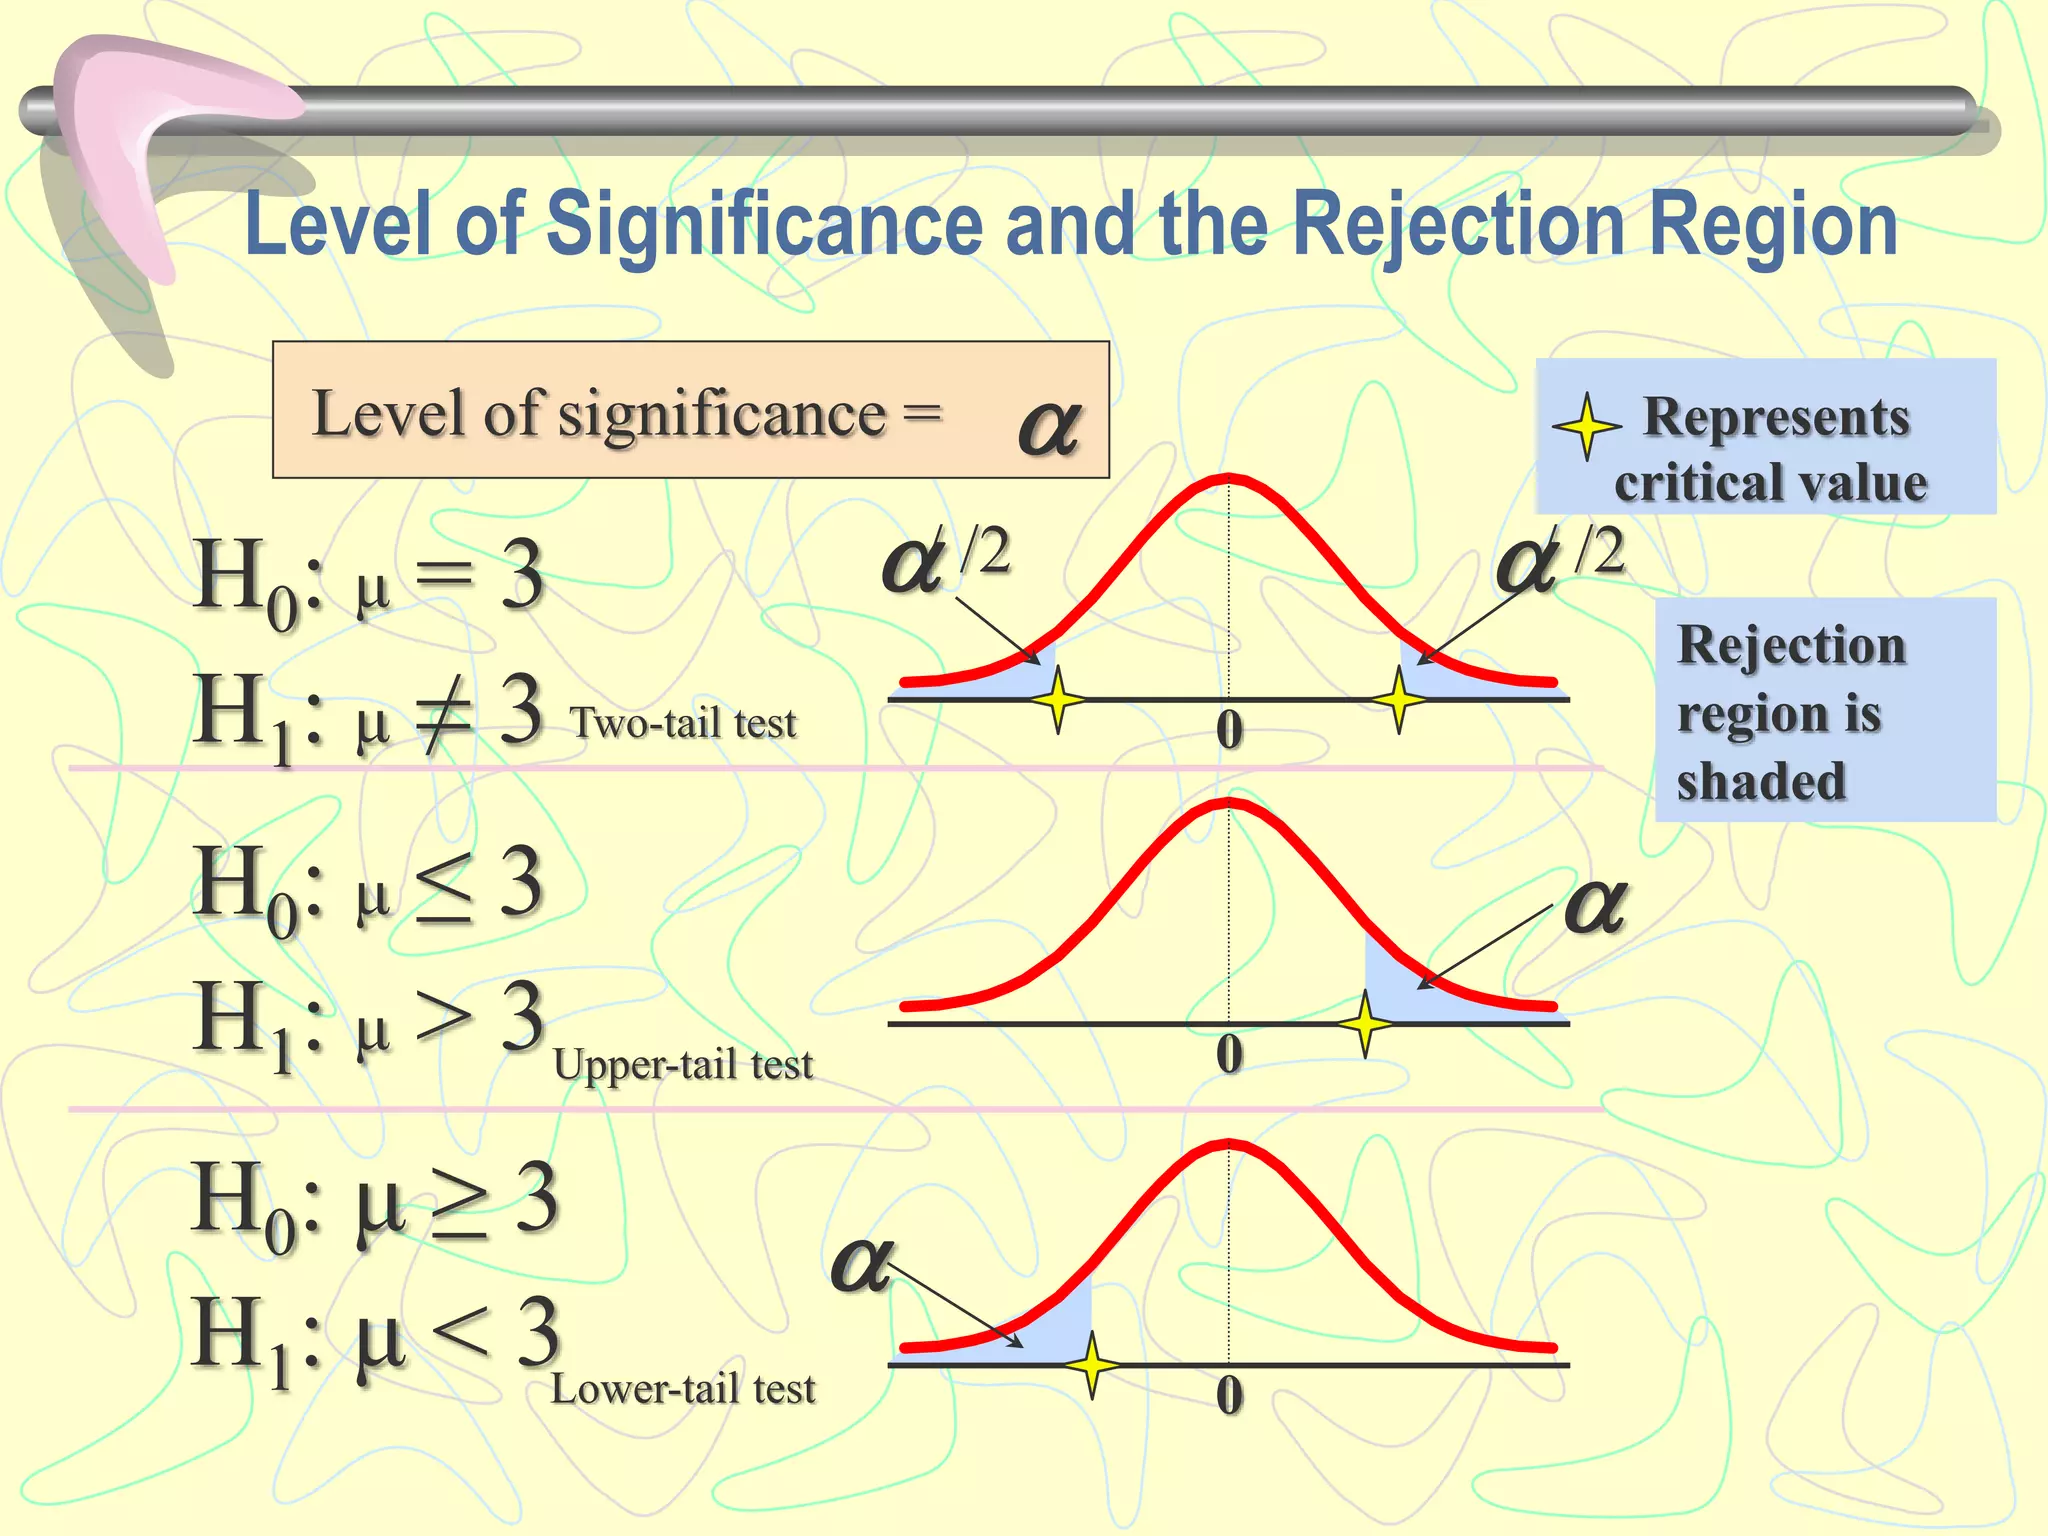
Hypothesis Testing
presented by
UVISE P M
What is a Hypothesis?
 A premise or claim that we want to test
“A hypothesis is a conjectural statement of the relation
between two or more variables”. (Kerlinger, 1956)
1. A Hypothesis must be conceptually clear
- concepts should be clearly defined
- the definitions should be commonly accepted
- the definitions should be easily communicable
2. The hypothesis should have empirical reference
- Variables in the hypothesis should be empirical realities
- If they are not it would not be possible to make the observation and
ultimately the test
3. The Hypothesis must be specific
- Place, situation and operation
Characteristics of a Testable Hypothesis
4. A hypothesis should be related to available techniques of
research
- Either the techniques are already available or
- The researcher should be in a position to develop suitable
techniques
5. The hypothesis should be related to a body of theory
- Hypothesis has to be supported by theoretical argumentation
- It should depend on the existing body of knowledge
In this way
- the study could benefit from the existing knowledge and
- later on through testing the hypothesis could contribute to the reservoir of
knowledge
Characteristics of a Testable Hypothesis
Categorizing Hypotheses
Can be categorized in different ways
Based on their formulation
• Null Hypotheses
• Alternate Hypotheses
The Null Hypothesis, H0
• States the claim or assertion to be tested
• Is always about a population parameter, not about a sample
statistic
• Begin with the assumption that the null hypothesis is true
– Similar to the notion of innocent until
proven guilty
• Always contains “=” , “≤” or “” sign
• May or may not be rejected
• It states that independent variable has no effect and there
will be no difference b/w the two groups.
The Alternative Hypothesis, H1
• Is the opposite of the null hypothesis
• Challenges the status quo
• Never contains the “=” , “≤” or “” sign
• May or may not be proven
• Is generally the hypothesis that the researcher is trying to
prove
• It states that independent variable has an effect and
there will be a difference b/w the two groups.
Level of Significance, 
• Defines the unlikely values of the sample statistic if the null
hypothesis is true
• Indicates the percentage of sample means that is outside the cut-off
limits (critical value)
• It is the max. value of probability of rejecting null hypothesis when it
is true.
– Defines rejection region of the sampling distribution
• Is designated by  , (level of significance)
– Typical values are 0.01, 0.05, or 0.10
• Is selected by the researcher at the beginning
• Provides the critical value(s) of the test
Level of Significance and the Rejection Region
H0: μ ≥ 3
H1: μ < 3 0
H0: μ ≤ 3
H1: μ > 3


Represents
critical value
Lower-tail test
Level of significance = 
0Upper-tail test
Two-tail test
Rejection
region is
shaded
/ /2
0
/ /2H0: μ = 3
H1: μ ≠ 3
Types of Errors…
A Type I error occurs when we reject a true null hypothesis
(i.e. Reject H0 when it is TRUE)
A Type II error occurs when we don’t reject a false null
hypothesis (i.e. Do NOT reject H0 when it is FALSE)
H0 T F
Reject Type I( )
Correct
decision
Fail to Reject
Correct
decision
Type II( )


• The probability of a Type I error is denoted as α (Greek
letter alpha). The probability of a type II error is β
(Greek letter beta).
• The two probabilities are inversely related. Decreasing
one increases the other, for a fixed sample size.
• In other words, you can’t have  and β both real small
for any old sample size. You may have to take a much
larger sample size, or in the court example, you need
much more evidence.
Type I & II Error Relationship
 Type I and Type II errors cannot happen at the same
time
 Type I error can only occur if H0 is true
 Type II error can only occur if H0 is false
If Type I error probability (  ) , then
Type II error probability ( β )
One-Tail Test
• In many cases, the alternative hypothesis focuses on a particular
direction
• Determines whether a particular population parameter is larger or
smaller than some predefined value
• Uses one critical value of test statistic
H0: μ ≥ 3
H1: μ < 3
H0: μ ≤ 3
H1: μ > 3
This is a lower-tail test since the alternative
hypothesis is focused on the lower tail below the
mean of 3
This is an upper-tail test since the alternative
hypothesis is focused on the upper tail above the
mean of 3
Two tailed test
• Two-tailed Test
• Determines the
likelihood that a
population parameter
is within certain upper
and lower bounds
• May use one or two
critical values

Hypothesis

  • 1.
  • 2.
    What is aHypothesis?  A premise or claim that we want to test “A hypothesis is a conjectural statement of the relation between two or more variables”. (Kerlinger, 1956)
  • 3.
    1. A Hypothesismust be conceptually clear - concepts should be clearly defined - the definitions should be commonly accepted - the definitions should be easily communicable 2. The hypothesis should have empirical reference - Variables in the hypothesis should be empirical realities - If they are not it would not be possible to make the observation and ultimately the test 3. The Hypothesis must be specific - Place, situation and operation Characteristics of a Testable Hypothesis
  • 4.
    4. A hypothesisshould be related to available techniques of research - Either the techniques are already available or - The researcher should be in a position to develop suitable techniques 5. The hypothesis should be related to a body of theory - Hypothesis has to be supported by theoretical argumentation - It should depend on the existing body of knowledge In this way - the study could benefit from the existing knowledge and - later on through testing the hypothesis could contribute to the reservoir of knowledge Characteristics of a Testable Hypothesis
  • 5.
    Categorizing Hypotheses Can becategorized in different ways Based on their formulation • Null Hypotheses • Alternate Hypotheses
  • 6.
    The Null Hypothesis,H0 • States the claim or assertion to be tested • Is always about a population parameter, not about a sample statistic • Begin with the assumption that the null hypothesis is true – Similar to the notion of innocent until proven guilty • Always contains “=” , “≤” or “” sign • May or may not be rejected • It states that independent variable has no effect and there will be no difference b/w the two groups.
  • 7.
    The Alternative Hypothesis,H1 • Is the opposite of the null hypothesis • Challenges the status quo • Never contains the “=” , “≤” or “” sign • May or may not be proven • Is generally the hypothesis that the researcher is trying to prove • It states that independent variable has an effect and there will be a difference b/w the two groups.
  • 8.
    Level of Significance, • Defines the unlikely values of the sample statistic if the null hypothesis is true • Indicates the percentage of sample means that is outside the cut-off limits (critical value) • It is the max. value of probability of rejecting null hypothesis when it is true. – Defines rejection region of the sampling distribution • Is designated by  , (level of significance) – Typical values are 0.01, 0.05, or 0.10 • Is selected by the researcher at the beginning • Provides the critical value(s) of the test
  • 9.
    Level of Significanceand the Rejection Region H0: μ ≥ 3 H1: μ < 3 0 H0: μ ≤ 3 H1: μ > 3   Represents critical value Lower-tail test Level of significance =  0Upper-tail test Two-tail test Rejection region is shaded / /2 0 / /2H0: μ = 3 H1: μ ≠ 3
  • 10.
    Types of Errors… AType I error occurs when we reject a true null hypothesis (i.e. Reject H0 when it is TRUE) A Type II error occurs when we don’t reject a false null hypothesis (i.e. Do NOT reject H0 when it is FALSE) H0 T F Reject Type I( ) Correct decision Fail to Reject Correct decision Type II( )  
  • 11.
    • The probabilityof a Type I error is denoted as α (Greek letter alpha). The probability of a type II error is β (Greek letter beta). • The two probabilities are inversely related. Decreasing one increases the other, for a fixed sample size. • In other words, you can’t have  and β both real small for any old sample size. You may have to take a much larger sample size, or in the court example, you need much more evidence.
  • 12.
    Type I &II Error Relationship  Type I and Type II errors cannot happen at the same time  Type I error can only occur if H0 is true  Type II error can only occur if H0 is false If Type I error probability (  ) , then Type II error probability ( β )
  • 13.
    One-Tail Test • Inmany cases, the alternative hypothesis focuses on a particular direction • Determines whether a particular population parameter is larger or smaller than some predefined value • Uses one critical value of test statistic H0: μ ≥ 3 H1: μ < 3 H0: μ ≤ 3 H1: μ > 3 This is a lower-tail test since the alternative hypothesis is focused on the lower tail below the mean of 3 This is an upper-tail test since the alternative hypothesis is focused on the upper tail above the mean of 3
  • 15.
    Two tailed test •Two-tailed Test • Determines the likelihood that a population parameter is within certain upper and lower bounds • May use one or two critical values