Download as PDF, PPTX
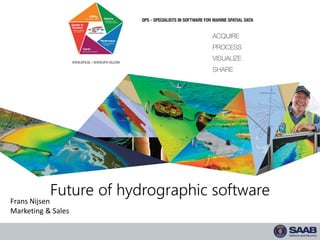
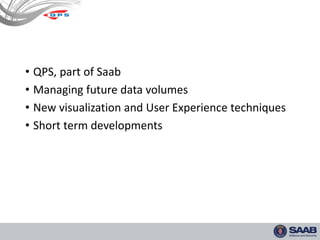


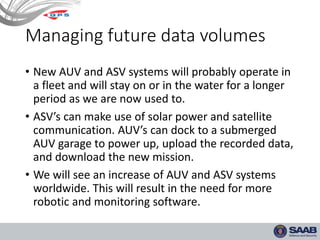


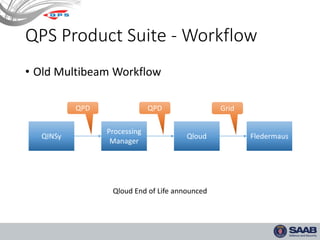


The document discusses future developments in hydrographic software by QPS. It summarizes that QPS will focus on managing increasing data volumes from new sensor technologies through real-time processing and cloud computing. New visualization and user experience techniques will be needed to analyze larger and more complex 4D datasets. QPS will integrate new sensors like sub-bottom profilers and ADCPs into its software suite and optimize workflows. Short term developments at QPS include changes to its product suite and a new feedback voting system.


