Download as PDF, PPTX

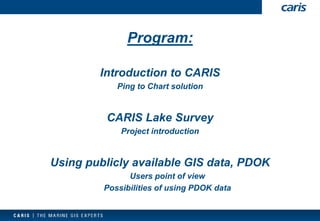
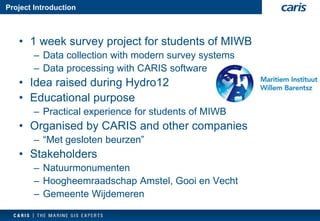
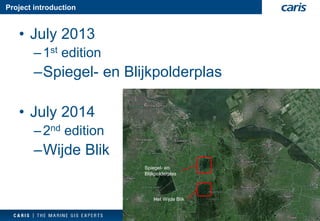
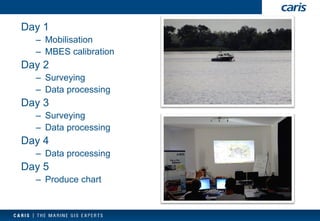
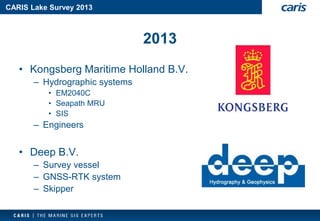
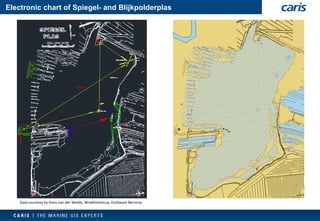
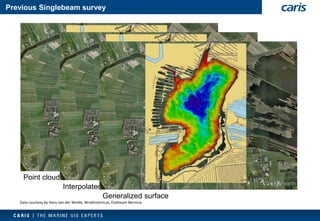
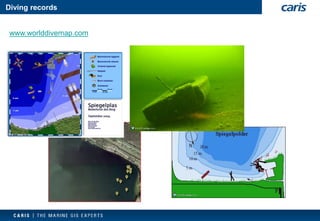
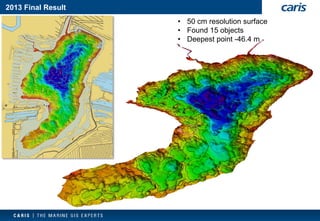
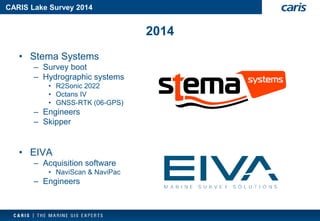
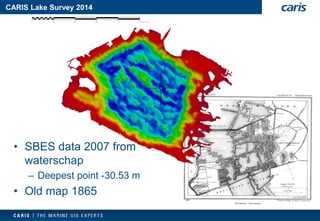
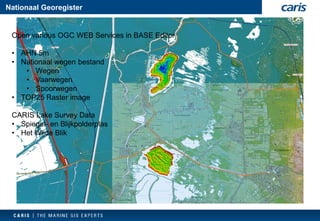
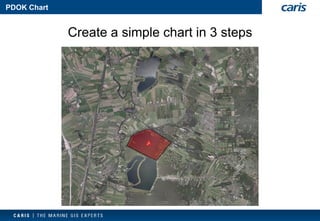
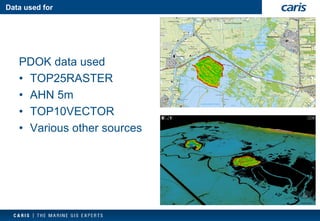
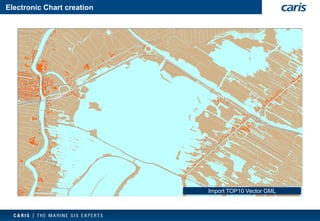
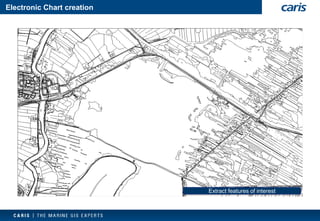
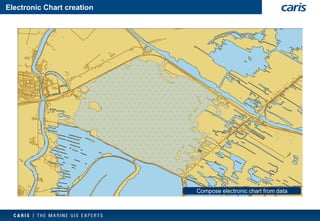
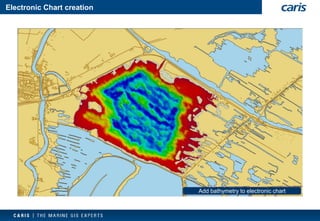
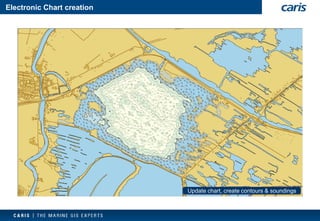
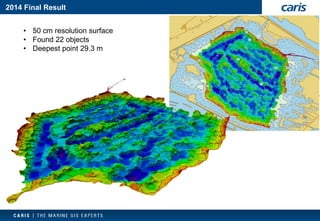
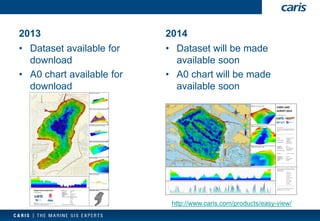


The document summarizes a presentation on CARIS Lake Survey, a project using hydrographic survey data and CARIS software. Students conduct a week-long survey of a lake, collecting data with modern systems and processing it in CARIS. In 2013 they surveyed Spiegel-en Blijkpolderplas lake, finding 15 objects and a maximum depth of 46.4 meters. In 2014 they surveyed Wijde Blik lake, finding 22 objects and a maximum depth of 29.3 meters. The data and charts are made available online.


