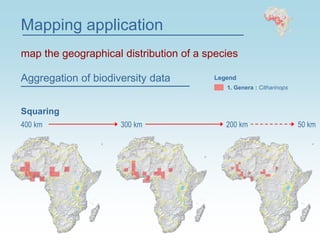
FAUNAFRIFAUNAFRI
act to save the freshwater biodiversity beyond our borders
Conception and development
Rainer Zaiss
IRD Secteur Cartographie
32, Avenue Henry Varagnat
9343 Bondy
Scientific responsibility
Didier Paugy
Antenne IRD
MNHN – DMPA
75231 Paris cedex 05
Claroteidae ChrysichthysAlestidae Hydrocynus Aplocheilidae Aphyosemion Amphilidae Amphilus Tetraodontidae Tetraodon
act to save the freshwater biodiversity beyond our borders
Use of SVG to map
the geographical distribution of
fish species in Africa
Institut de recherche
pour le développement
French public science and technology
research institute
IRD conducts scientific programs contributing to
the development of the countries of the South
with an emphasis on the relationship between
man and the environment
• 2 200 employees
• 30 centers around the world
• A budget of 220 million euros
• 66 research and service units
key figures
Claroteidae Chrysichthys
 Build up a centralized geographical
information system to compile,
conserve and share biodiversity data of
fresh and brackish waters fish species in
Africa.
 Develop a Graphical User Interface (GUI)
to map, compare and analyze the
distribution of families, genera and
species from the continental level down
to the sample site.
FAUNAFRIFAUNAFRI
Museum of Natural History in Paris
act to save the freshwater biodiversity beyond our bordersact to save the freshwater biodiversity beyond our borders
Fish collection
 High species richness (around 3500 species)
 High numbers of endemic species
 Africa’s freshwater systems are being degraded at an alarming rate
 IUCN Red List 2006 (61 species critically endangered , 116 endangered, 152
vulnerable)
 Many of Africa's fresh waters are yet to be explored
 Much taxonomic work remains to be completed
 According to IUCN, lack of basic information on species
distribution and threatened status is a key obstacle facing
freshwater ecosystem managers in Africa.
Some facts about the distribution of fresh
and brackish waters fish species in Africa
Baseline map
Sources of information
Source Type Thematic
GNS Point Place names
VMAP0 Poly/Line Hydrographie
DCW Poly Wetlands
VMAP0 Line Coastline
SRTM Raster Topography
VMAP0 Line International border
MODIS Raster Landcover
RasterImage
RasterClassification
Landcover
RasterElevation
RasterHillshade
Topography
LineInternational boundary
PolyWetlands
LineRivers
Hydrography
Estuaries
Lakes
Main rivers
PolyIchthyological regions
PolyDrainage bassins
Poly
Poly
Poly
TypeThematic
“Geoprocessing”
GIS FAUNAFRI
The biodiversity data
Data providers
Tetraodontidae Tetraodon
Claroteidae Chrysichthys
Latidae Lates
Citharinidae Citharinus
Aplocheilidae Aphyosemion
0 25 000 50 000
(MRAC) Musée Royal de l'Afrique Centrale, Belgium
(Others) IRD and Scientific Literature
(BMNH) Natural History Museum, U.K.
(SAIAB) South African Institute for Aquatic Biodiversity, South Africa
(MNHN) Muséum National d'Histoire naturelle, France
(USNM) National Museum of Natural History, Washington D.C., U.S.A.
(AMNH) American Museum of Natural History, New York, U.S.A.
(NMZB) Natural History Museum of Zimbabwe
(KMMA) Koninklijk Museum voor Midden-Afrika, Belgium
(ZMH) Zoologisches Museum der Humboldt Universität, Germany
Other museum collections
number of samples
0
5 000
10 000
15 000
20 000
25 000
<19001900-19101910-19201920-19301930-19401940-19501950-19601960-19701970-19801980-19901990-20002000-2010
period
numberofsamples
Alestidae Brycinus
The biodiversity data
number of samples by 10 year period
Claroteidae Chrysichthys
Alestidae Hydrocynus
Amphilidae Amphilus
Tetraodontidae Tetraodon
Country
Ichthyologic region
Drainage basin
Ruzizi 1
Georeferencing
Biodiversity data Amphilidae Amphilus
Burundi N
Tanganyika 1
Lake Tanganyika 1
GIS FAUNAFRI
River
Lake
Estuary
Wetland
Grande Rusizi N
1
1
1
Hydrography
Geography
Sample site
Mapping application
map the geographical distribution of a species
Aggregation of biodiversity data
Sample site Drainage basin Ichthyological region
Geography
Legend
1. Genera : Citharinops
Aggregation of biodiversity data
Mapping application
map the geographical distribution of a species
400 km 300 km 200 km 50 km
Squaring
Legend
1. Genera : Citharinops
1
Mapping application
compare the geographical distribution of different species
2. Genera : Citharidium+1. Genera : Citharinops
Overlay + 25% transparency Typology=
1. Genera : Citharinops
2. Genera : Citharidium
1 + 2
2 2
1
=
2
1
3
1 + 2 + 3
3
4
1 + 2 + 3 + 4
42
1
3
Filter feColorMatrix + opacity
Mapping application
compare the geographical distribution of different species
25 % 50 % 0 %
Opacity
Red: 1,0,0,0,0,
Green: 0,1,0,0,0,
Blue: 0,0,1,0,0,
Alpha: 0,0,0,4,0
Mapping application
dynamic and comprehensible legends
Mapping application
geography as entry point
Species information
Click Information panel
Information Window
Mapping application
geography as entry point
Information WindowGeography windowSource Window
0 1,500 km 0 540 km
Level 3
0 324 km
Level 5
0 194 km
Level 6
0 117 km
Level 7
0 70 km
Level 8
0 42 km
Level 9
Mapping application
level of detail and symbology depending on map scale
Level 1
0 15 km
Level 11
Mapping application
toolkits / APIs to put in place the application
 Evaluation of different SVG and flash based web mapping toolkits
 They did not really offer out of the box the necessary functionalities to develop
the application…
 Framework from Carto:Net
 Flexible SVG full web mapping API
SVG GUI elementsTemplate navigation and
Alestidae Hydrocynus
first version of FAUNAFRI
http://www.ird.fr/poissons-afrique/faunafri/
 First loading of the page takes too long
 We have to change slightly the architecture of the application
 Work on database issues and data quality
End of 2007
2008
 SVG, Flash or Open layers ?
2009
 Target Microsoft IE + Adobe SVG plug-in
 Microsoft announced to implement SVG natively into IE9
2010
 Final version with carto:net API and SVG ?
Architecture first version
Vector data Raster data
 Graphical User Interface (GUI) SVG Scalable Vector Graphics
XML /
JSON
Ajax png
<g id="HY“/>
Client server data loading
AJAX request
http://...sendGeom.php?layer=HY& xul=4000& yul =4000 & xlr=6000 & ylr=2000 & timestamp=12000
XML fragment
<g id="HY_geom" attrib:timestamp=“12000” >
<path d="M 4000 ...></g>
Zoom
Javascript
1. Timestamp: 1200
2. Area of interest (xul: 4000, yul: 4000, xlr: 6000, ylr: 2000)
if map window timestamp = xml timestamp
<g id="HY_geom" attrib:timestamp=“12000” >
<path d="M 4000 ...></g>
Source: Williams, J., Neumann, A (2006): Dynamic Loading of Vector Geodata for SVG Mapping Applications Using Postgis, PHP and
getURL()/XMLHttpRequest(). http://www.carto.net/papers/svg/postgis_geturl_xmlhttprequest/.
Timestamp:
12000
Timestamp:
12000
Timestamp:
13000
<g id="HY_geom" attrib:timestamp=“12000” >
<path d="M 4000 ...></g>
<g id="HY_geom" attrib:timestamp=“13000” >
<path d="M 3000 ...></g>
Delete child group
<g id="HY“/>
Client server data loading
Source: Williams, J., Neumann, A (2006): Dynamic Loading of Vector Geodata for SVG Mapping Applications Using Postgis, PHP and
getURL()/XMLHttpRequest(). http://www.carto.net/papers/svg/postgis_geturl_xmlhttprequest/.
if map window timestamp = xml timestamp
AJAX request
http://...sendGeom.php?layer=HY& xul=3000& yul =3000 & xlr=5000 & ylr=1000 & timestamp=13000
XML fragment
<g id="HY_geom" attrib:timestamp=“13000” >
<path d="M 3000 ...></g>
Zoom
Javascript
1. Timestamp: 13000
2. Area of interest (xul: 3000, yul: 3000, xlr: 5000, ylr: 1000)
+ Add new geometry
<g id="HY_geom" attrib:timestamp=“14000” >
<path d="M 4000 ...></g>
Timestamp:
13000
Client server data loading
AJAX request
http://...sendGeom.php?layer=HY& xul=4000& yul =4000 & xlr=6000 & ylr=2000 & timestamp=14000
XML fragment
<g id="HY_geom" attrib:timestamp=“14000” >
<path d="M 4000 ...></g>
Zoom
Javascript
1. Timestamp: 1400
2. Area of interest (xul: 4000, yul: 4000, xlr: 6000, ylr: 2000)
if map window timestamp = xml timestamp
Source: Williams, J., Neumann, A (2006): Dynamic Loading of Vector Geodata for SVG Mapping Applications Using Postgis, PHP and
getURL()/XMLHttpRequest(). http://www.carto.net/papers/svg/postgis_geturl_xmlhttprequest/.
Timestamp:
14000
Delete child group + Add new geometry
<g id="HY_geom" attrib:timestamp=“13000” >
<path d="M 3000 ...></g>
<g id="HY“/>
 Timestamp
 No server or client side caching
 Reloading of data for previous visited areas
 Extraction of the exact coordinates of the area of interest
 No predictive fetch
 Loading of the total data even for slightly different areas
Client server data loading
disadvantages of the carto:net method
<path id=“HYC3” d="M 1500 .../>
Client server data loading
AJAX requests for missing tiles
1. http://...sendGeom.php?layer=HY& index=C3
…
4. http://...sendGeom.php?layer=HY& index=D4
XML fragments of missing tiles
1. <path id=“HYC3” d="M 1500 .../>
2. <path id=“HYC4” d="M 3500 .../>
3. <path id=“HYD3” d="M 1500 .../>
4. <path id=“HYD4” d="M 3500 .../>
<g id="HY“/>
<path id=“HYC4” d="M 3500 .../>
<path id=“HYD3” d="M 1500 .../>
<path id=“HYD4” d="M 3500 .../>
Append childs
A0 A1 A2 A3 A4 A5
B0 B1 B2 B3 A4 A5
C0 C1 C2 C3 C4 C5
D0 D1 D2 D3 D4 D5
E0 E1 E2 E3 E4 E5
F0 F1 F2 F3 F4 F5
Zoom
Javascript
Loop to identify tiles hat are necessary to cover the area of interest : C3, C4, D3, D4
Tiles already loaded: -
Append childs
<path id=“HYC3” d="M 1500 .../>
Client server data loading
Append childs
<g id="HY“/>
<path id=“HYC4” d="M 3500 .../>
<path id=“HYD3” d="M 1500 .../>
<path id=“HYD4” d="M 3500 .../>
<path id=“HYE3” d="M 1500 .../>
<path id=“HYE4” d="M 1500 .../>
AJAX requests for missing tiles
1. http://...sendGeom.php?layer=HY& index=E3
2. http://...sendGeom.php?layer=HY& index=E4
XML fragments of missing tiles
1. <path id=“HYE3” d="M 1500 .../>
2. <path id=“HYE4” d="M 3500 .../>
A0 A1 A2 A3 A4 A5
B0 B1 B2 B3 A4 A5
C0 C1 C2 C3 C4 C5
D0 D1 D2 D3 D4 D5
E0 E1 E2 E3 E4 E5
F0 F1 F2 F3 F4 F5
Zoom
Javascript
Loop to identify tiles hat are necessary to cover the area of interest : D3, D4, E3, E4
Tiles already loaded: C3, C4, D3, D4
 Client and server based caching is possible
 Predictive fetch
 No reloading of data for previous visited areas
Client server data loading
advantages of the tile based method
Claroteidae Chrysichthys Amphilidae Amphilus Tetraodontidae Tetraodon Latidae Lates
Thank you / Questions
Museum of Natural History in Paris Fish collection
The project FAUNAFRI has received funds from IRD.
We would like in particular to acknowledge the major contributions to the project provided by
N. Rahmani, L. Ruhier, J.J. Troubat and M. Vienne.

Faunafri svg open

  • 1.
    FAUNAFRIFAUNAFRI act to savethe freshwater biodiversity beyond our borders Conception and development Rainer Zaiss IRD Secteur Cartographie 32, Avenue Henry Varagnat 9343 Bondy Scientific responsibility Didier Paugy Antenne IRD MNHN – DMPA 75231 Paris cedex 05 Claroteidae ChrysichthysAlestidae Hydrocynus Aplocheilidae Aphyosemion Amphilidae Amphilus Tetraodontidae Tetraodon act to save the freshwater biodiversity beyond our borders Use of SVG to map the geographical distribution of fish species in Africa
  • 2.
    Institut de recherche pourle développement French public science and technology research institute IRD conducts scientific programs contributing to the development of the countries of the South with an emphasis on the relationship between man and the environment • 2 200 employees • 30 centers around the world • A budget of 220 million euros • 66 research and service units key figures
  • 3.
    Claroteidae Chrysichthys  Buildup a centralized geographical information system to compile, conserve and share biodiversity data of fresh and brackish waters fish species in Africa.  Develop a Graphical User Interface (GUI) to map, compare and analyze the distribution of families, genera and species from the continental level down to the sample site. FAUNAFRIFAUNAFRI Museum of Natural History in Paris act to save the freshwater biodiversity beyond our bordersact to save the freshwater biodiversity beyond our borders Fish collection
  • 4.
     High speciesrichness (around 3500 species)  High numbers of endemic species  Africa’s freshwater systems are being degraded at an alarming rate  IUCN Red List 2006 (61 species critically endangered , 116 endangered, 152 vulnerable)  Many of Africa's fresh waters are yet to be explored  Much taxonomic work remains to be completed  According to IUCN, lack of basic information on species distribution and threatened status is a key obstacle facing freshwater ecosystem managers in Africa. Some facts about the distribution of fresh and brackish waters fish species in Africa
  • 5.
    Baseline map Sources ofinformation Source Type Thematic GNS Point Place names VMAP0 Poly/Line Hydrographie DCW Poly Wetlands VMAP0 Line Coastline SRTM Raster Topography VMAP0 Line International border MODIS Raster Landcover RasterImage RasterClassification Landcover RasterElevation RasterHillshade Topography LineInternational boundary PolyWetlands LineRivers Hydrography Estuaries Lakes Main rivers PolyIchthyological regions PolyDrainage bassins Poly Poly Poly TypeThematic “Geoprocessing” GIS FAUNAFRI
  • 6.
    The biodiversity data Dataproviders Tetraodontidae Tetraodon Claroteidae Chrysichthys Latidae Lates Citharinidae Citharinus Aplocheilidae Aphyosemion 0 25 000 50 000 (MRAC) Musée Royal de l'Afrique Centrale, Belgium (Others) IRD and Scientific Literature (BMNH) Natural History Museum, U.K. (SAIAB) South African Institute for Aquatic Biodiversity, South Africa (MNHN) Muséum National d'Histoire naturelle, France (USNM) National Museum of Natural History, Washington D.C., U.S.A. (AMNH) American Museum of Natural History, New York, U.S.A. (NMZB) Natural History Museum of Zimbabwe (KMMA) Koninklijk Museum voor Midden-Afrika, Belgium (ZMH) Zoologisches Museum der Humboldt Universität, Germany Other museum collections number of samples
  • 7.
    0 5 000 10 000 15000 20 000 25 000 <19001900-19101910-19201920-19301930-19401940-19501950-19601960-19701970-19801980-19901990-20002000-2010 period numberofsamples Alestidae Brycinus The biodiversity data number of samples by 10 year period Claroteidae Chrysichthys Alestidae Hydrocynus Amphilidae Amphilus Tetraodontidae Tetraodon
  • 8.
    Country Ichthyologic region Drainage basin Ruzizi1 Georeferencing Biodiversity data Amphilidae Amphilus Burundi N Tanganyika 1 Lake Tanganyika 1 GIS FAUNAFRI River Lake Estuary Wetland Grande Rusizi N 1 1 1 Hydrography Geography Sample site
  • 9.
    Mapping application map thegeographical distribution of a species Aggregation of biodiversity data Sample site Drainage basin Ichthyological region Geography Legend 1. Genera : Citharinops
  • 10.
    Aggregation of biodiversitydata Mapping application map the geographical distribution of a species 400 km 300 km 200 km 50 km Squaring Legend 1. Genera : Citharinops
  • 11.
    1 Mapping application compare thegeographical distribution of different species 2. Genera : Citharidium+1. Genera : Citharinops Overlay + 25% transparency Typology= 1. Genera : Citharinops 2. Genera : Citharidium 1 + 2 2 2 1 = 2 1 3 1 + 2 + 3 3 4 1 + 2 + 3 + 4 42 1 3
  • 12.
    Filter feColorMatrix +opacity Mapping application compare the geographical distribution of different species 25 % 50 % 0 % Opacity Red: 1,0,0,0,0, Green: 0,1,0,0,0, Blue: 0,0,1,0,0, Alpha: 0,0,0,4,0
  • 13.
    Mapping application dynamic andcomprehensible legends
  • 14.
    Mapping application geography asentry point Species information Click Information panel Information Window
  • 15.
    Mapping application geography asentry point Information WindowGeography windowSource Window
  • 16.
    0 1,500 km0 540 km Level 3 0 324 km Level 5 0 194 km Level 6 0 117 km Level 7 0 70 km Level 8 0 42 km Level 9 Mapping application level of detail and symbology depending on map scale Level 1 0 15 km Level 11
  • 17.
    Mapping application toolkits /APIs to put in place the application  Evaluation of different SVG and flash based web mapping toolkits  They did not really offer out of the box the necessary functionalities to develop the application…  Framework from Carto:Net  Flexible SVG full web mapping API SVG GUI elementsTemplate navigation and
  • 18.
    Alestidae Hydrocynus first versionof FAUNAFRI http://www.ird.fr/poissons-afrique/faunafri/  First loading of the page takes too long  We have to change slightly the architecture of the application  Work on database issues and data quality End of 2007 2008  SVG, Flash or Open layers ? 2009  Target Microsoft IE + Adobe SVG plug-in  Microsoft announced to implement SVG natively into IE9 2010  Final version with carto:net API and SVG ?
  • 19.
    Architecture first version Vectordata Raster data  Graphical User Interface (GUI) SVG Scalable Vector Graphics XML / JSON Ajax png
  • 20.
    <g id="HY“/> Client serverdata loading AJAX request http://...sendGeom.php?layer=HY& xul=4000& yul =4000 & xlr=6000 & ylr=2000 & timestamp=12000 XML fragment <g id="HY_geom" attrib:timestamp=“12000” > <path d="M 4000 ...></g> Zoom Javascript 1. Timestamp: 1200 2. Area of interest (xul: 4000, yul: 4000, xlr: 6000, ylr: 2000) if map window timestamp = xml timestamp <g id="HY_geom" attrib:timestamp=“12000” > <path d="M 4000 ...></g> Source: Williams, J., Neumann, A (2006): Dynamic Loading of Vector Geodata for SVG Mapping Applications Using Postgis, PHP and getURL()/XMLHttpRequest(). http://www.carto.net/papers/svg/postgis_geturl_xmlhttprequest/. Timestamp: 12000
  • 21.
    Timestamp: 12000 Timestamp: 13000 <g id="HY_geom" attrib:timestamp=“12000”> <path d="M 4000 ...></g> <g id="HY_geom" attrib:timestamp=“13000” > <path d="M 3000 ...></g> Delete child group <g id="HY“/> Client server data loading Source: Williams, J., Neumann, A (2006): Dynamic Loading of Vector Geodata for SVG Mapping Applications Using Postgis, PHP and getURL()/XMLHttpRequest(). http://www.carto.net/papers/svg/postgis_geturl_xmlhttprequest/. if map window timestamp = xml timestamp AJAX request http://...sendGeom.php?layer=HY& xul=3000& yul =3000 & xlr=5000 & ylr=1000 & timestamp=13000 XML fragment <g id="HY_geom" attrib:timestamp=“13000” > <path d="M 3000 ...></g> Zoom Javascript 1. Timestamp: 13000 2. Area of interest (xul: 3000, yul: 3000, xlr: 5000, ylr: 1000) + Add new geometry
  • 22.
    <g id="HY_geom" attrib:timestamp=“14000”> <path d="M 4000 ...></g> Timestamp: 13000 Client server data loading AJAX request http://...sendGeom.php?layer=HY& xul=4000& yul =4000 & xlr=6000 & ylr=2000 & timestamp=14000 XML fragment <g id="HY_geom" attrib:timestamp=“14000” > <path d="M 4000 ...></g> Zoom Javascript 1. Timestamp: 1400 2. Area of interest (xul: 4000, yul: 4000, xlr: 6000, ylr: 2000) if map window timestamp = xml timestamp Source: Williams, J., Neumann, A (2006): Dynamic Loading of Vector Geodata for SVG Mapping Applications Using Postgis, PHP and getURL()/XMLHttpRequest(). http://www.carto.net/papers/svg/postgis_geturl_xmlhttprequest/. Timestamp: 14000 Delete child group + Add new geometry <g id="HY_geom" attrib:timestamp=“13000” > <path d="M 3000 ...></g> <g id="HY“/>
  • 23.
     Timestamp  Noserver or client side caching  Reloading of data for previous visited areas  Extraction of the exact coordinates of the area of interest  No predictive fetch  Loading of the total data even for slightly different areas Client server data loading disadvantages of the carto:net method
  • 24.
    <path id=“HYC3” d="M1500 .../> Client server data loading AJAX requests for missing tiles 1. http://...sendGeom.php?layer=HY& index=C3 … 4. http://...sendGeom.php?layer=HY& index=D4 XML fragments of missing tiles 1. <path id=“HYC3” d="M 1500 .../> 2. <path id=“HYC4” d="M 3500 .../> 3. <path id=“HYD3” d="M 1500 .../> 4. <path id=“HYD4” d="M 3500 .../> <g id="HY“/> <path id=“HYC4” d="M 3500 .../> <path id=“HYD3” d="M 1500 .../> <path id=“HYD4” d="M 3500 .../> Append childs A0 A1 A2 A3 A4 A5 B0 B1 B2 B3 A4 A5 C0 C1 C2 C3 C4 C5 D0 D1 D2 D3 D4 D5 E0 E1 E2 E3 E4 E5 F0 F1 F2 F3 F4 F5 Zoom Javascript Loop to identify tiles hat are necessary to cover the area of interest : C3, C4, D3, D4 Tiles already loaded: -
  • 25.
    Append childs <path id=“HYC3”d="M 1500 .../> Client server data loading Append childs <g id="HY“/> <path id=“HYC4” d="M 3500 .../> <path id=“HYD3” d="M 1500 .../> <path id=“HYD4” d="M 3500 .../> <path id=“HYE3” d="M 1500 .../> <path id=“HYE4” d="M 1500 .../> AJAX requests for missing tiles 1. http://...sendGeom.php?layer=HY& index=E3 2. http://...sendGeom.php?layer=HY& index=E4 XML fragments of missing tiles 1. <path id=“HYE3” d="M 1500 .../> 2. <path id=“HYE4” d="M 3500 .../> A0 A1 A2 A3 A4 A5 B0 B1 B2 B3 A4 A5 C0 C1 C2 C3 C4 C5 D0 D1 D2 D3 D4 D5 E0 E1 E2 E3 E4 E5 F0 F1 F2 F3 F4 F5 Zoom Javascript Loop to identify tiles hat are necessary to cover the area of interest : D3, D4, E3, E4 Tiles already loaded: C3, C4, D3, D4
  • 26.
     Client andserver based caching is possible  Predictive fetch  No reloading of data for previous visited areas Client server data loading advantages of the tile based method
  • 27.
    Claroteidae Chrysichthys AmphilidaeAmphilus Tetraodontidae Tetraodon Latidae Lates Thank you / Questions Museum of Natural History in Paris Fish collection The project FAUNAFRI has received funds from IRD. We would like in particular to acknowledge the major contributions to the project provided by N. Rahmani, L. Ruhier, J.J. Troubat and M. Vienne.