The document is a handbook published by Bio-Rad Laboratories detailing reference chromatograms for the Variant™ Hemoglobin Testing System, emphasizing common thalassemia and hemoglobinopathy conditions in India. It includes guidelines and insights from various hematologists to aid in interpreting chromatograms effectively. The handbook serves as a crucial educational resource for healthcare professionals working in the field of hematology.


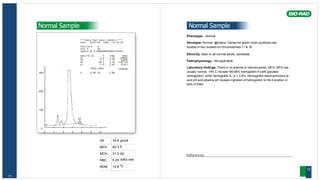
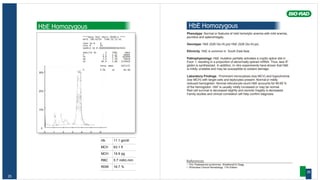
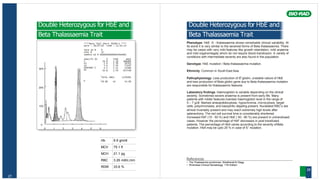
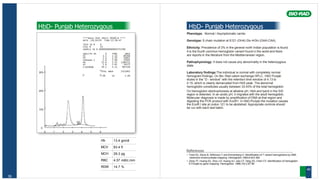
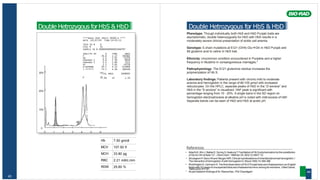
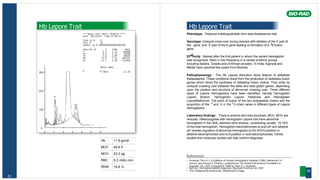
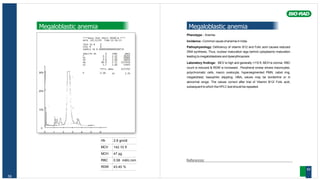
![Hb 15.2 gm/dl
MCV 84.6 fl
MCH 28.7 pg
RBC 5.31 mill/c.mm
RDW 13.6 %
57
Elevated P3 peak
****Beta Thal Short 30100-B ****
DATE :27/10/05 TIME:15:37:17
TECH ID # 0
VIAL # 37
SAMPLE ID # 00000000000003857407
ANALYTE ID % TIME AREA
F 1.6 1.02 33087
P2 4.9 1.32 102325
P3 26.4 1.78 552228
AO 64.9 2.52 1355951
A2 2.0 3.60 40403
TOTAL AREA 1240214
30% F 1.6% A2 2.0%
20%
10%
0
0 1 2 3 4 5 6
Elevated P3 peak
Phenotype: The peak within the P3 retention time window is usually due to
number of alpha and/or beta variants including J-Norfolk[alpha57(E6)Gly-
>Asp] or J-Anatolia/J-Mexico/J-Meerut), Camden,Grady, N-Baltimore, Fannin
Lubbock,J-Baltimore, J-Bangkok which elute at that position.
Genotype: caused by genetic mutations in either the alpha-globin gene in
alpha variants or the beta-globin gene in beta variants. Mutations differ in
patients with different variants.
VARIANT NAME RETENTION TIME ASSOCIATED MUTATION
Hb J-Oxford 1.60 15Gly3Asp
Hb J-Anatolia 1.75 61Lys3Thr
Hb J-Mexico 1.74 54Gln3Glu
Hb J-Meerut 1.88 120Ala3Glu
Hb J-Toronto 1.94 5Ala3Asp
Hb Hope 1.39 136Gly3Asp
Hb Camden 1.50 131Gln3Glu
Hb Austin 1.68 40Arg3Ser
Hb N-Baltimore 1.70 95Lys3Glu
Hb Fukuyama 1.72 77His3Tyr
Hb Fannin-Lubbock 1.75 119Gly3Asp
Hb J-Bangkok 2.02 56Gly3Asp
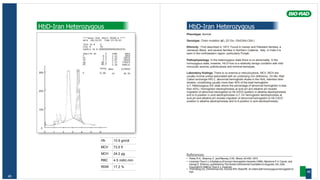
Ethinicity: reported throughout the world.
Pathophysiology: Usually asymptomatic.
Laboratory findings: Patients may show a mild anemia. MCV, MCH are
normal to reduced. J-Meerut shows a mild increase in Oxygen affinity
compared to the normal control in addition to an increase in RBC count.
On the Bio-Rad cation exchange HPLC, a significant peak is seen in the P3
window at a retention time of 1.3 minutes. Hemoglobin electrophoresis shows
a fastmoving band anodal toHbAatalkalinepH.
References
• Bain BJ. Hemoglobinopathy diagnosis. Blackwell Science Ltd. 2001.
• Huisman Titus H.J.A Syllabus of Human Hemoglobin Variants (1996), Marianne F.H.
Carver, and Georgi D. Efremov, published by The Sickle Cell Anemia Foundation in
Augusta, GA, USA. Copyright © 1996 by Titus H.J. Huisman.
• The Thalassemia syndromes. Weatherall & Clegg.
• Balgir RS. Burden of hemoglobinopathies in India and the challenges ahead. Current
Science 2000;79(11):1536-1547.
• JoutovskyA, et al. HPLC retention time as a diagnostic tool for hemoglobin variants and
hemoglobinopathies: A study of 60,000 samples in a clinical diagnostic laboratory. Clinical
Chemistry Vol 50(10), 2004:1736-1747
58](https://image.slidesharecdn.com/bookvariant-240419074821-576186e5/85/HPLC-Hemoglobinopathies-patterns-atlas-HPLC-30-320.jpg)