Download to read offline


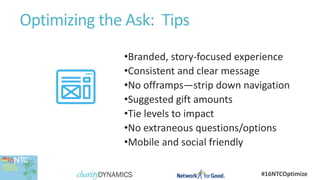


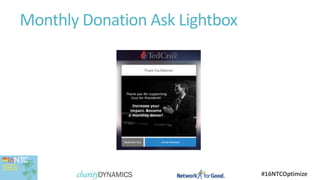


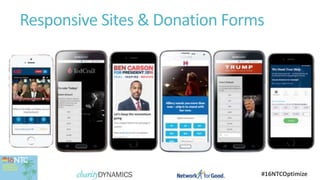


The document provides strategies for optimizing the online giving experience to enhance donations for nonprofits. Key recommendations include creating a branded, story-focused experience, simplifying the donation process, and prioritizing mobile engagement. It emphasizes the importance of data-driven decisions in fundraising, encouraging monthly giving, and implementing effective peer-to-peer campaigns.


![Is Your Web Presence Helping or Hurting Your Business? [Webinar]](https://cdn.slidesharecdn.com/ss_thumbnails/websitehelpingorhurting-r7ag-170315182650-thumbnail.jpg?width=640&height=640&fit=bounds)


