


![24
BI DASHBOARD FORMULA ACTIONABLE KPI FORMAT
[action] [what] [how much] [by when]](https://image.slidesharecdn.com/spitheperfectkpimyukbi2016v2-160304013415/75/What-does-the-Perfect-KPI-Look-Like-25-2048.jpg)
![25
NEW ACTIONABLE KPI
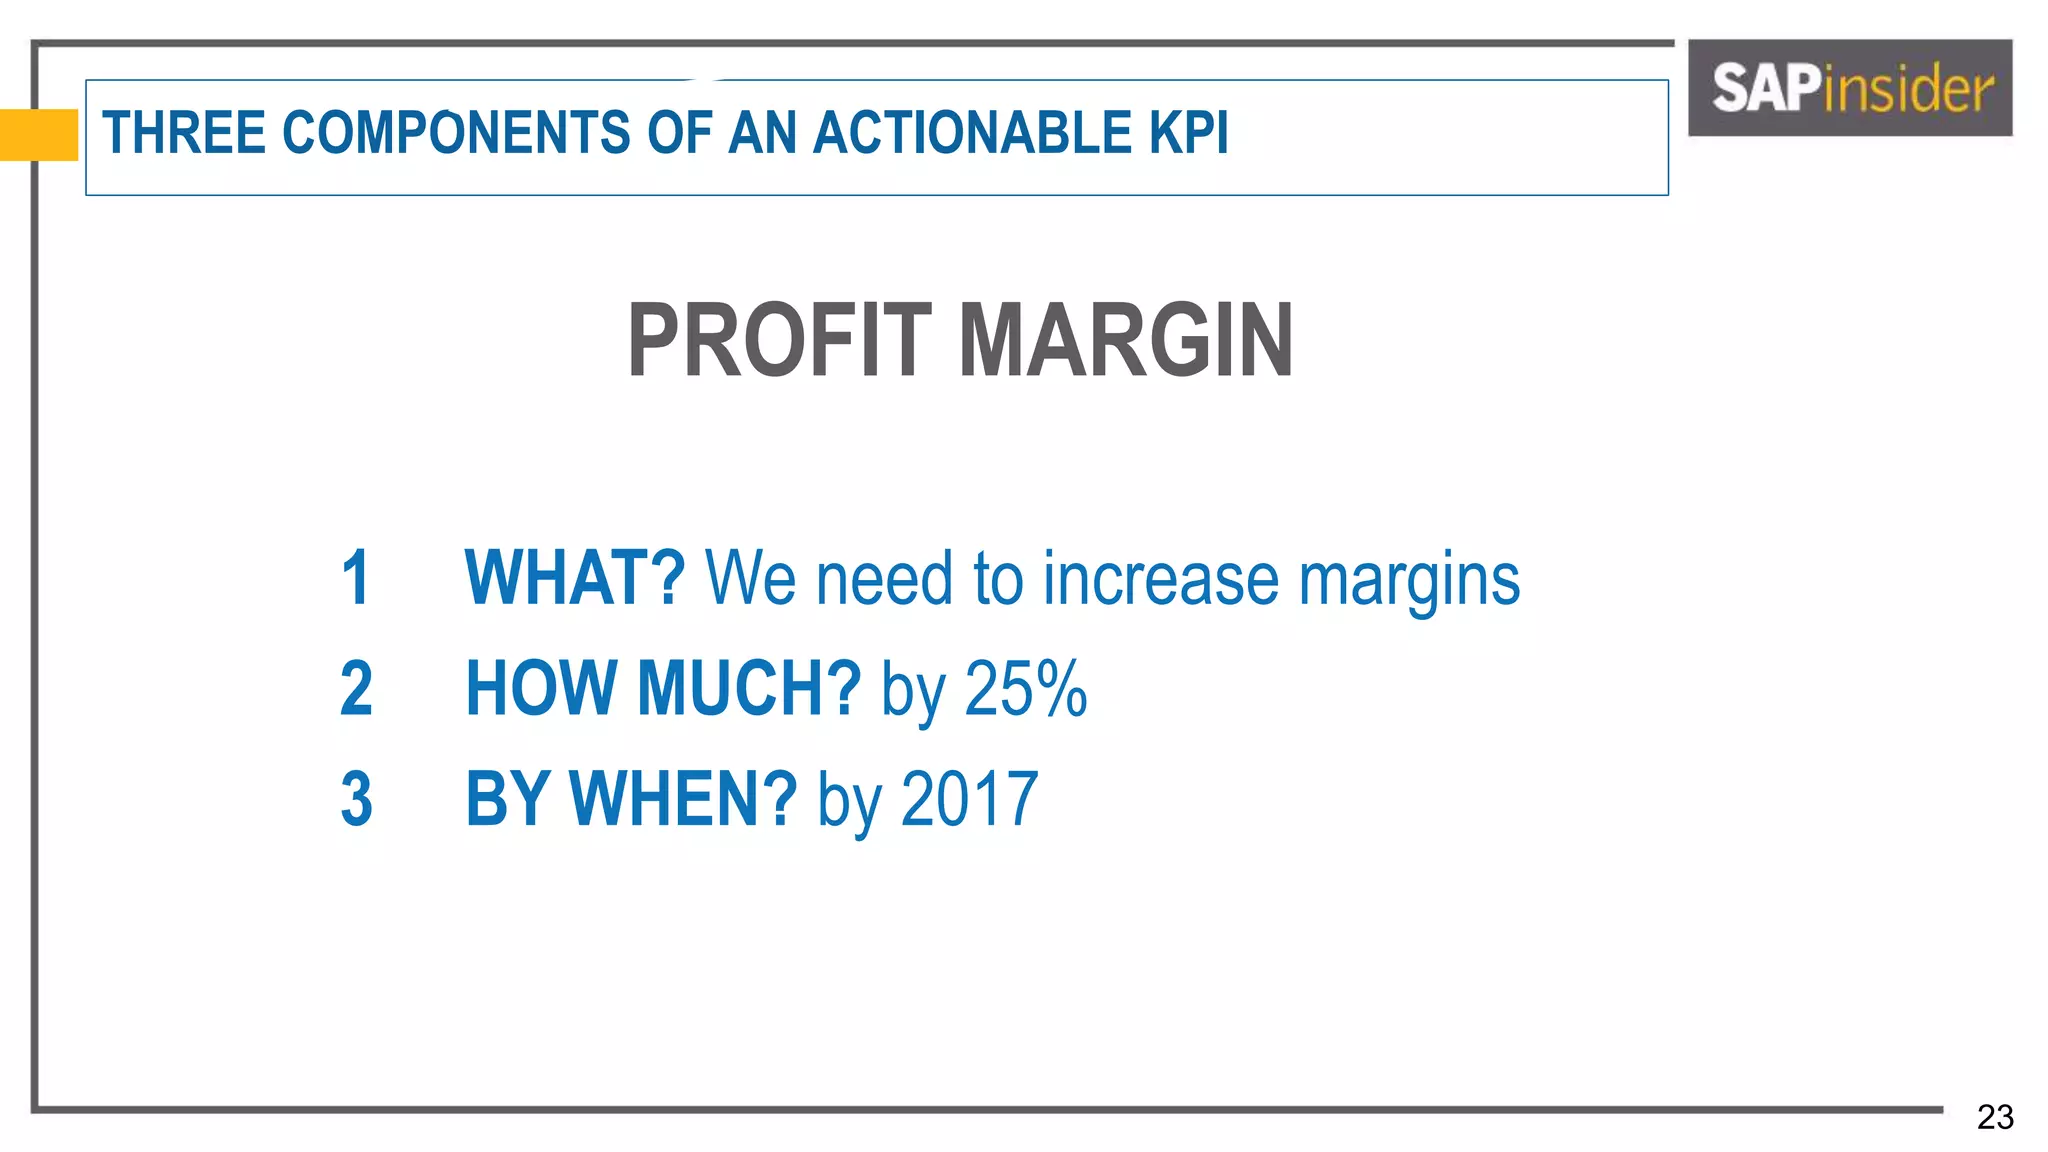
INCREASE PROFIT MARGIN BY 25% BY 2017
[action] [what] [how much] [by when]](https://image.slidesharecdn.com/spitheperfectkpimyukbi2016v2-160304013415/75/What-does-the-Perfect-KPI-Look-Like-26-2048.jpg)

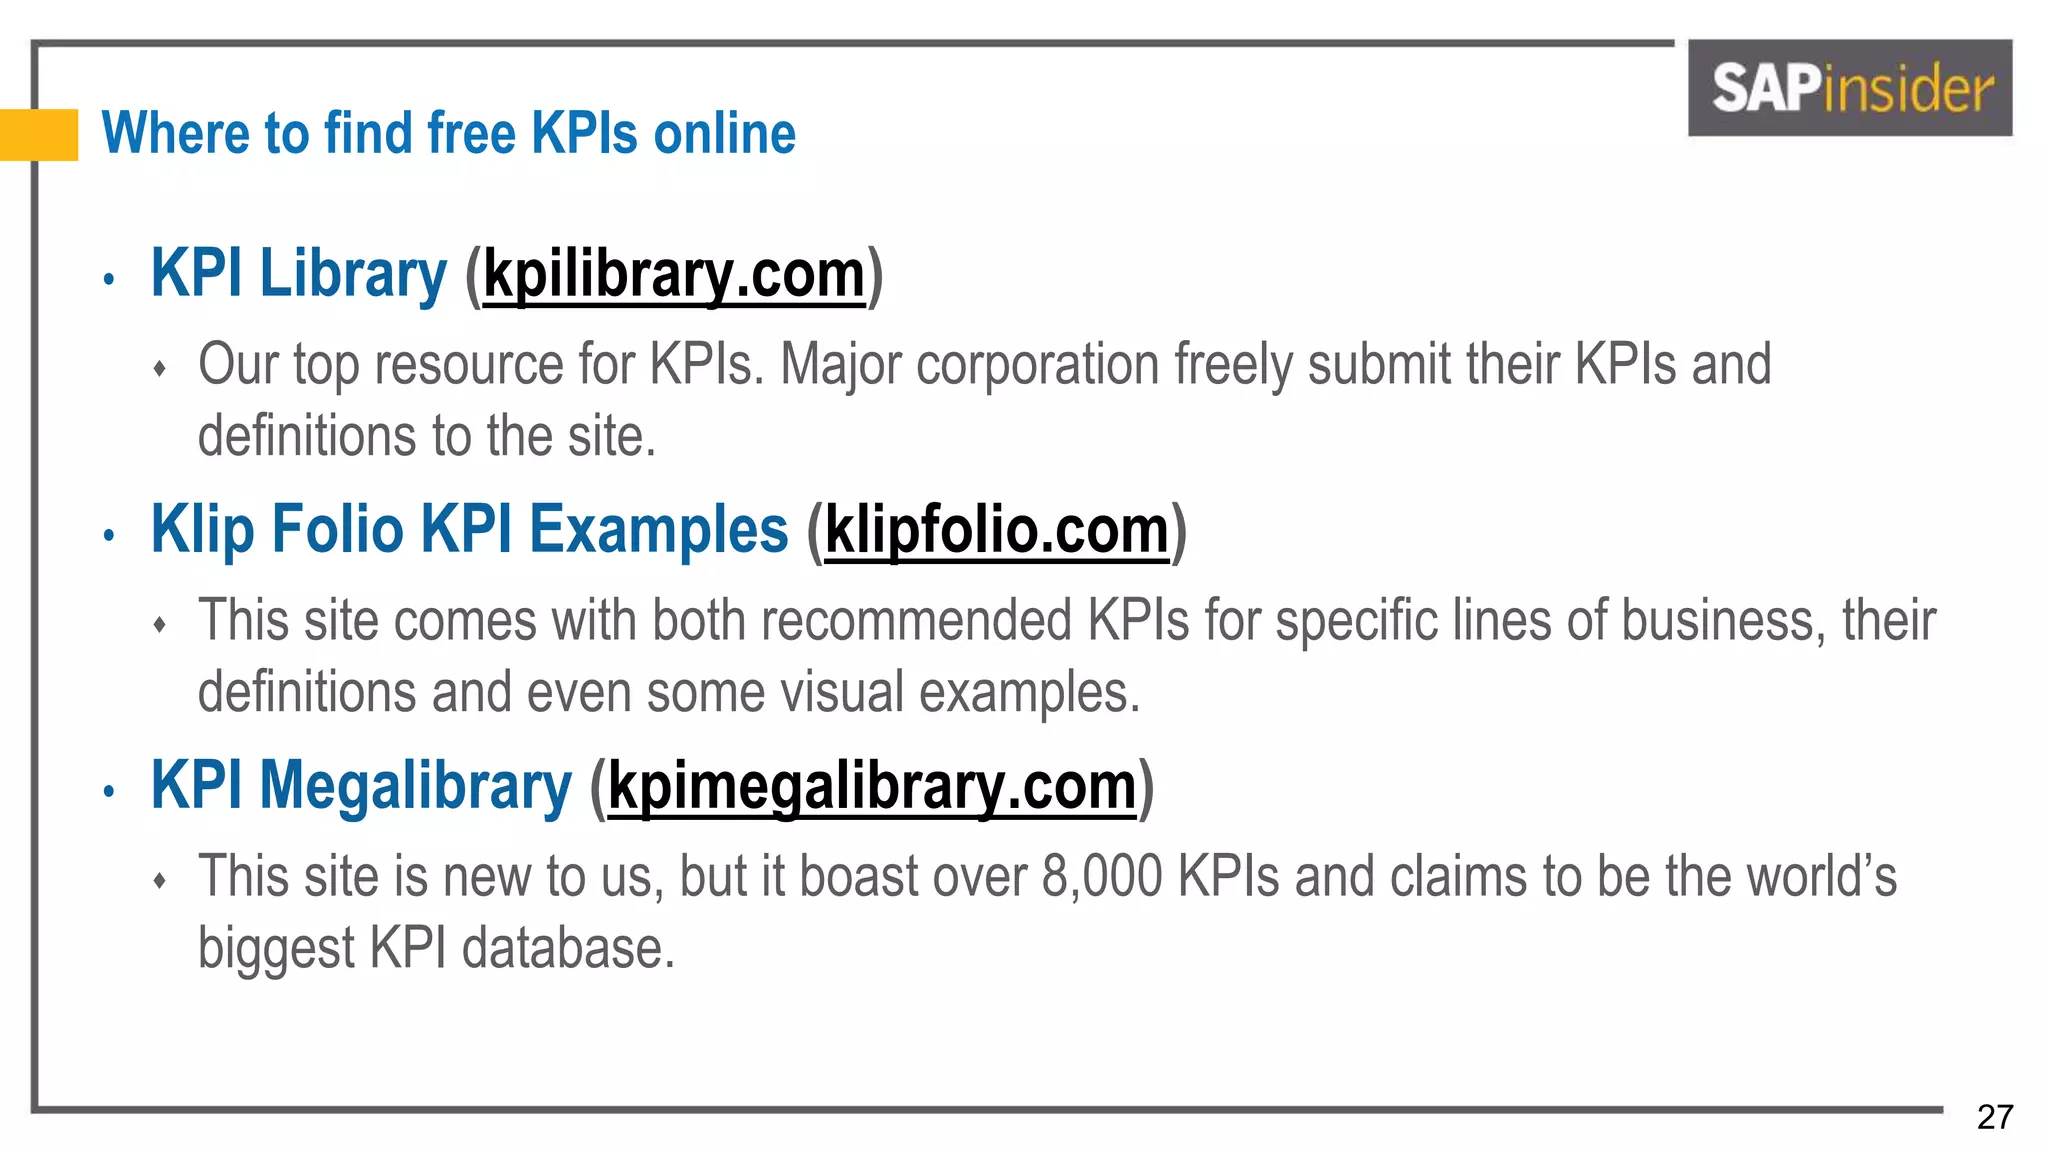


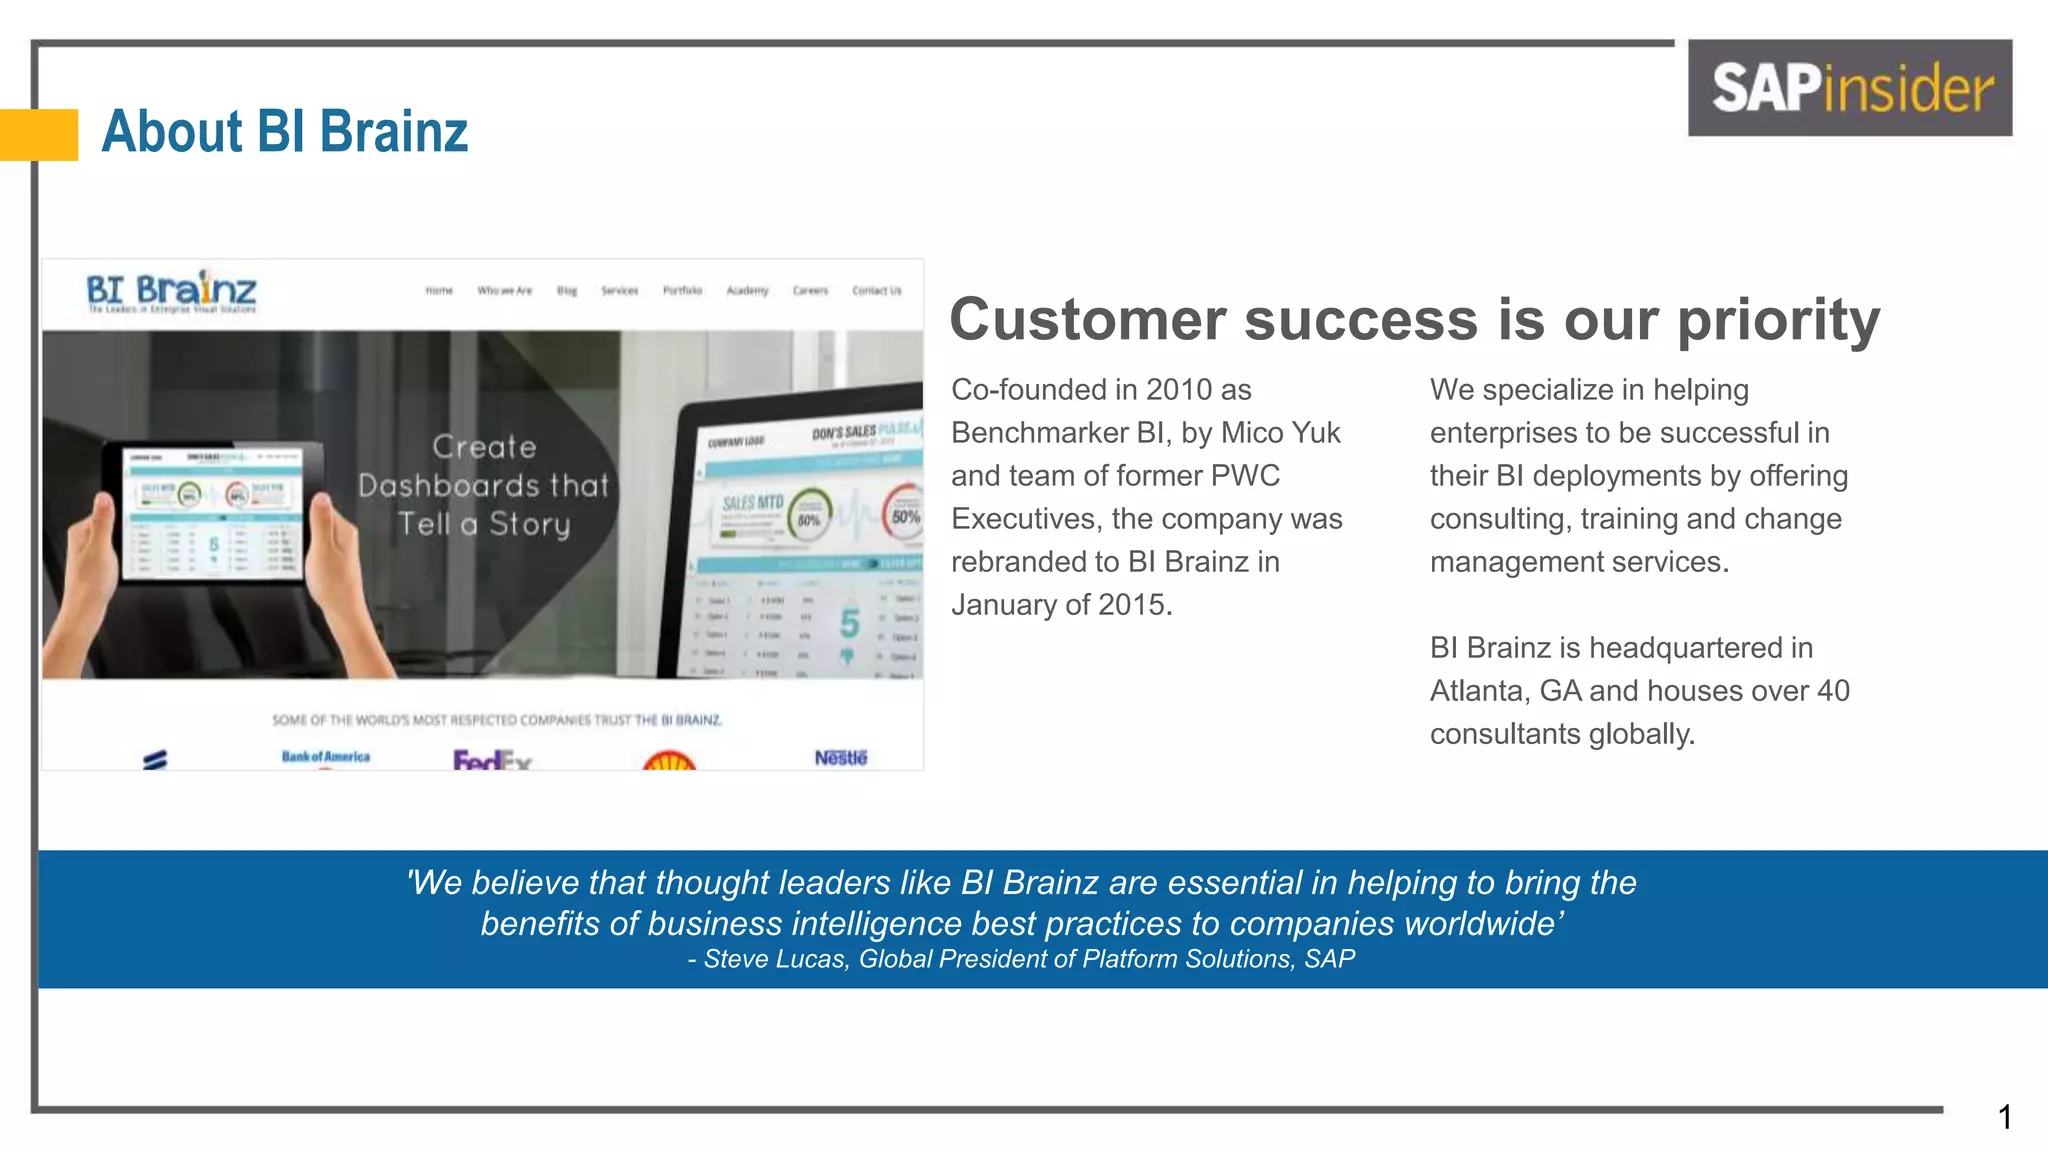
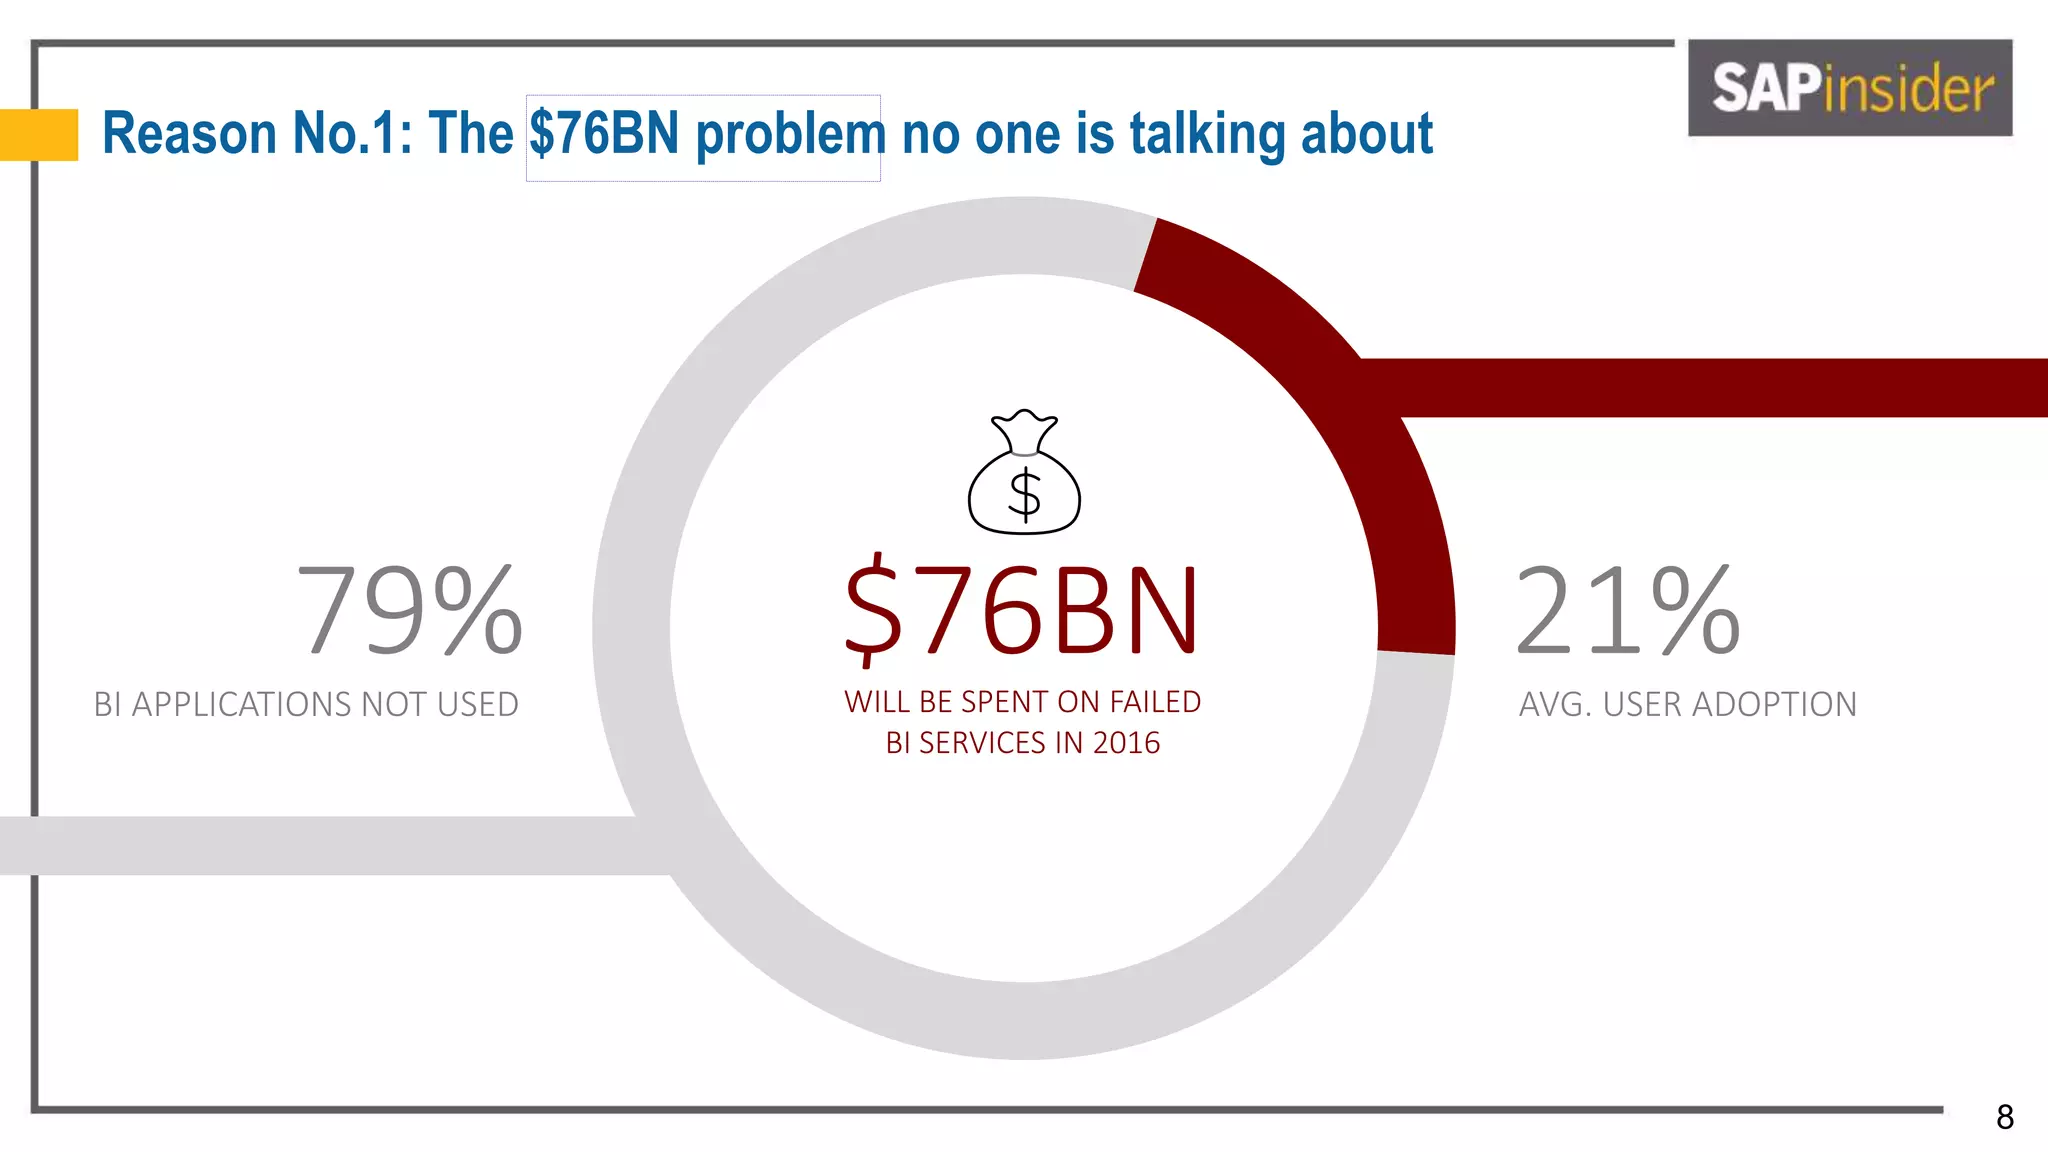
The document discusses the importance of Key Performance Indicators (KPIs) in business intelligence, highlighting a $76 billion problem related to ineffective BI deployments. It outlines characteristics of effective KPIs and emphasizes the need for actionable metrics to enhance data visualization and organizational success. Additionally, resources for KPI management and training services offered by BI Brainz are mentioned.


![Intro to Key Performance Indicators [Infographic]](https://cdn.slidesharecdn.com/ss_thumbnails/kpi-infographic-160217090723-thumbnail.jpg?width=640&height=640&fit=bounds)


