Downloaded 108 times
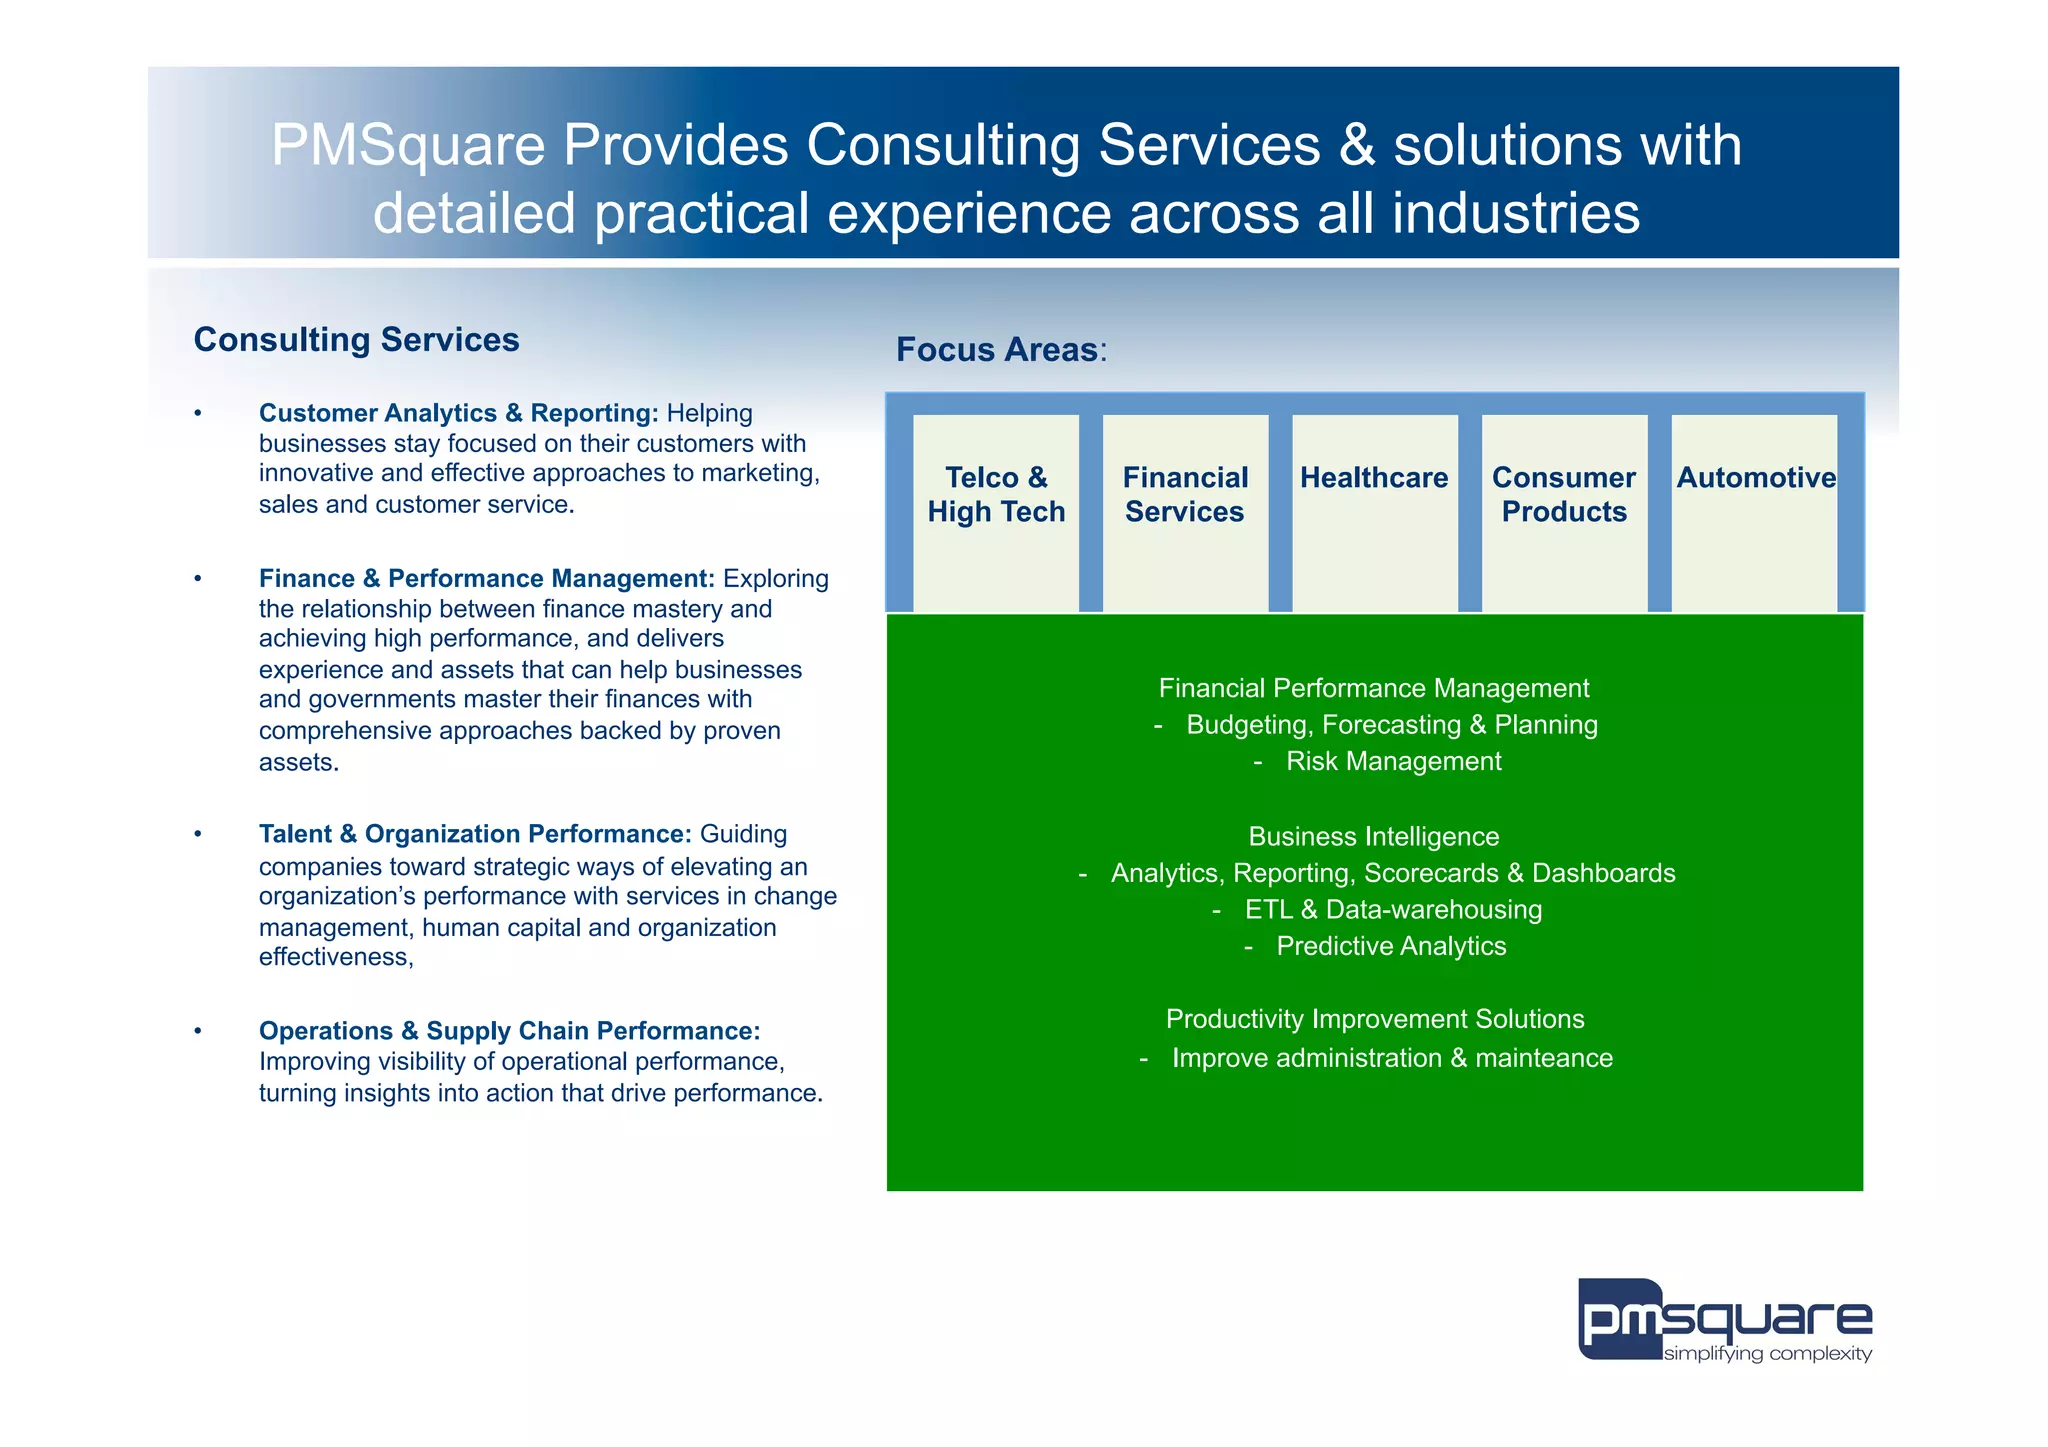
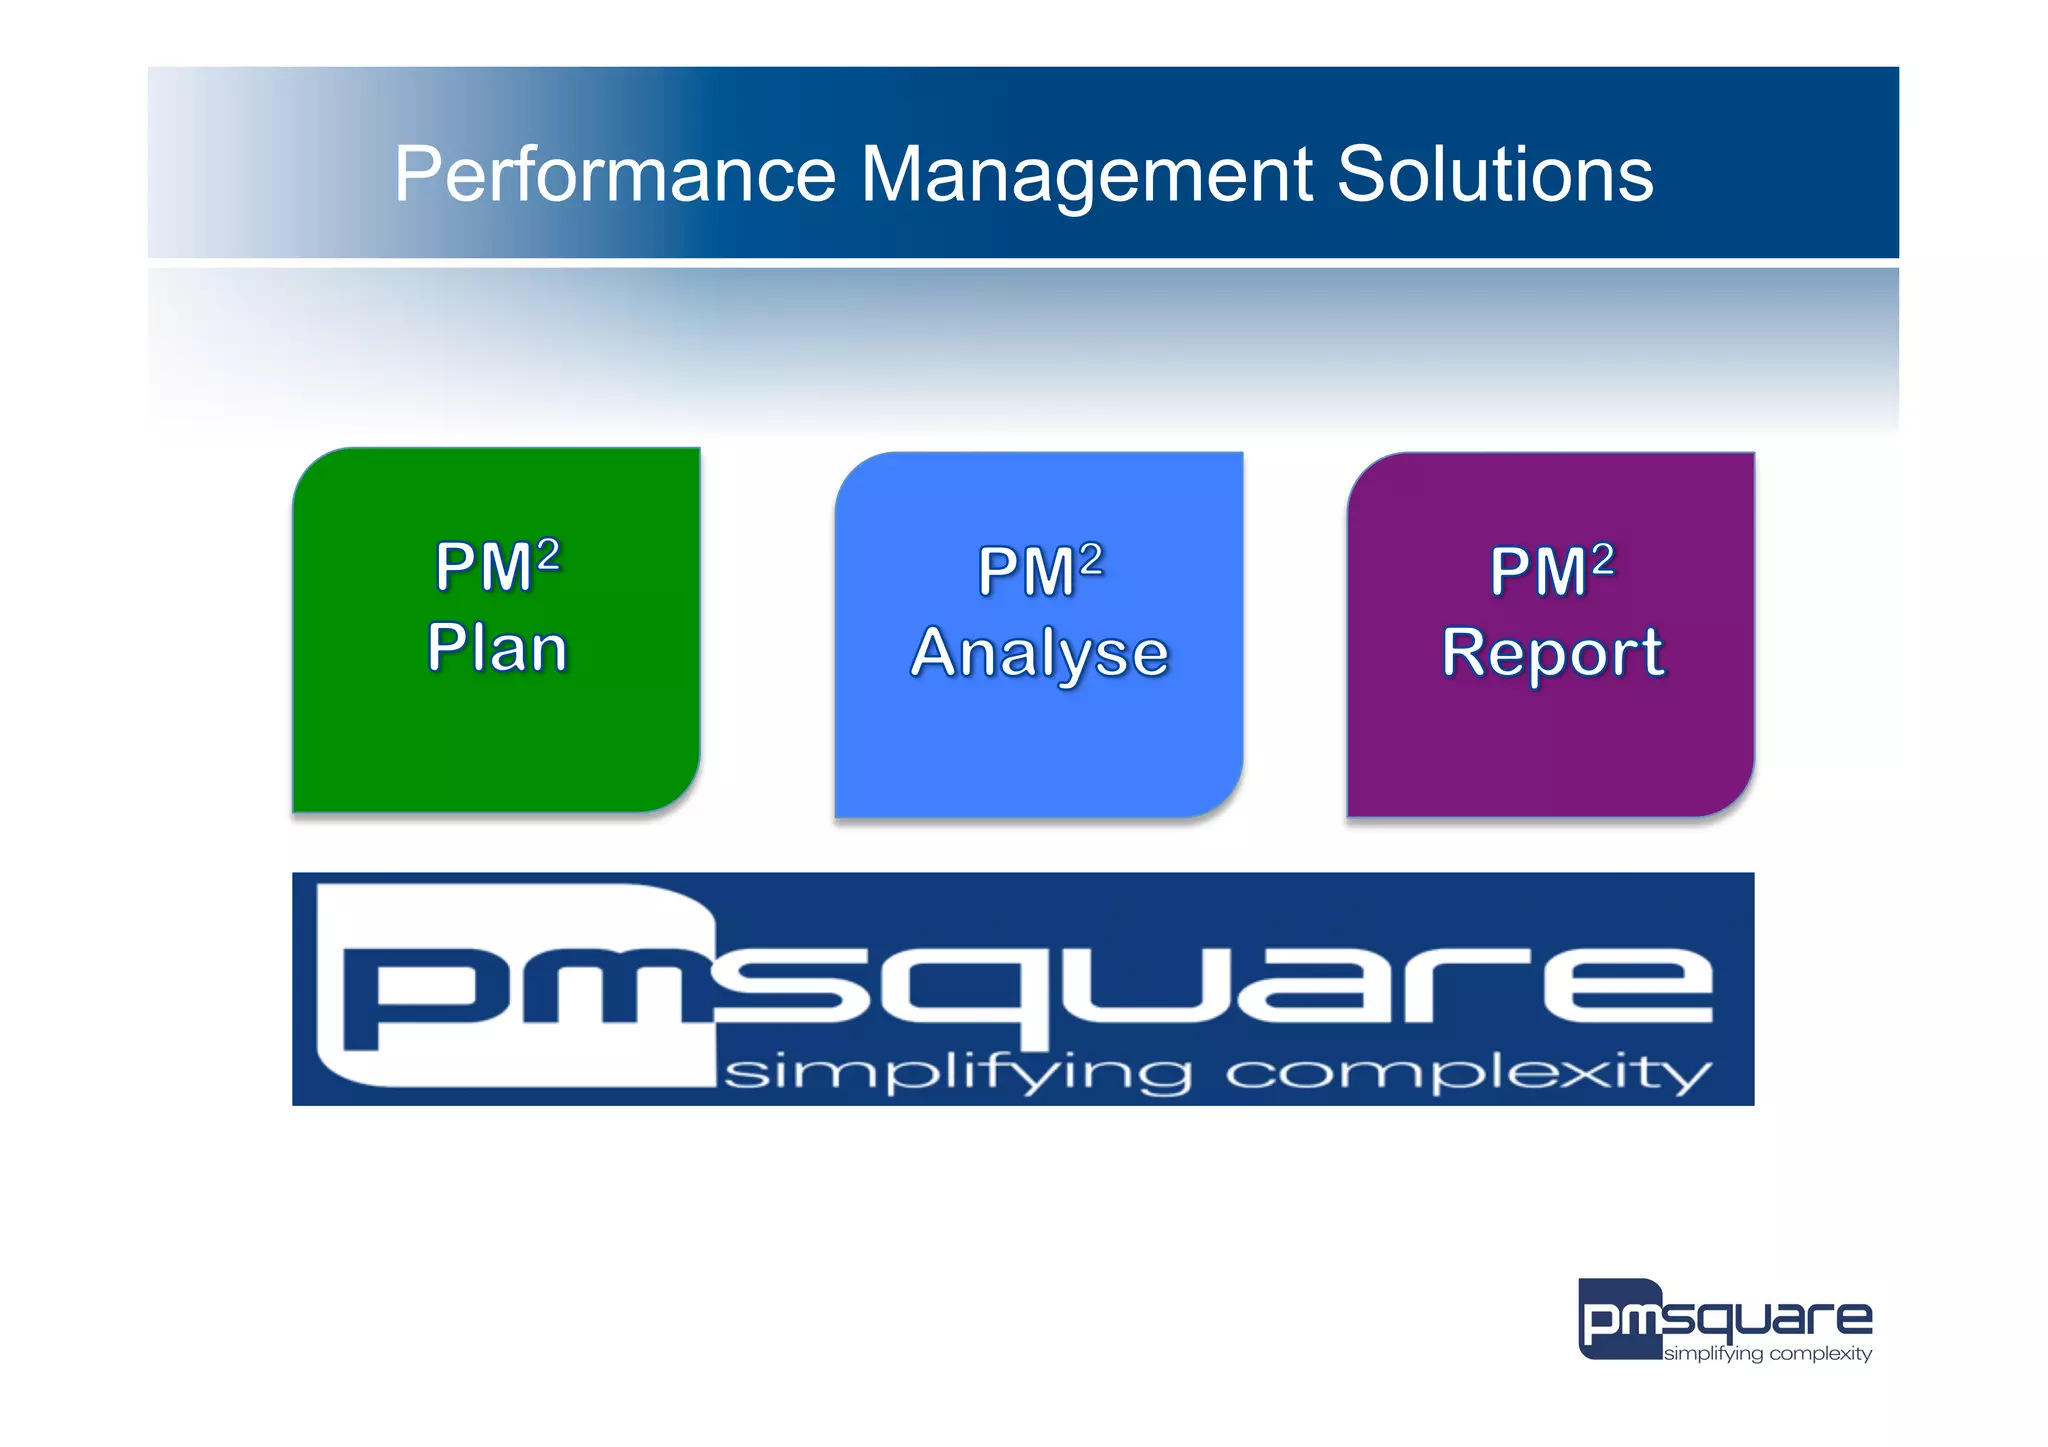
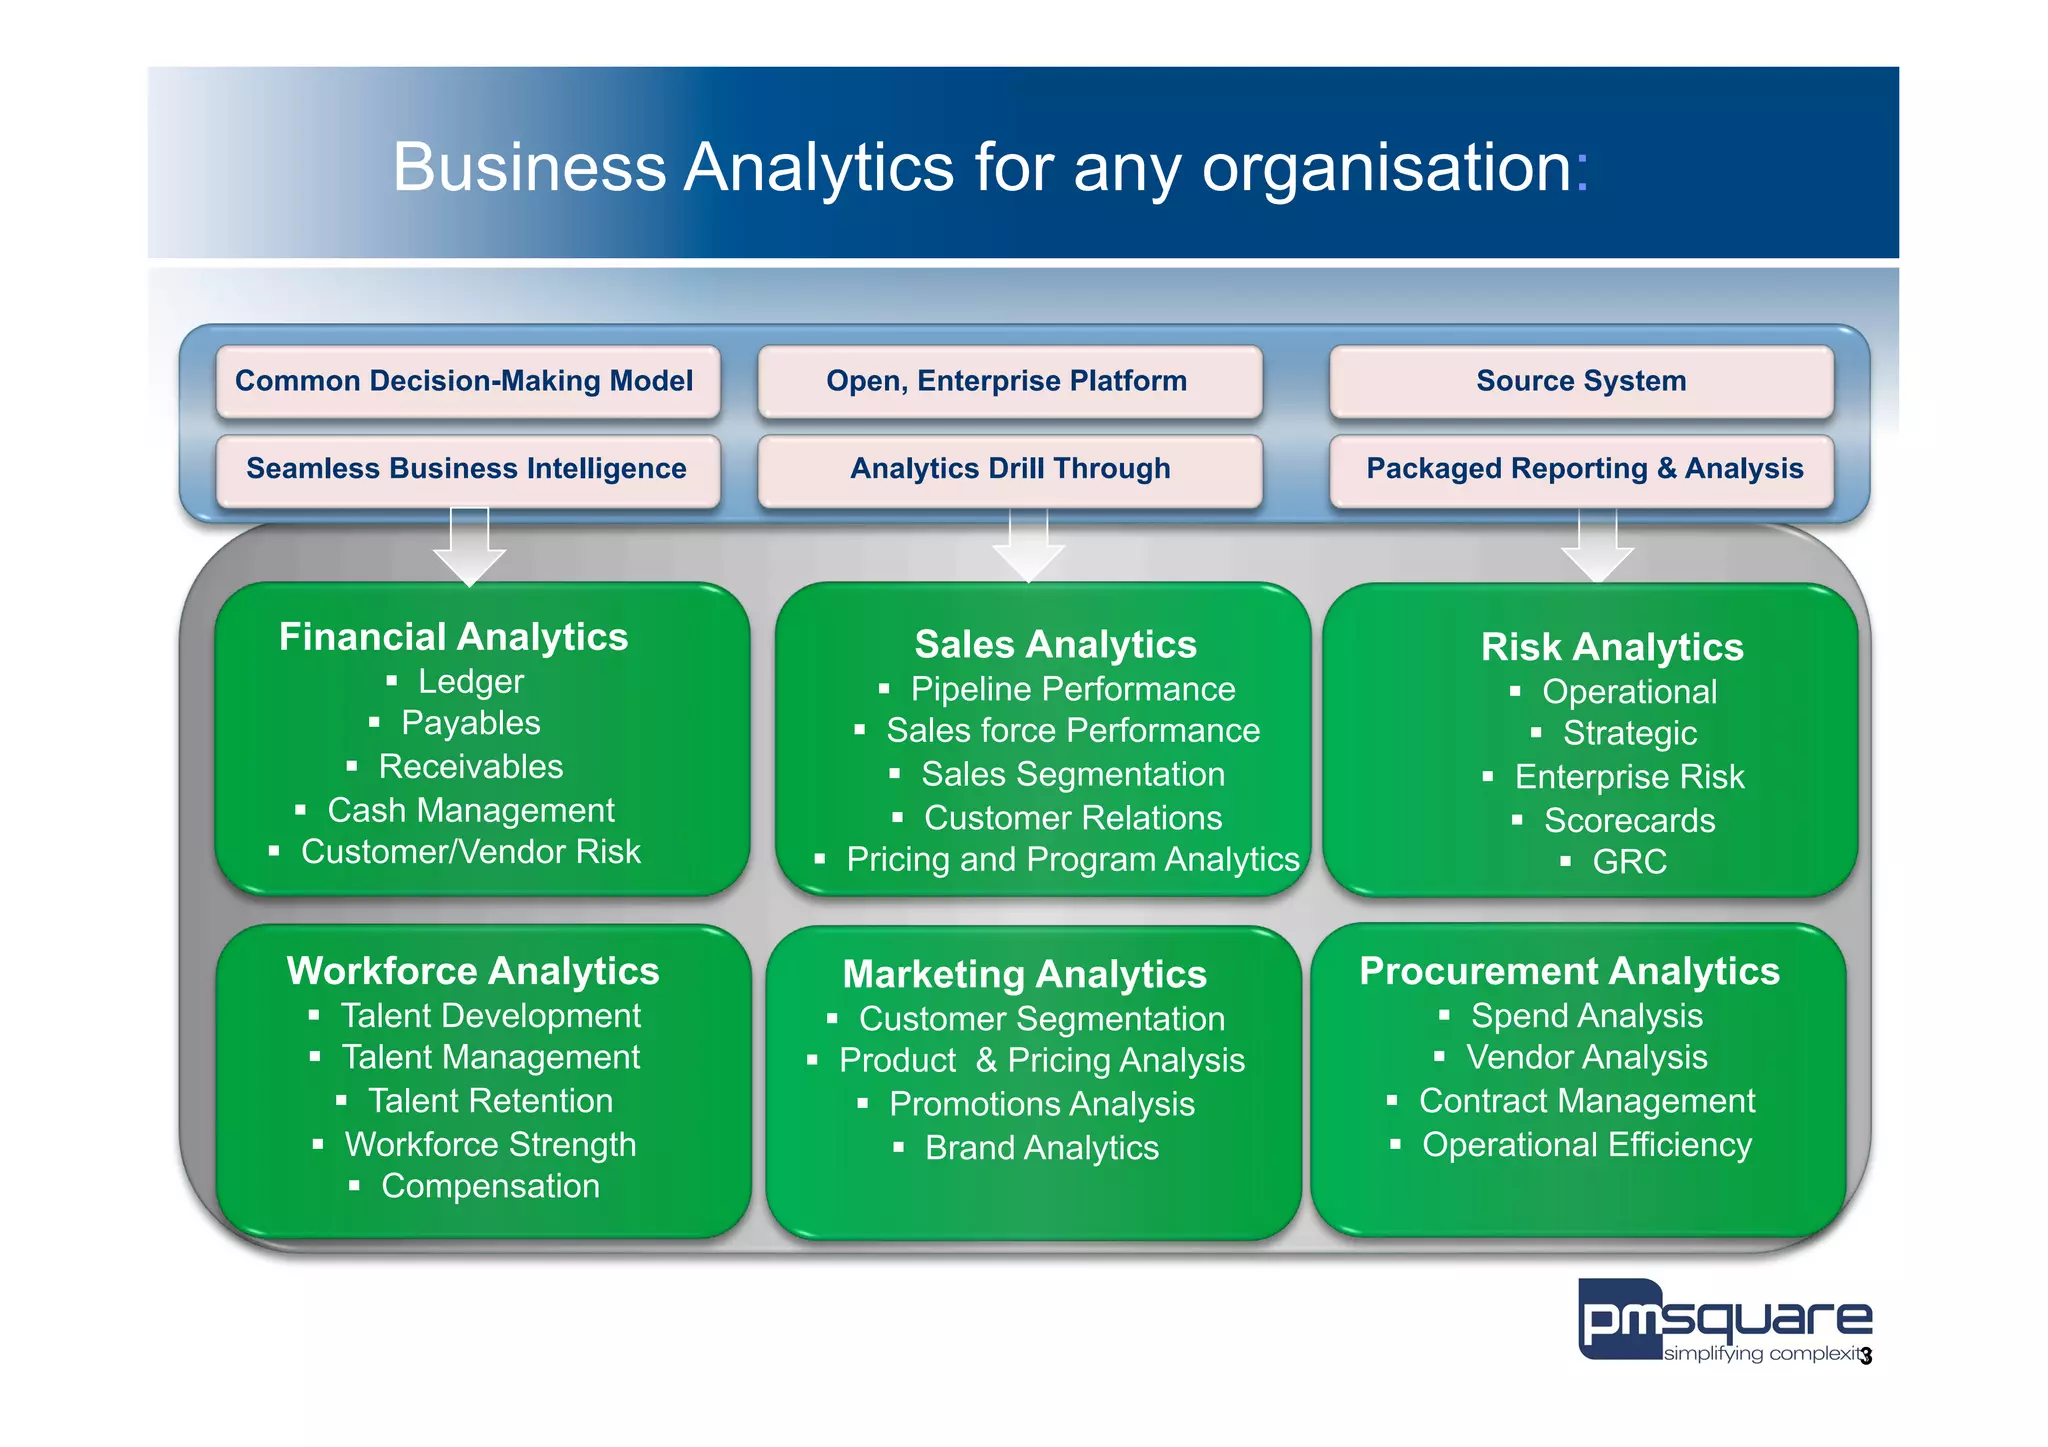
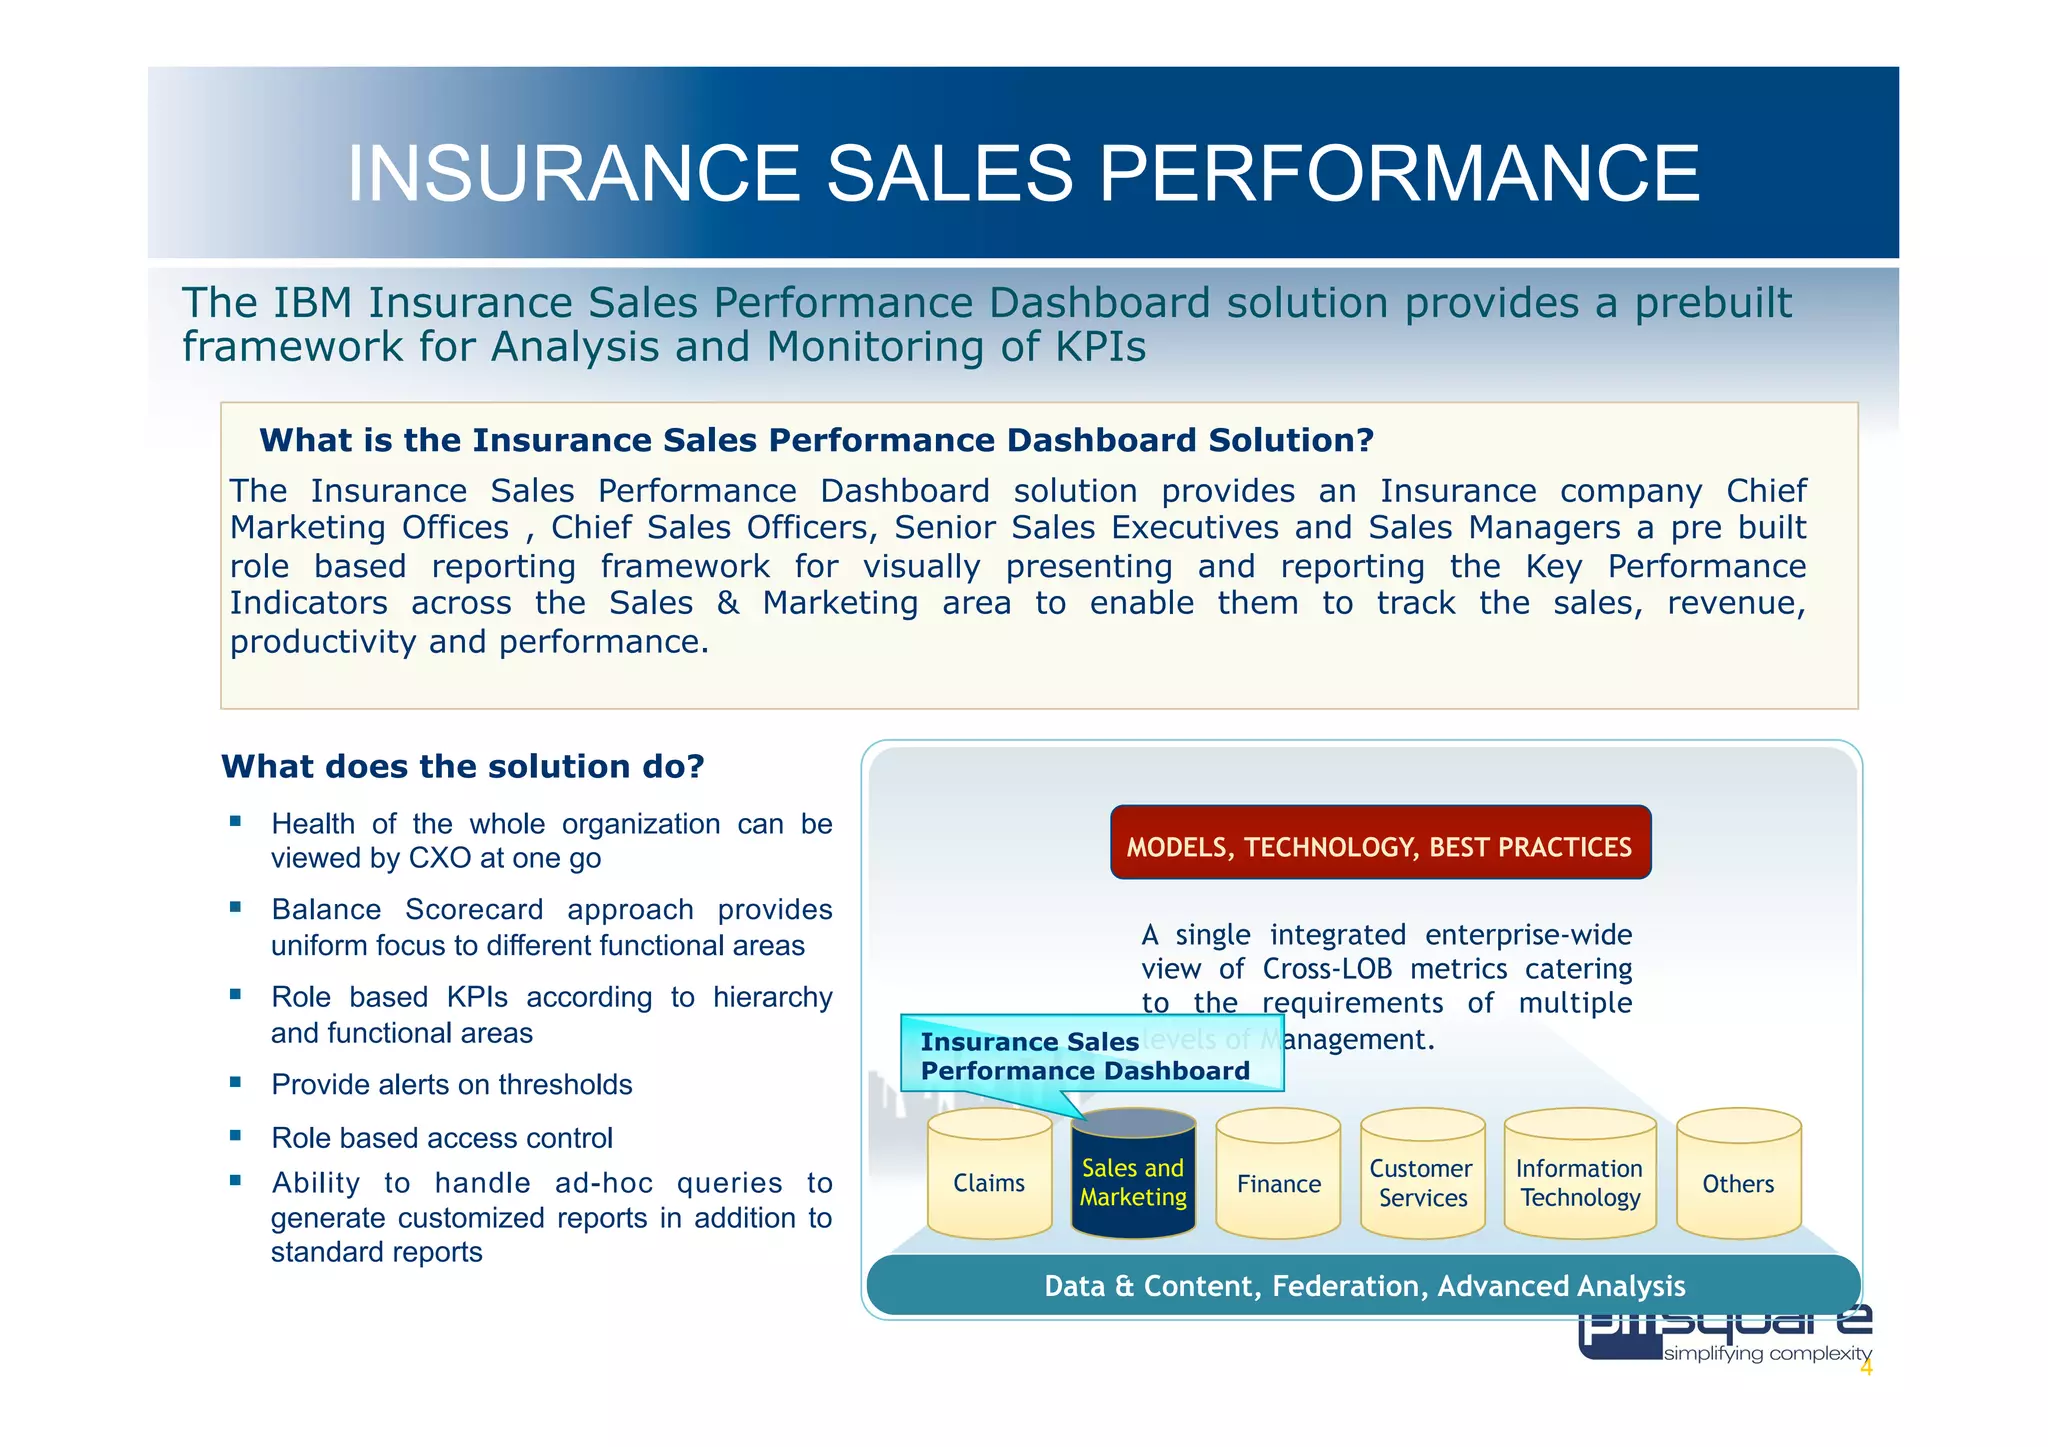

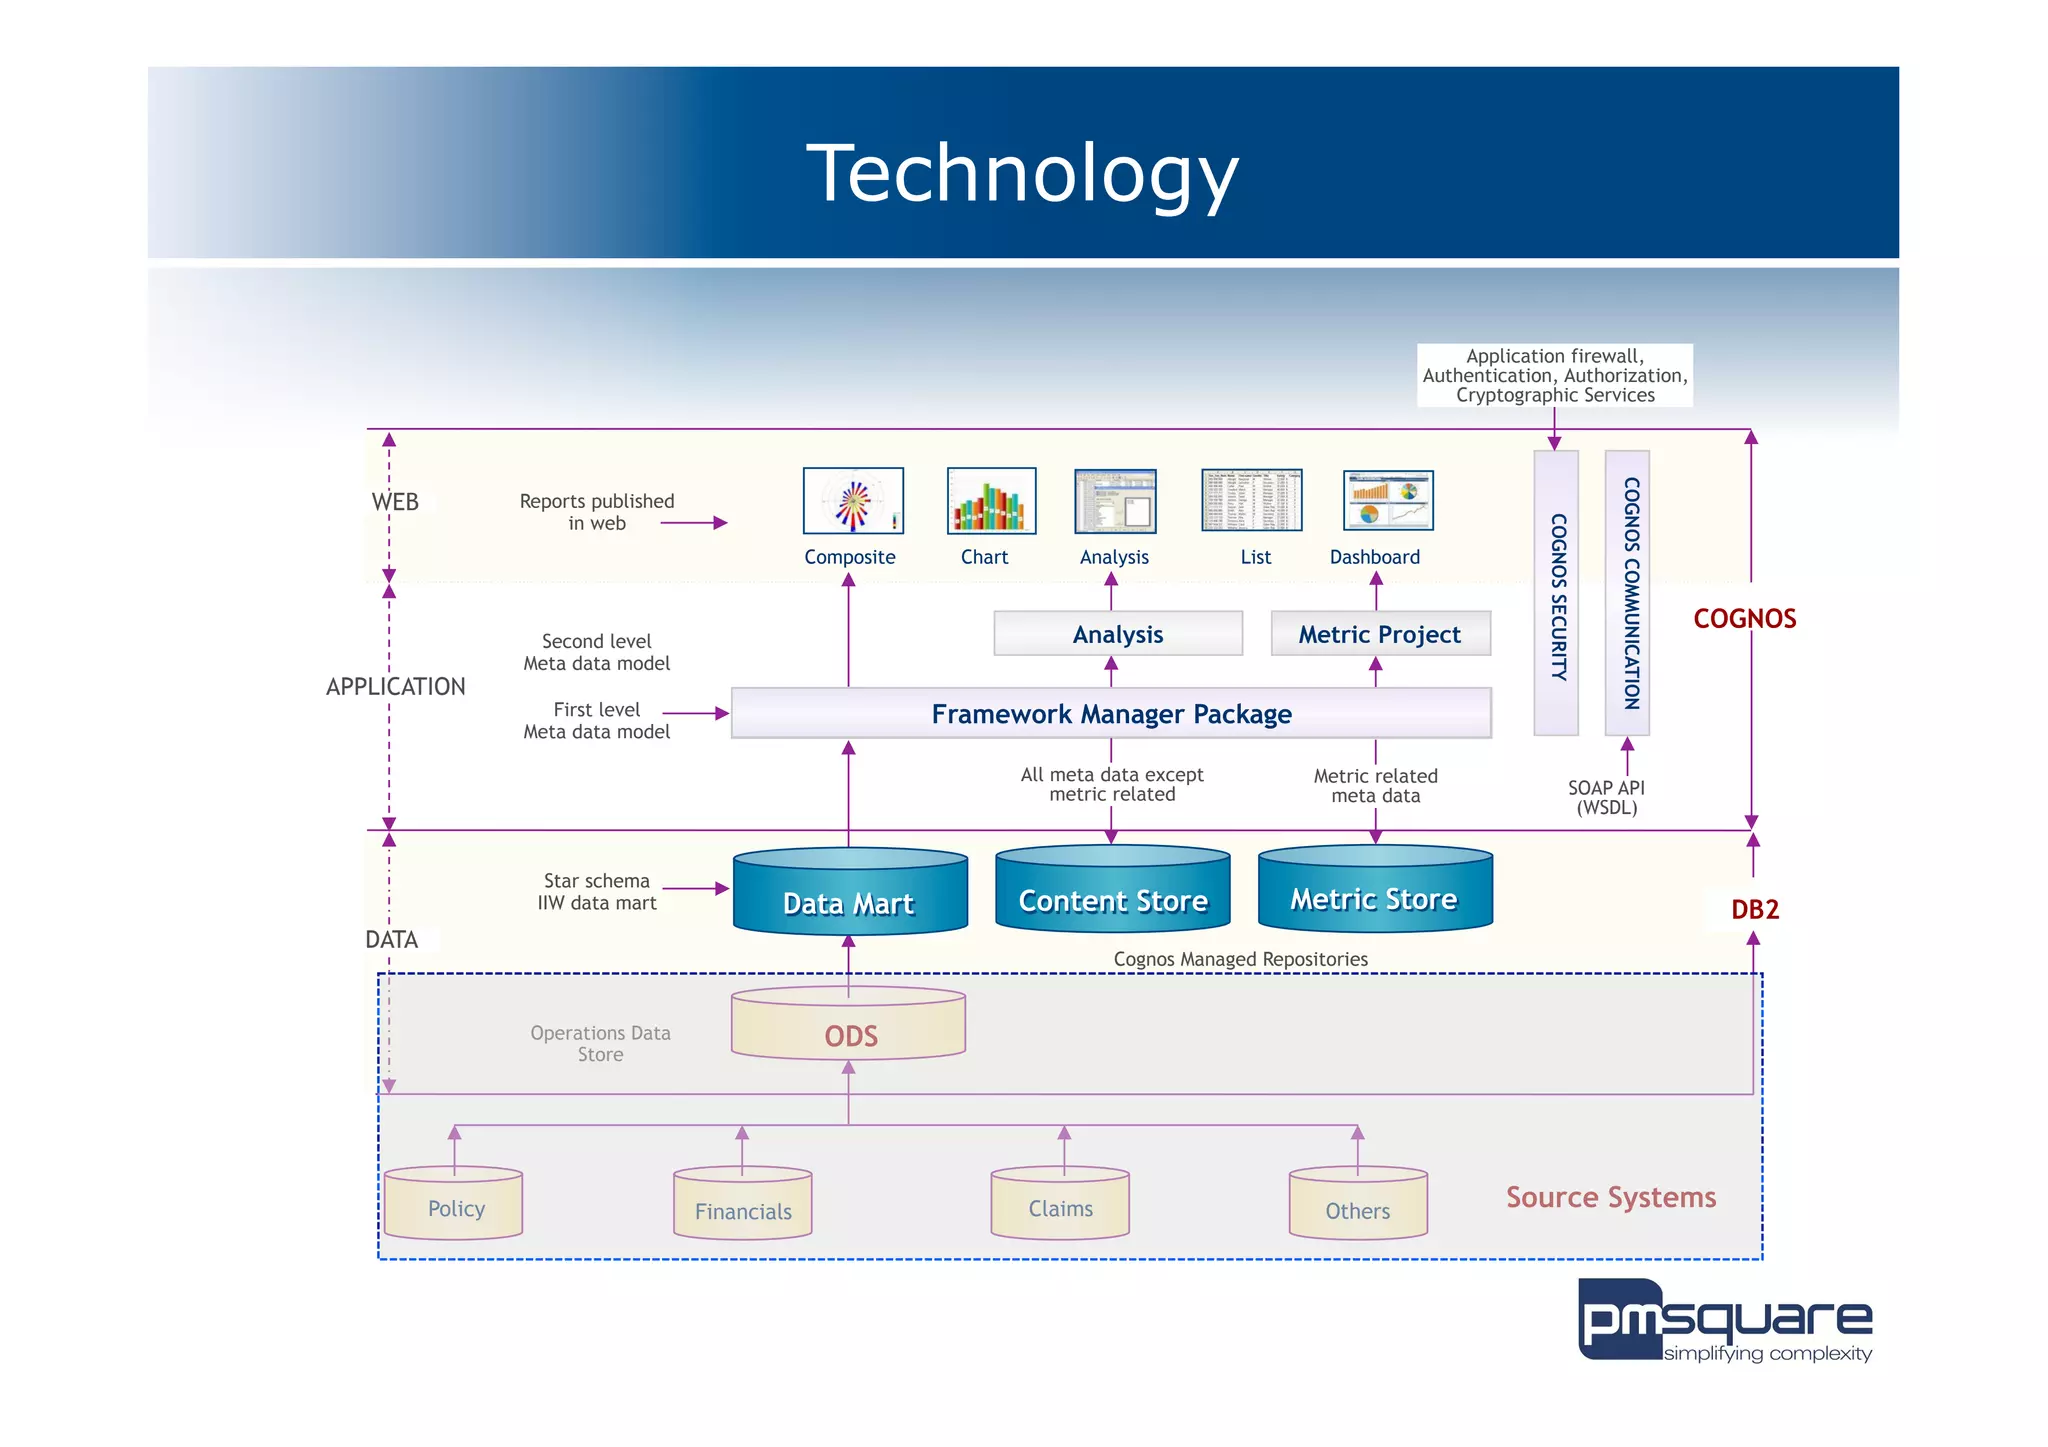
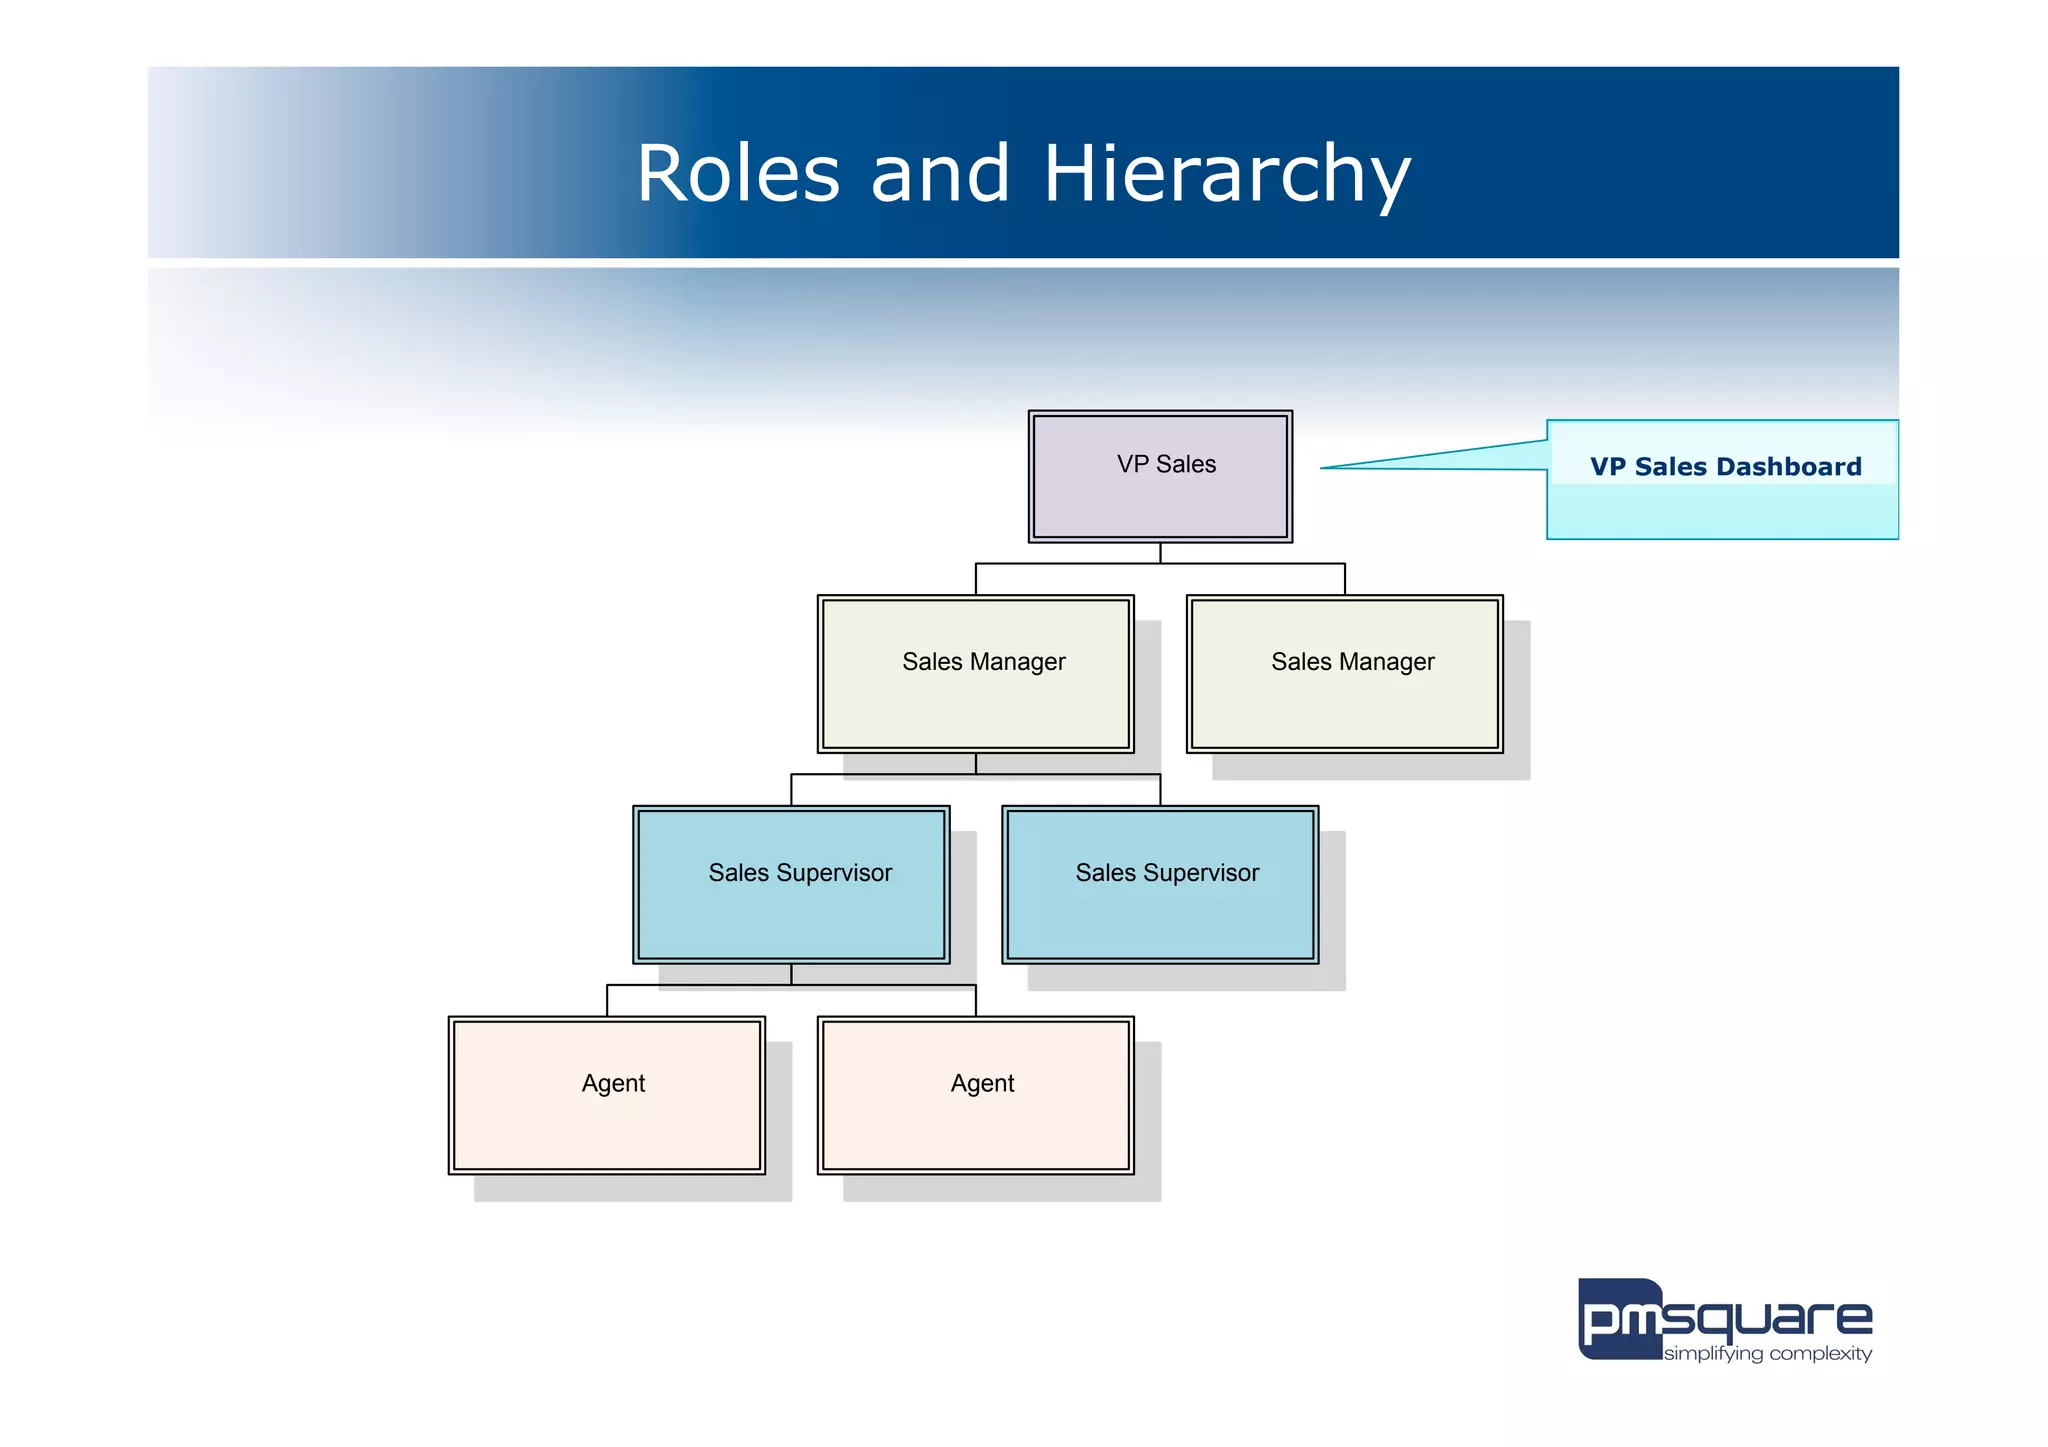
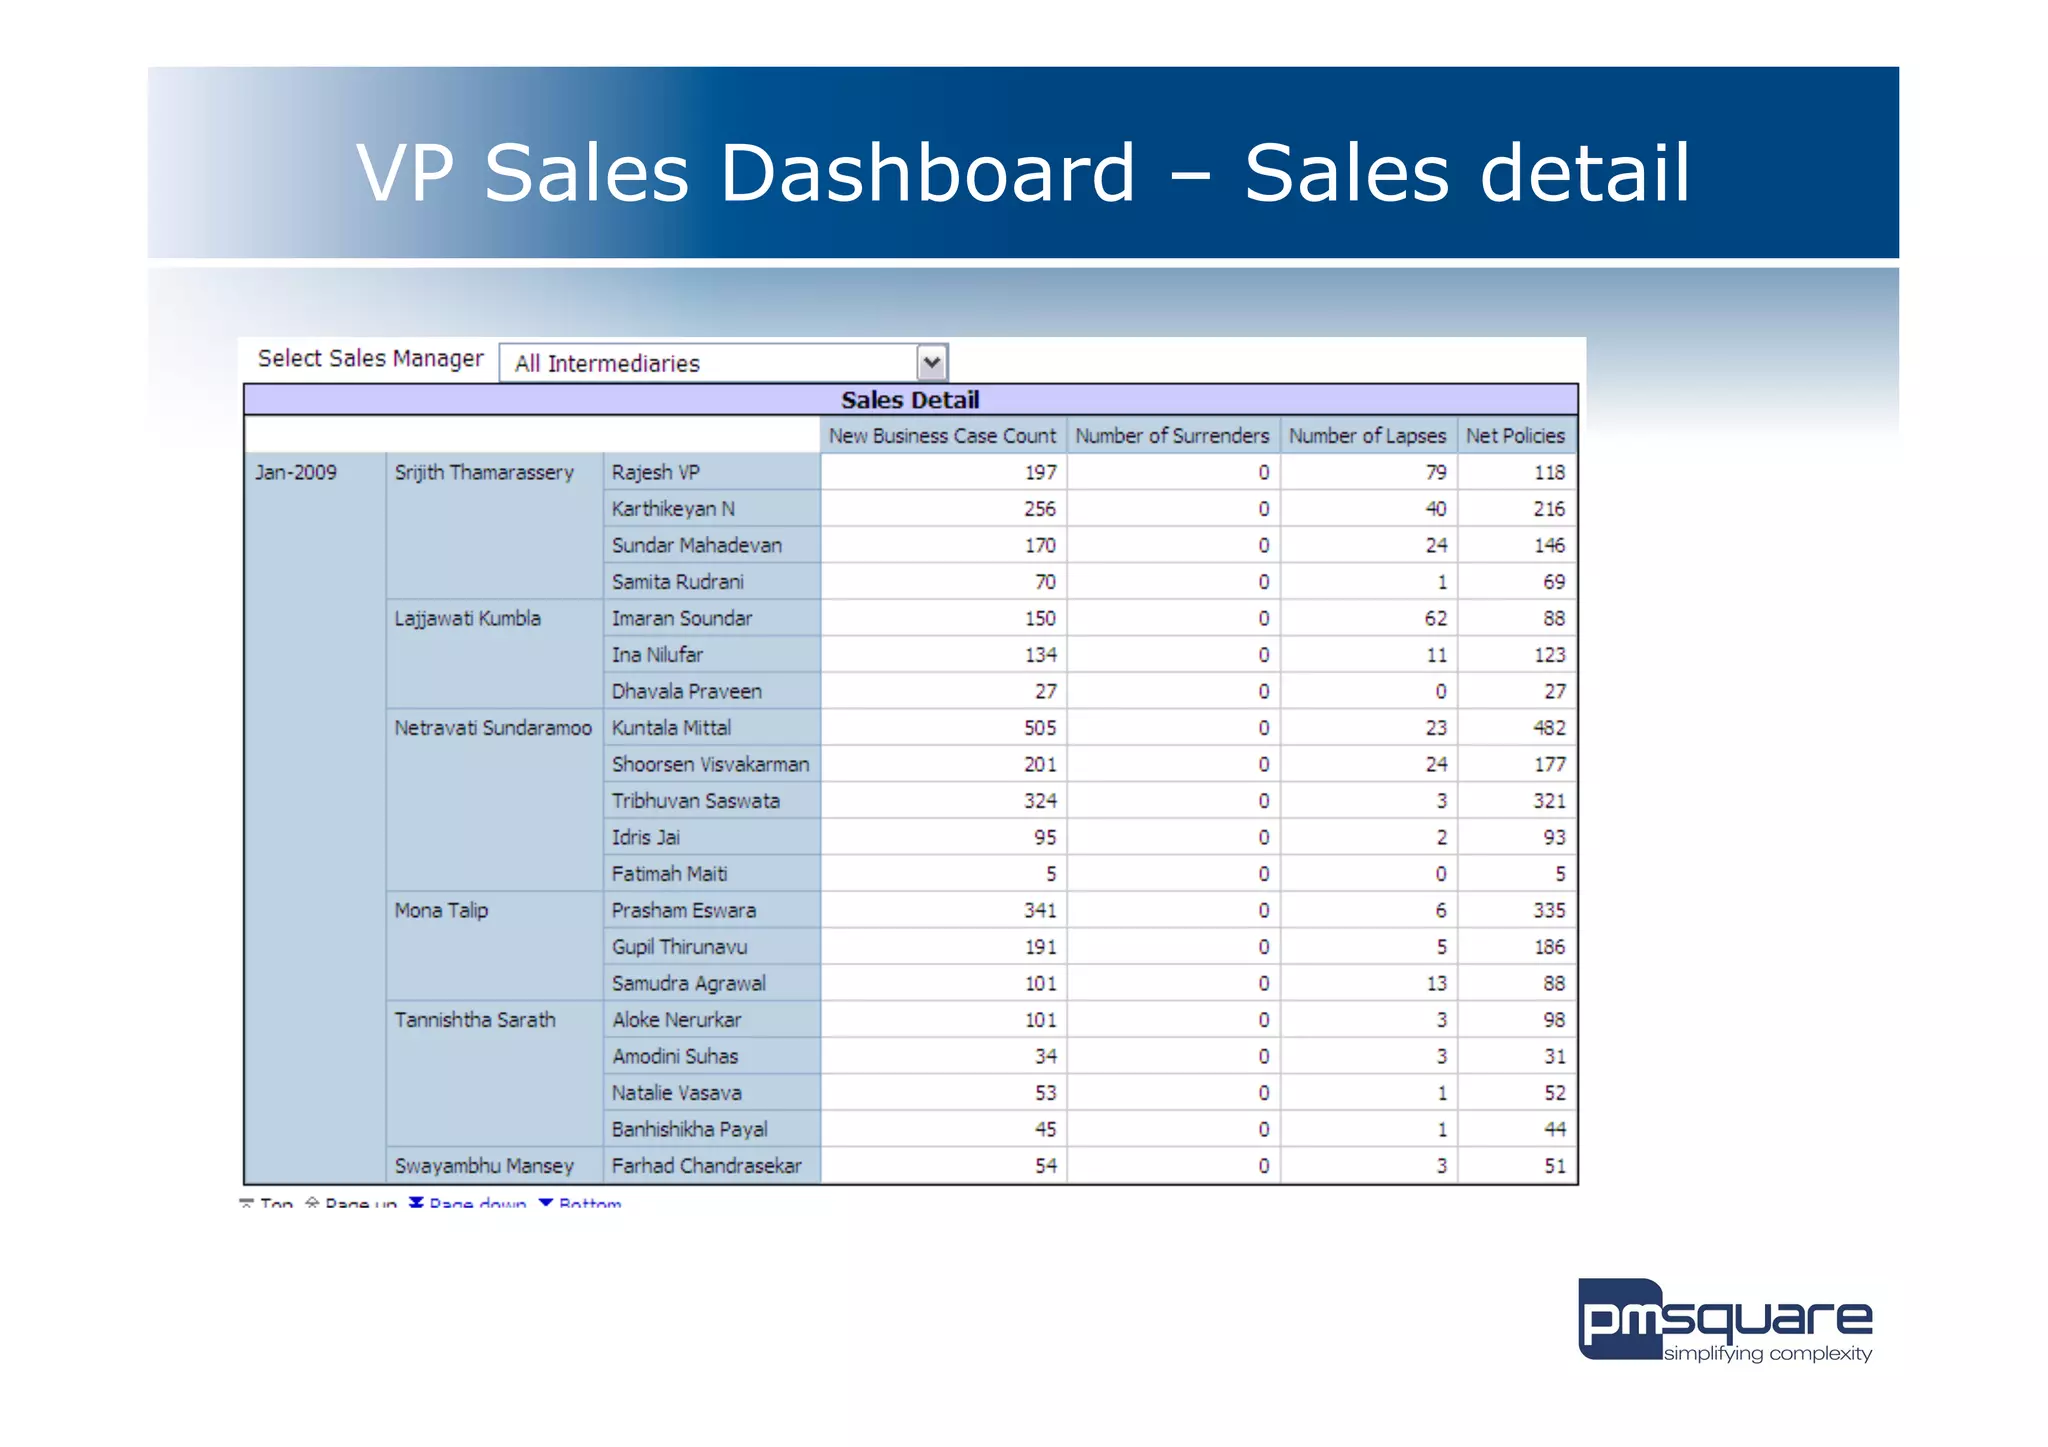
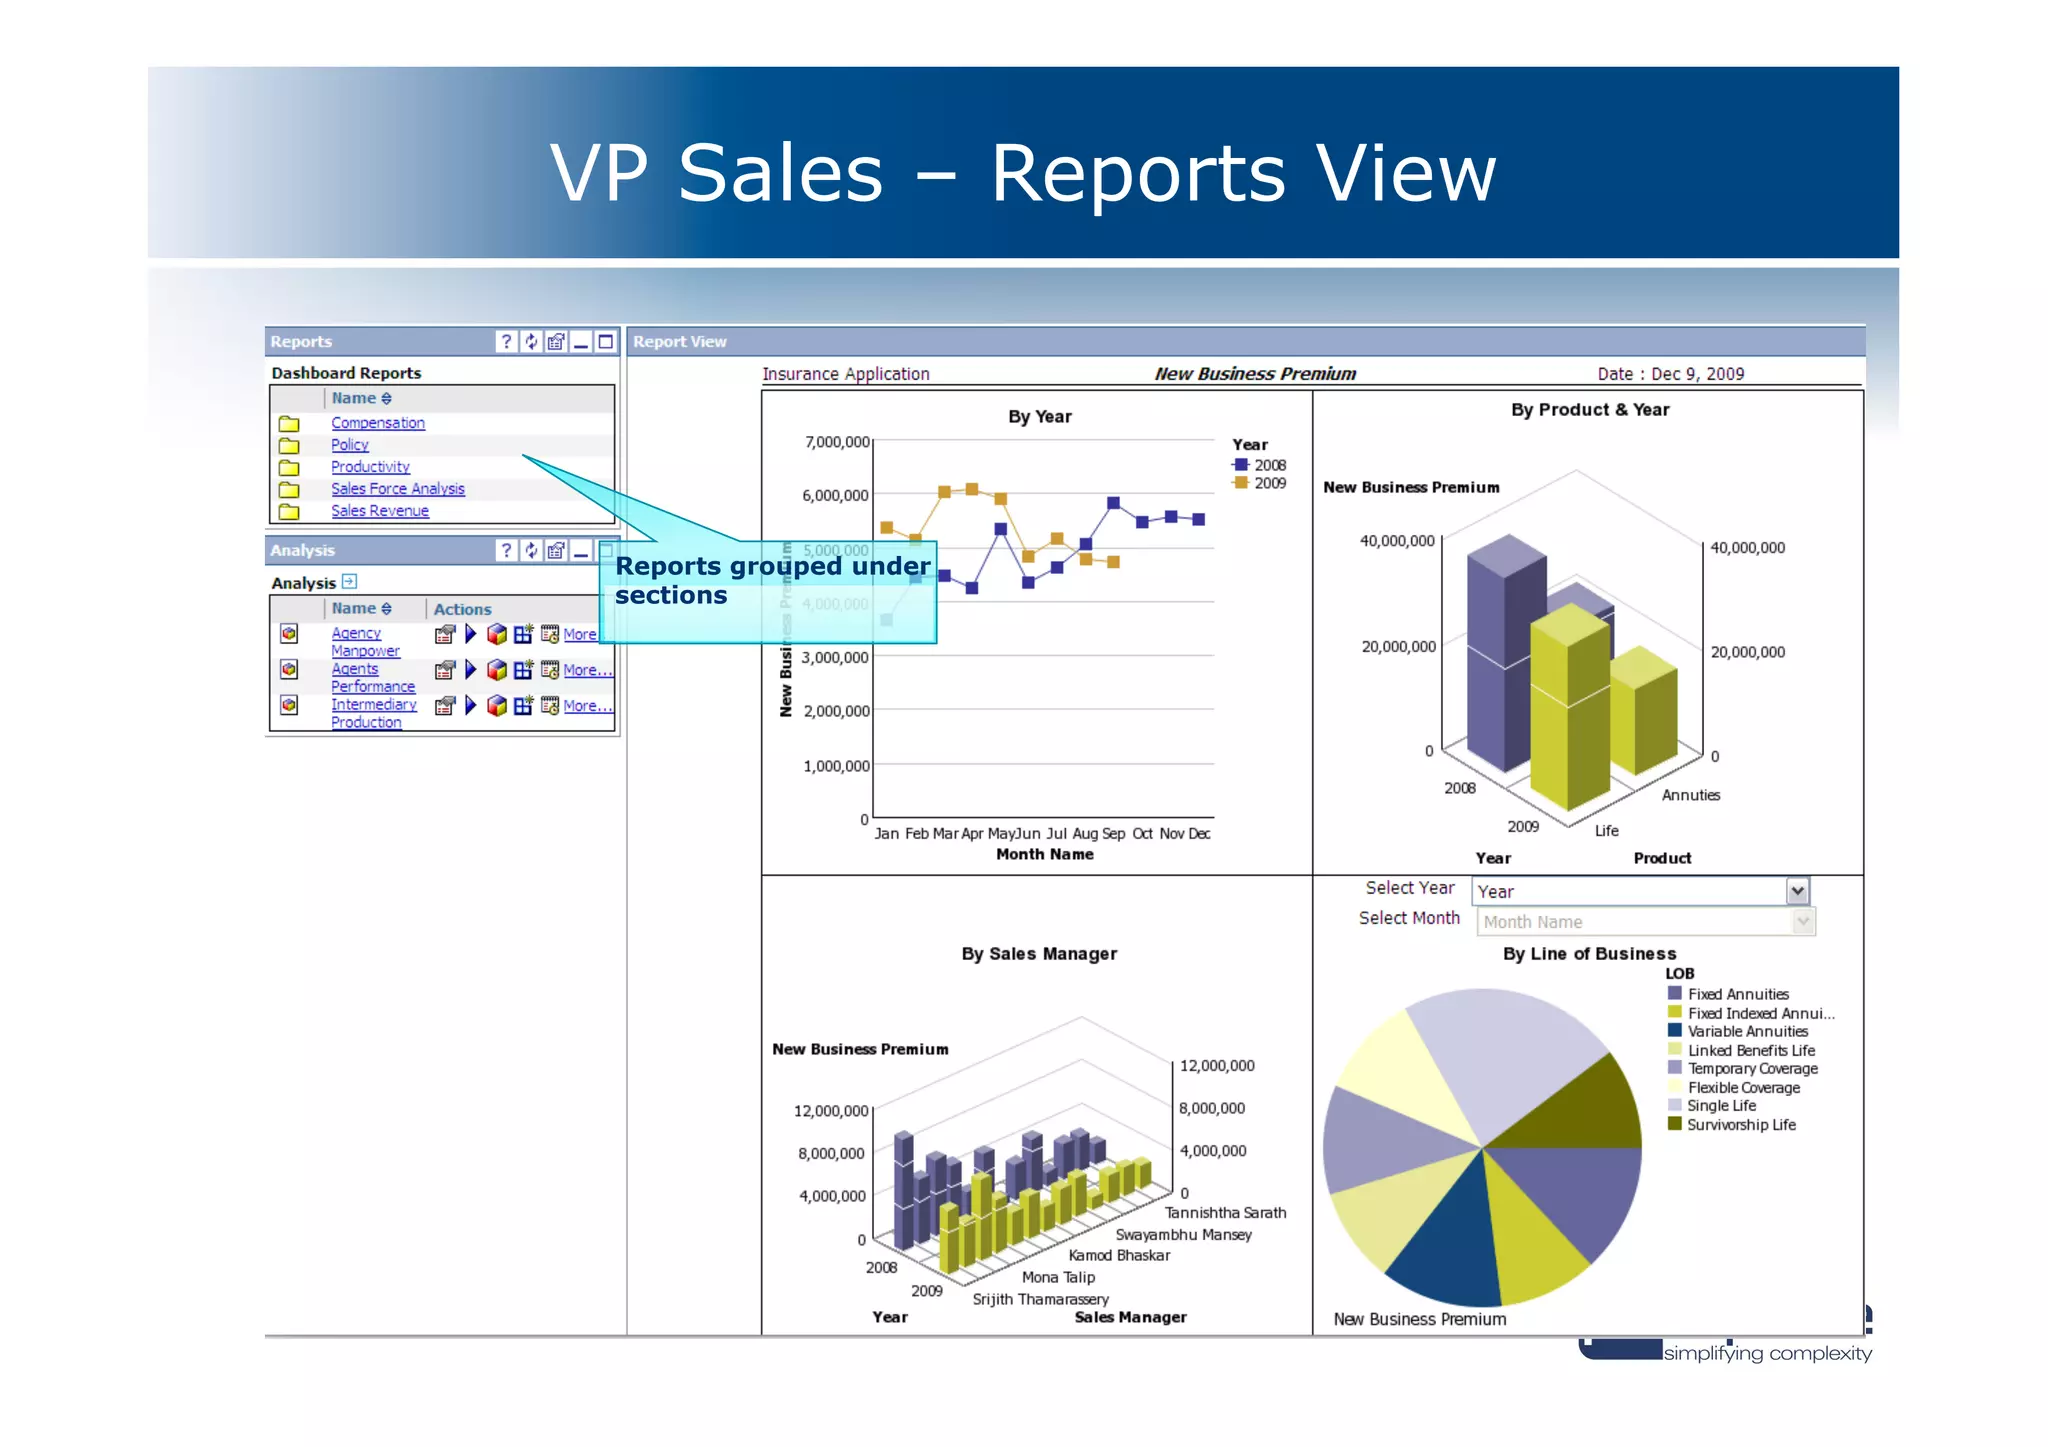
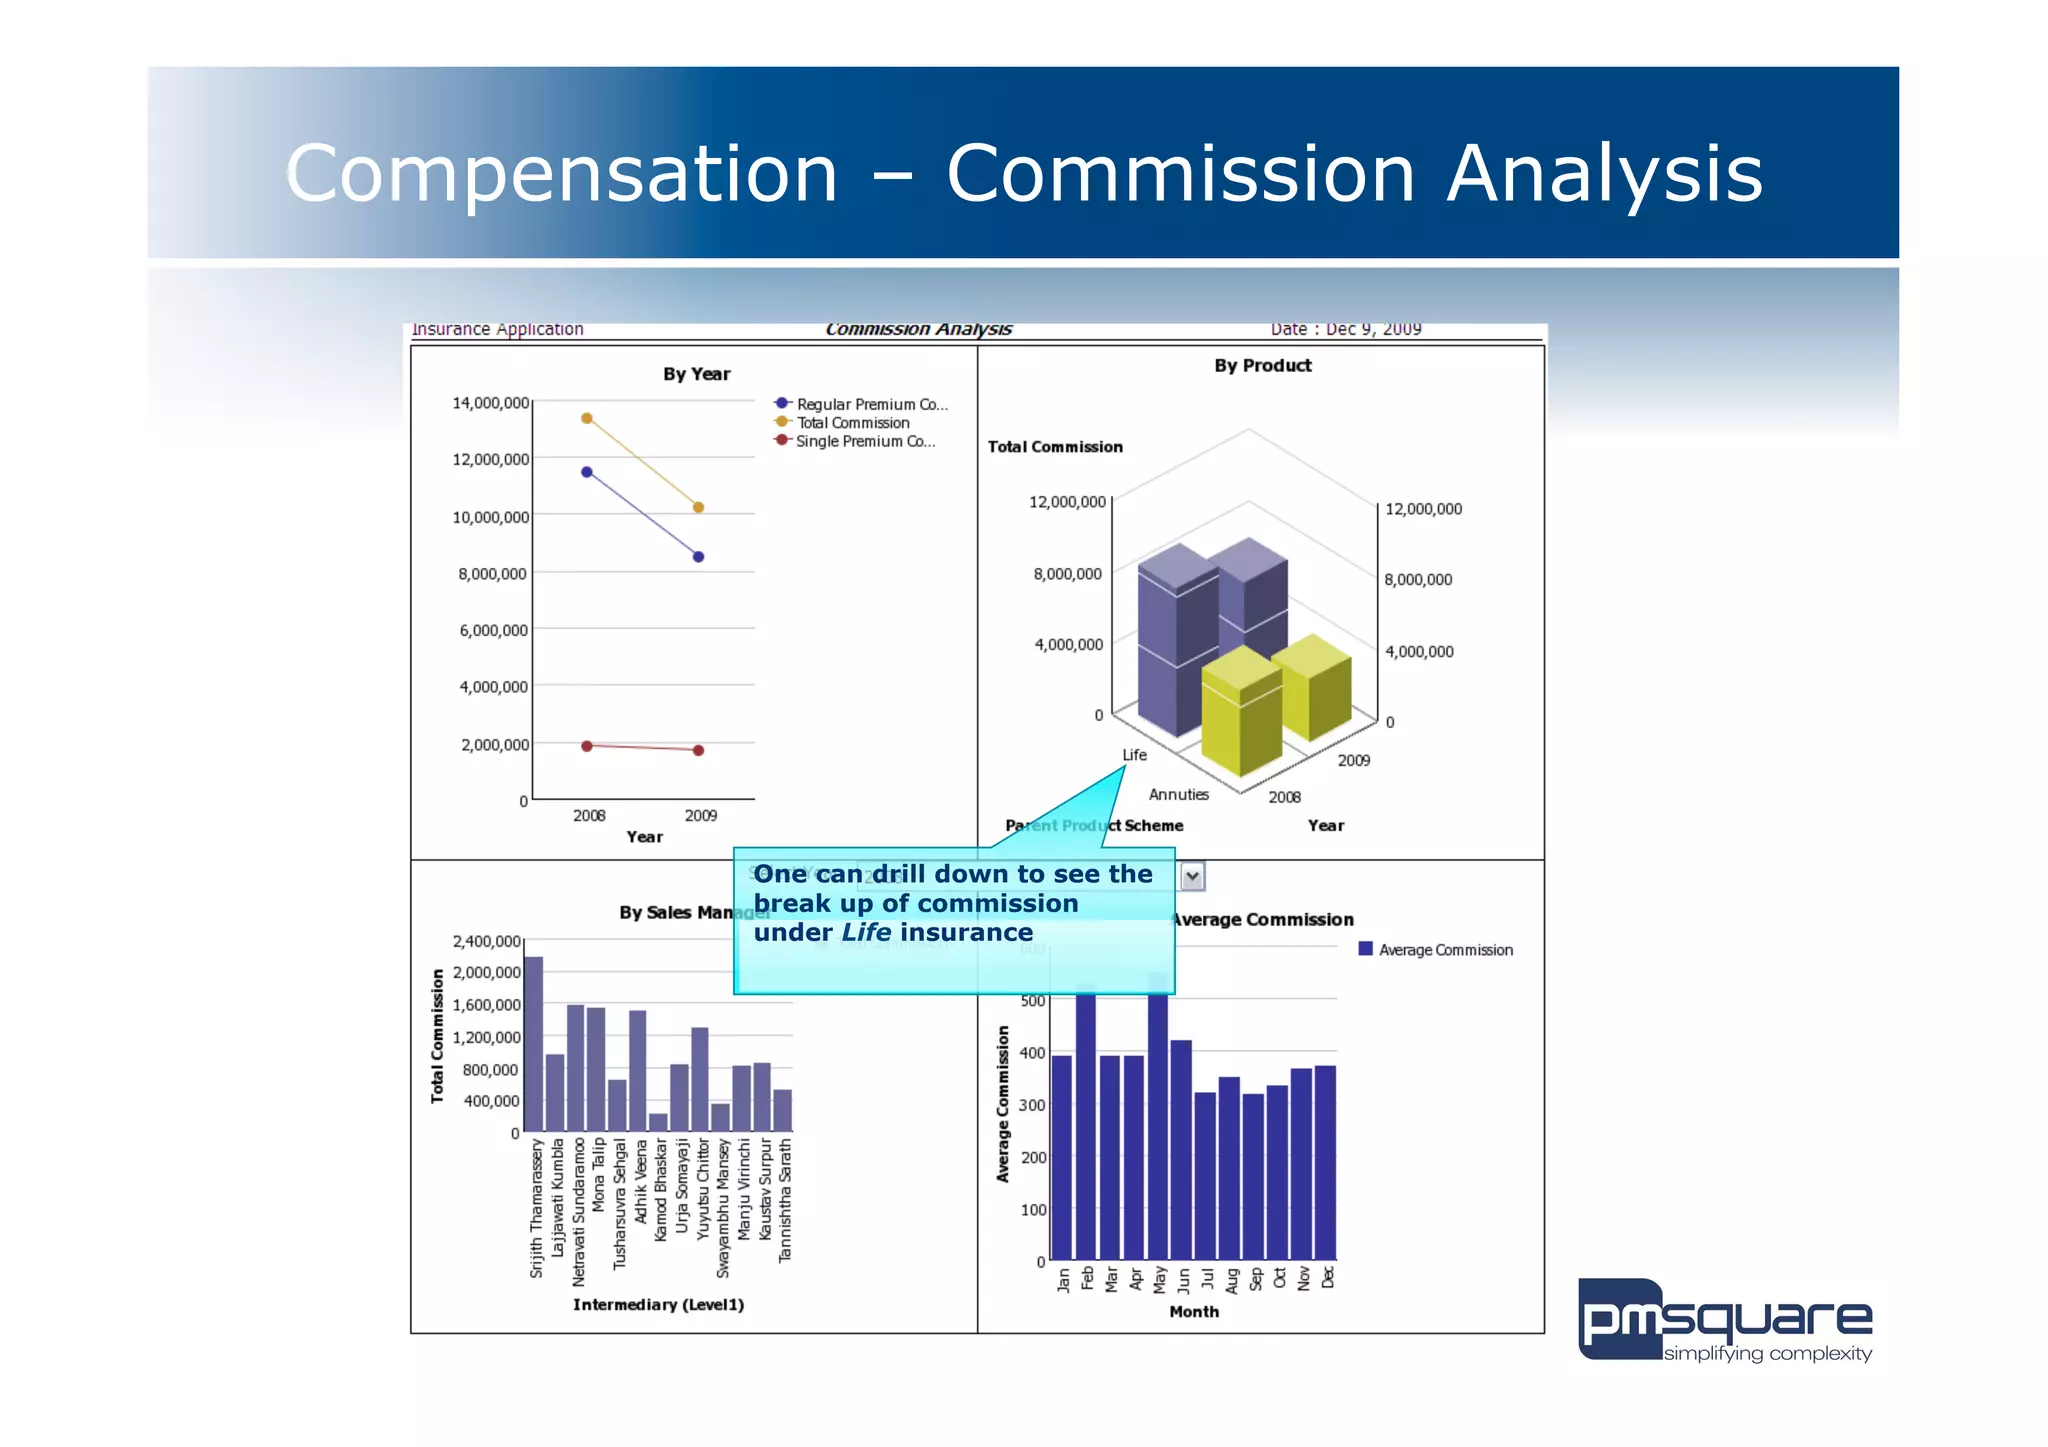
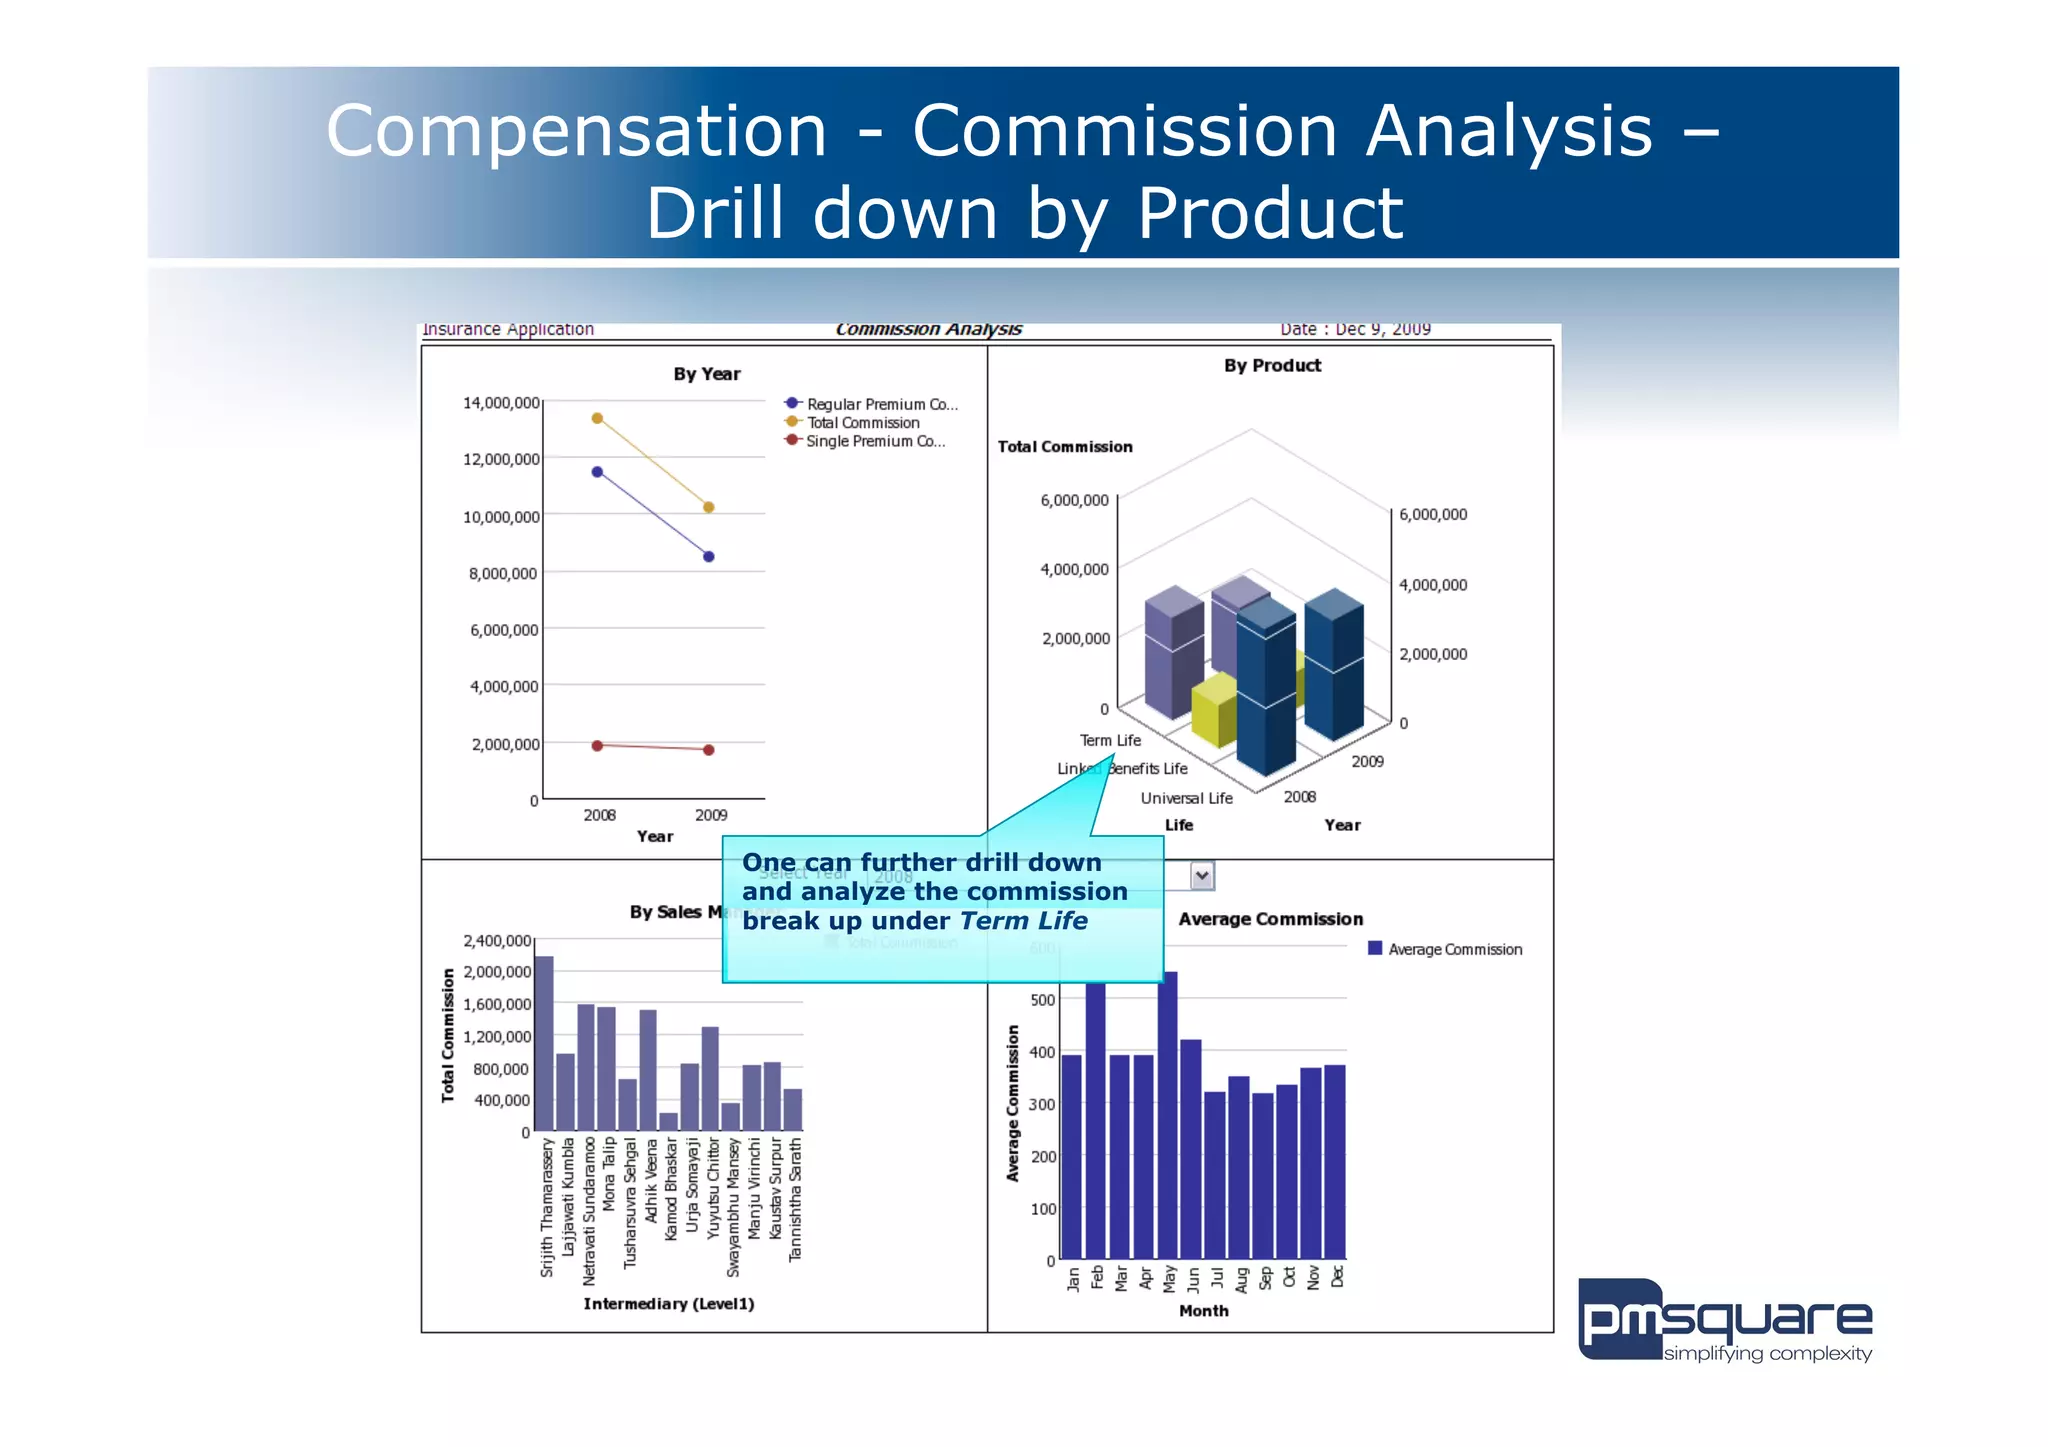
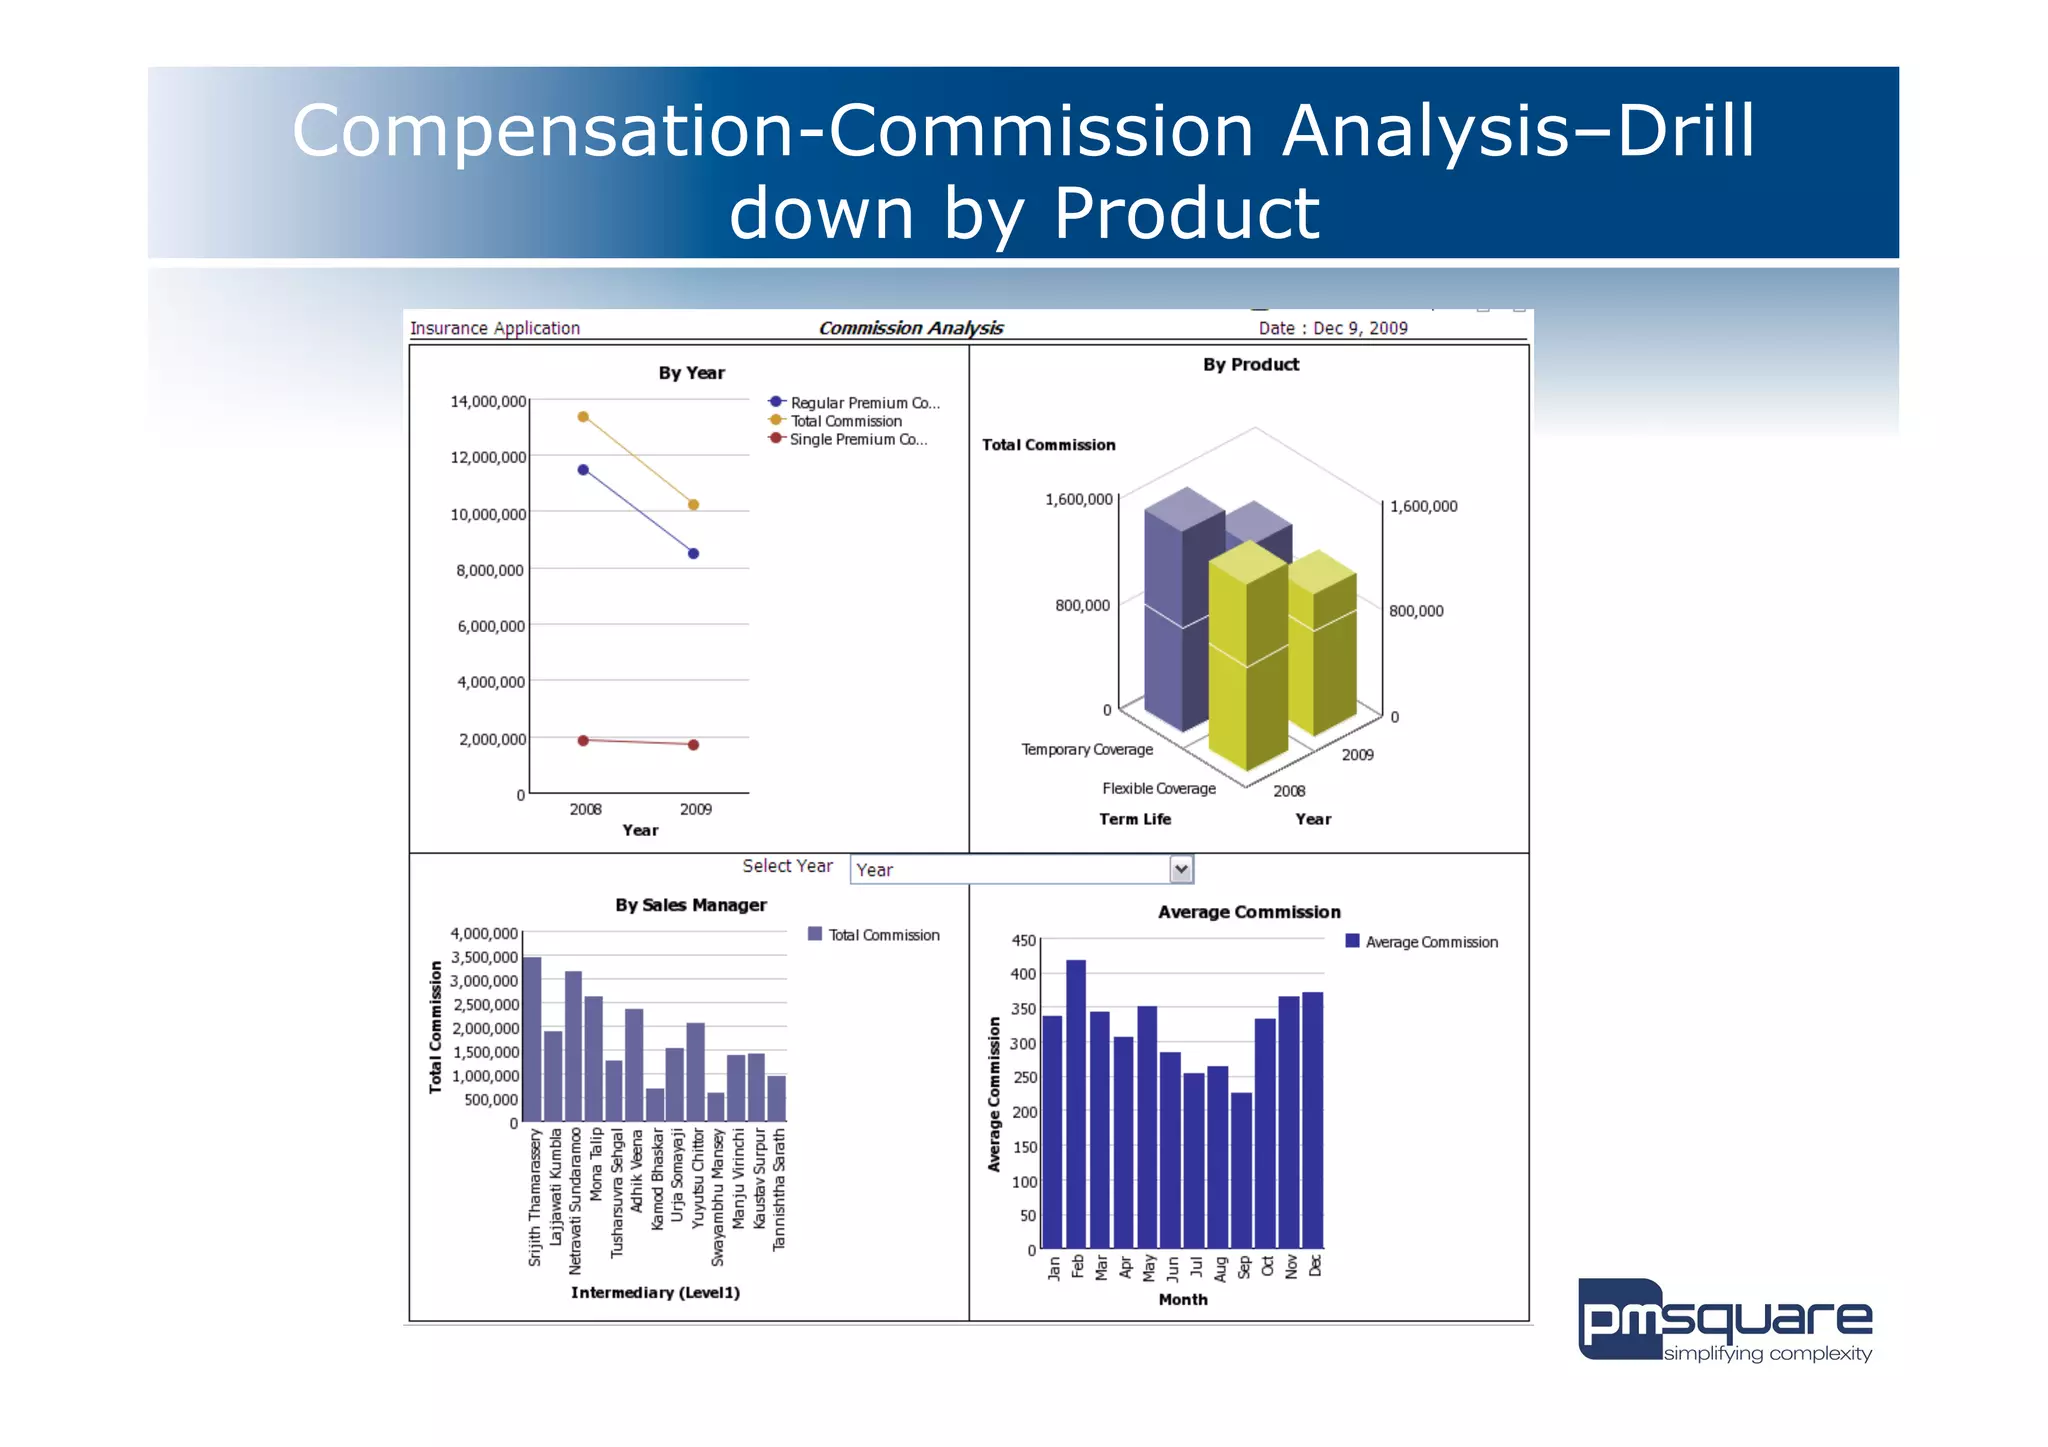
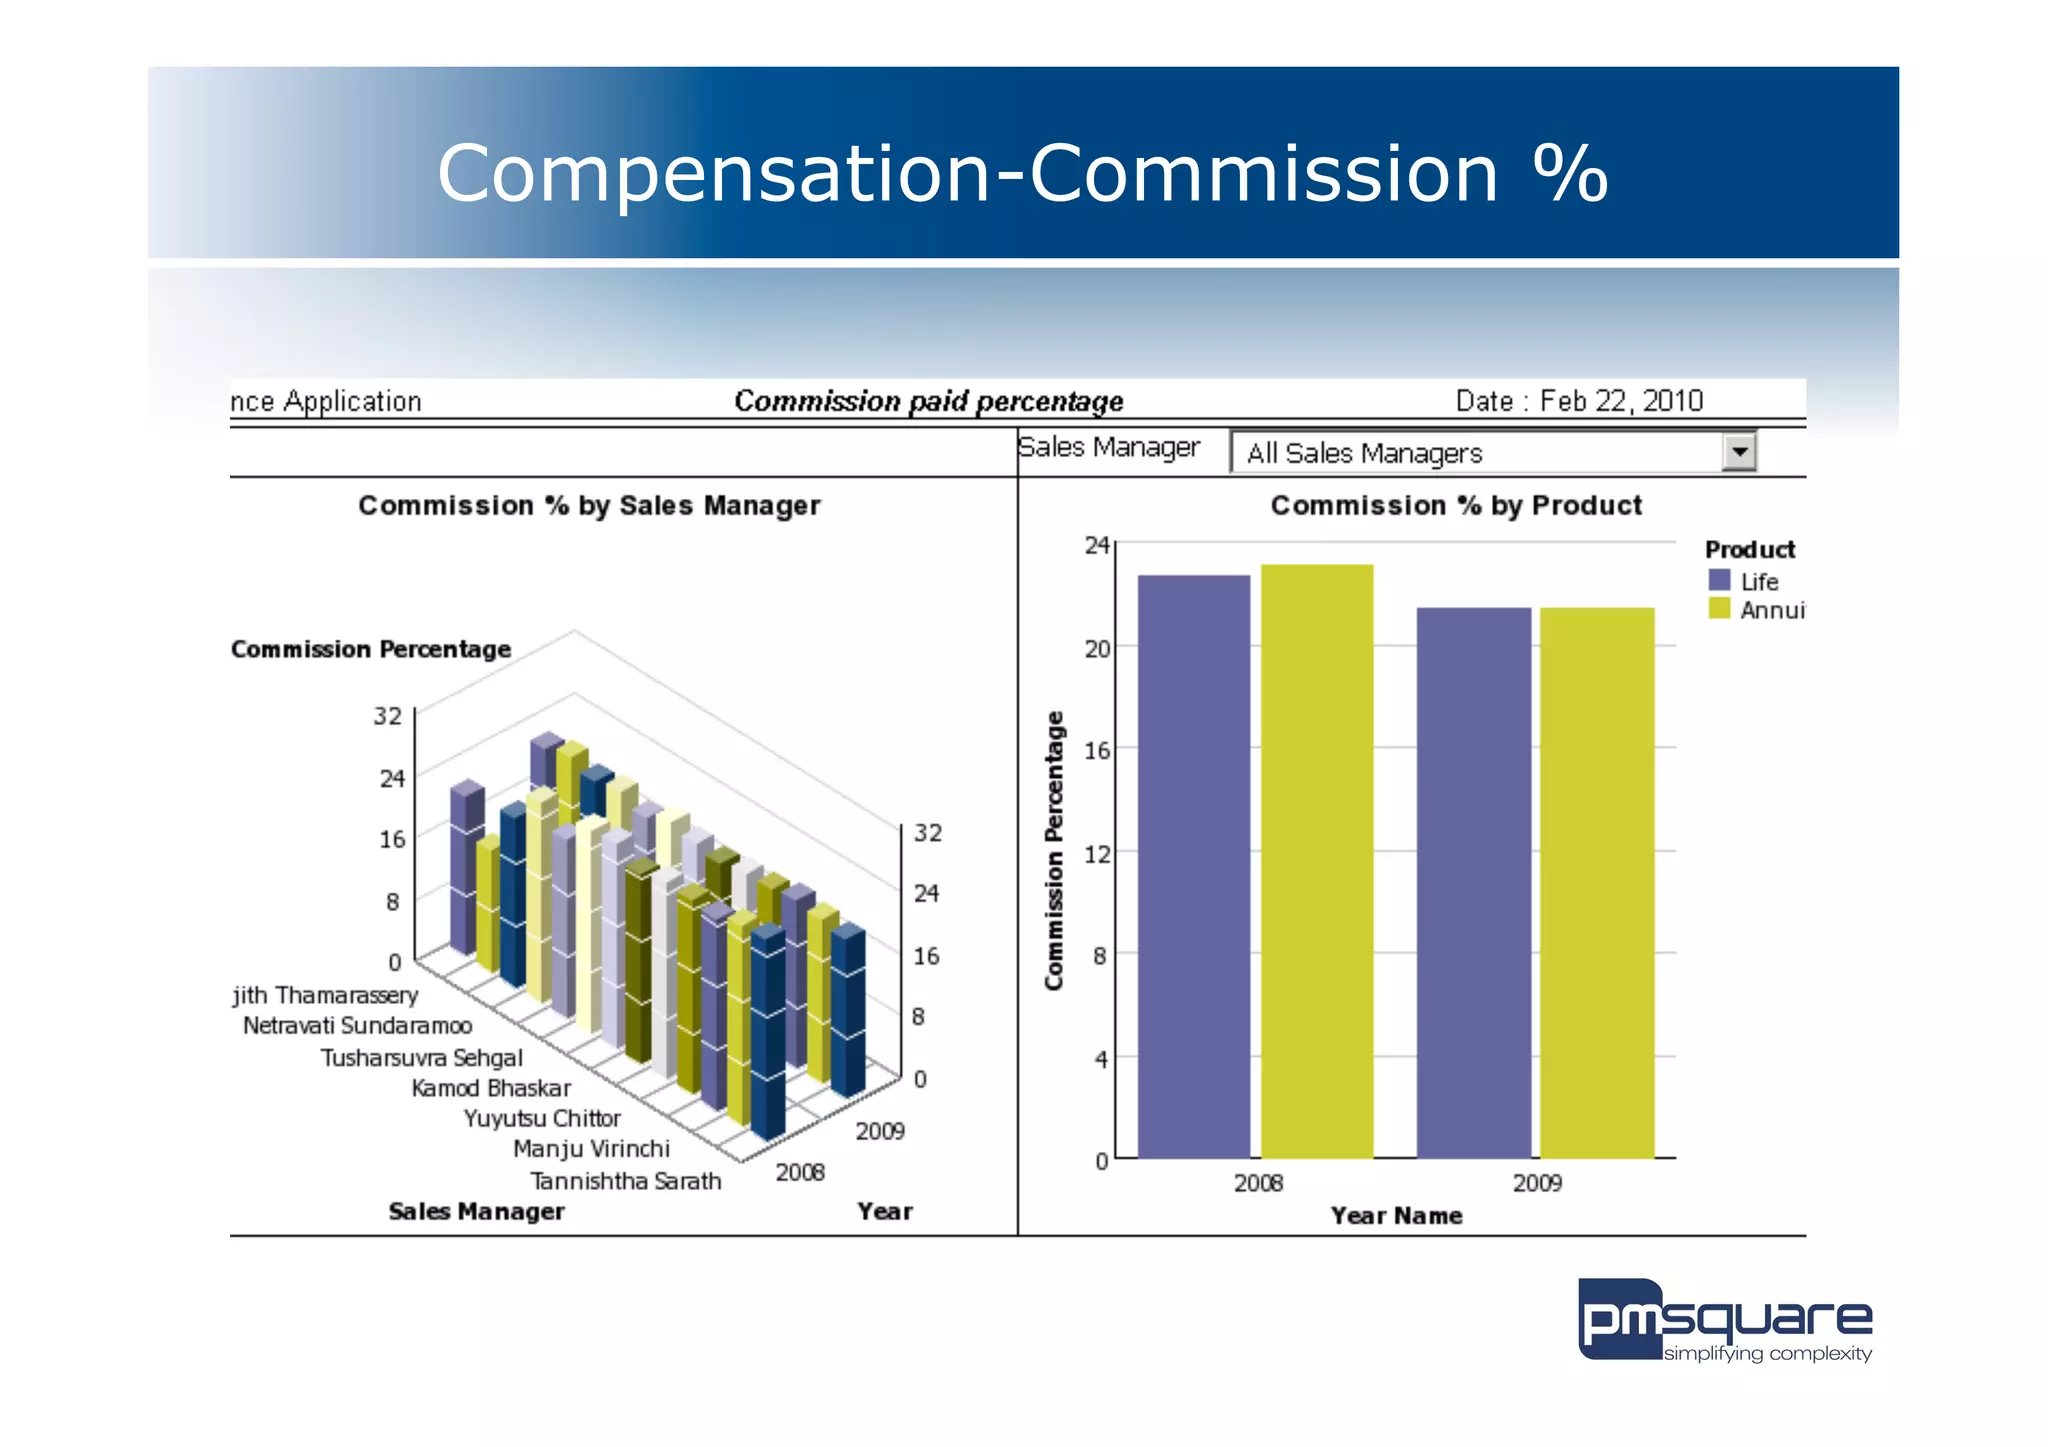
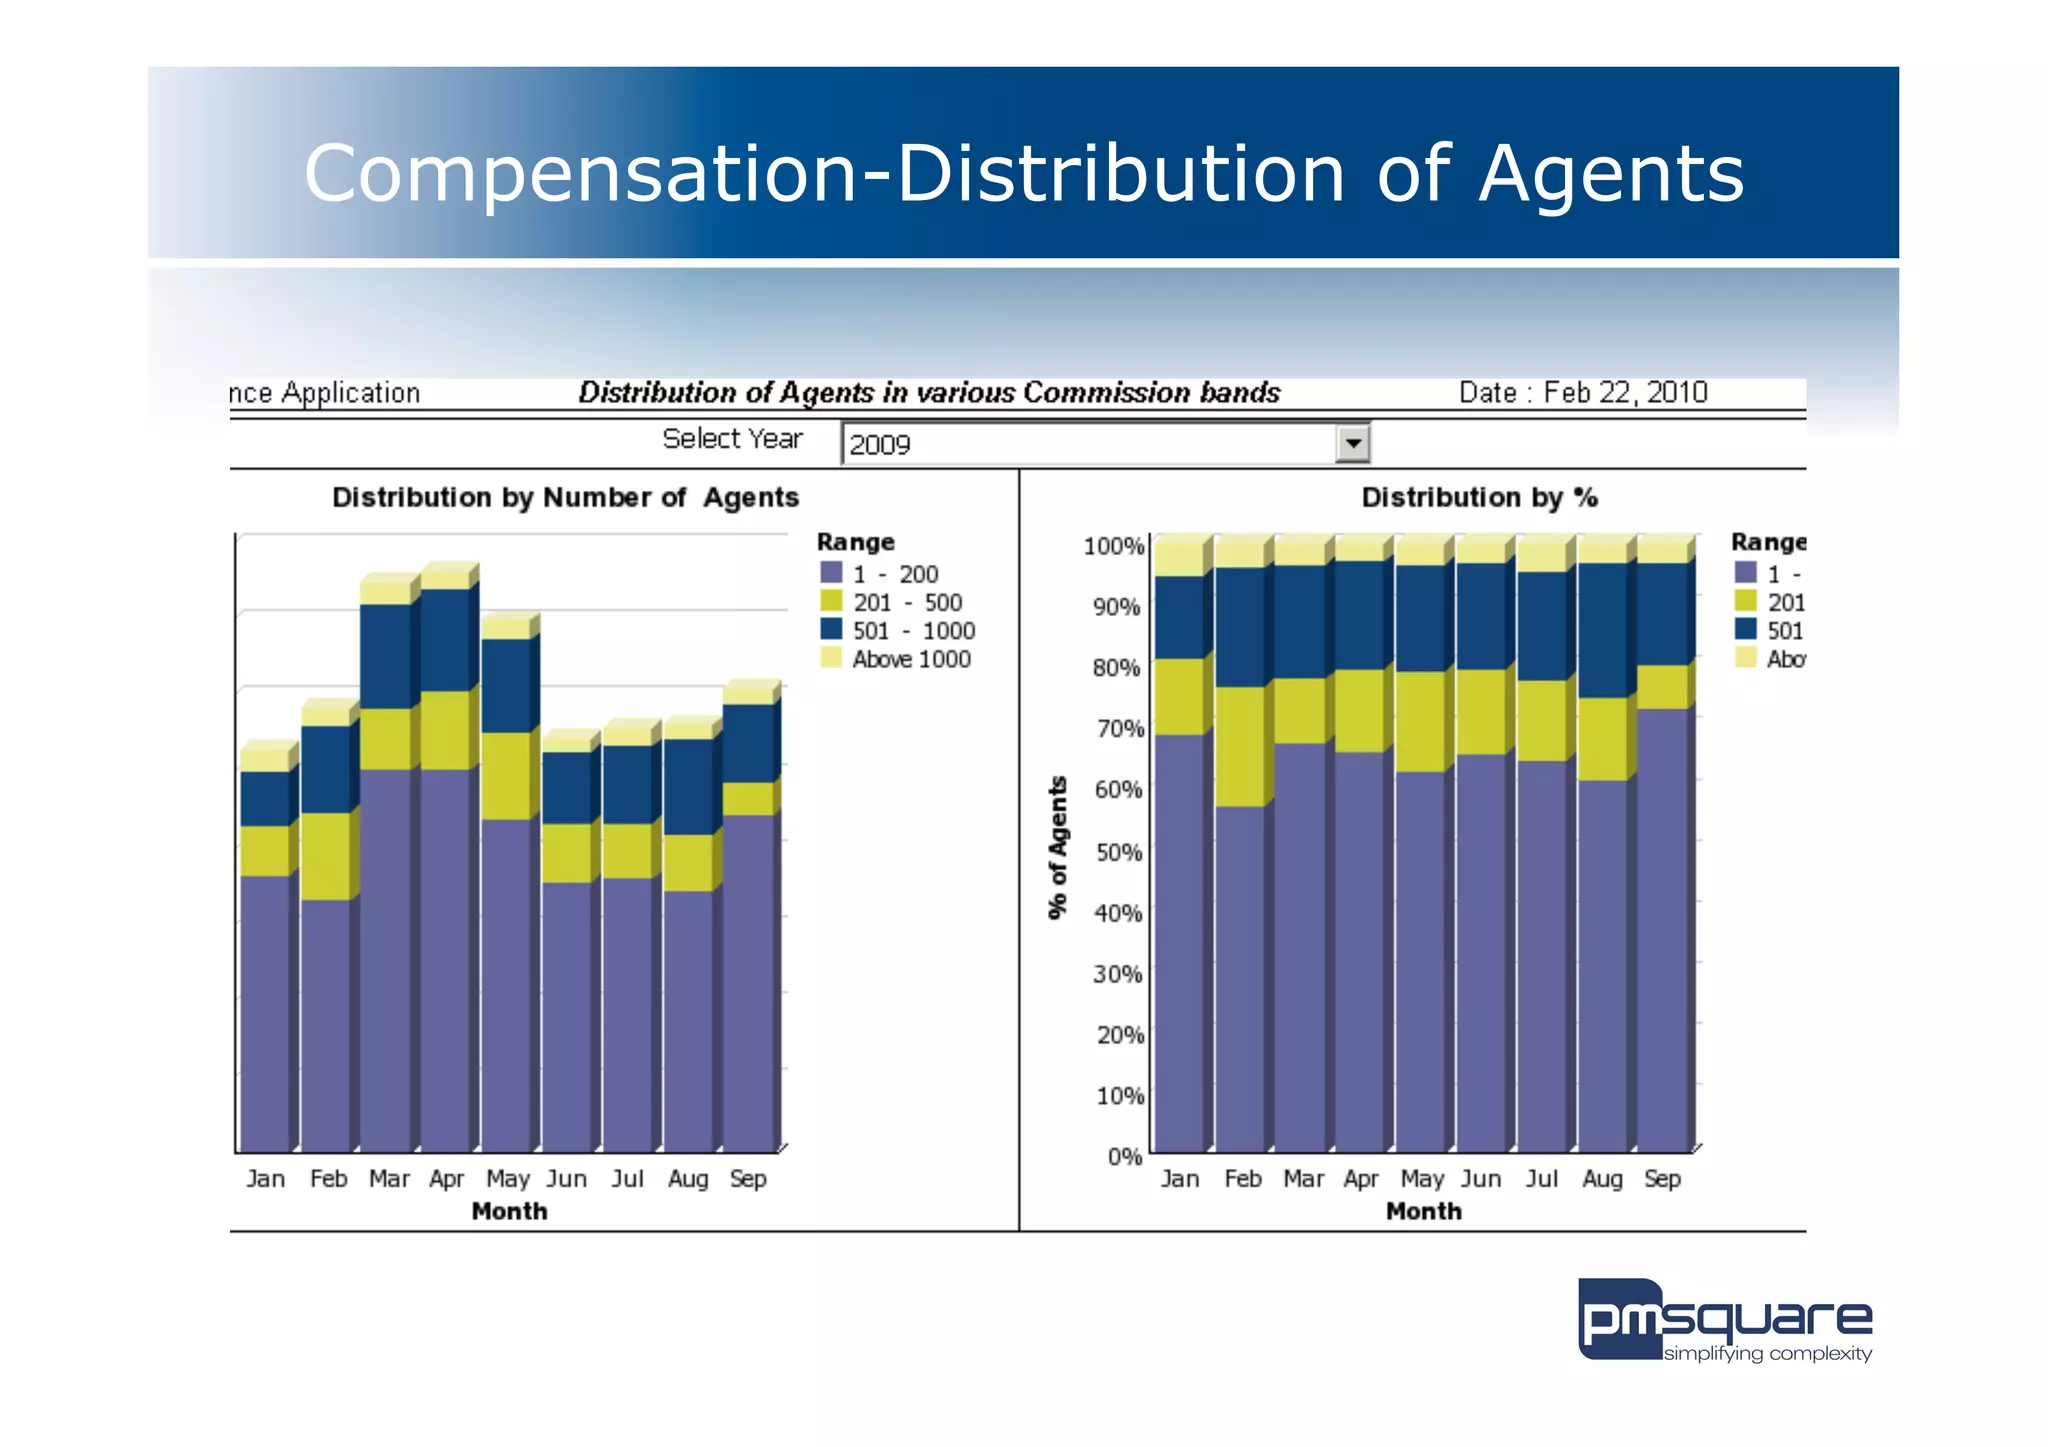
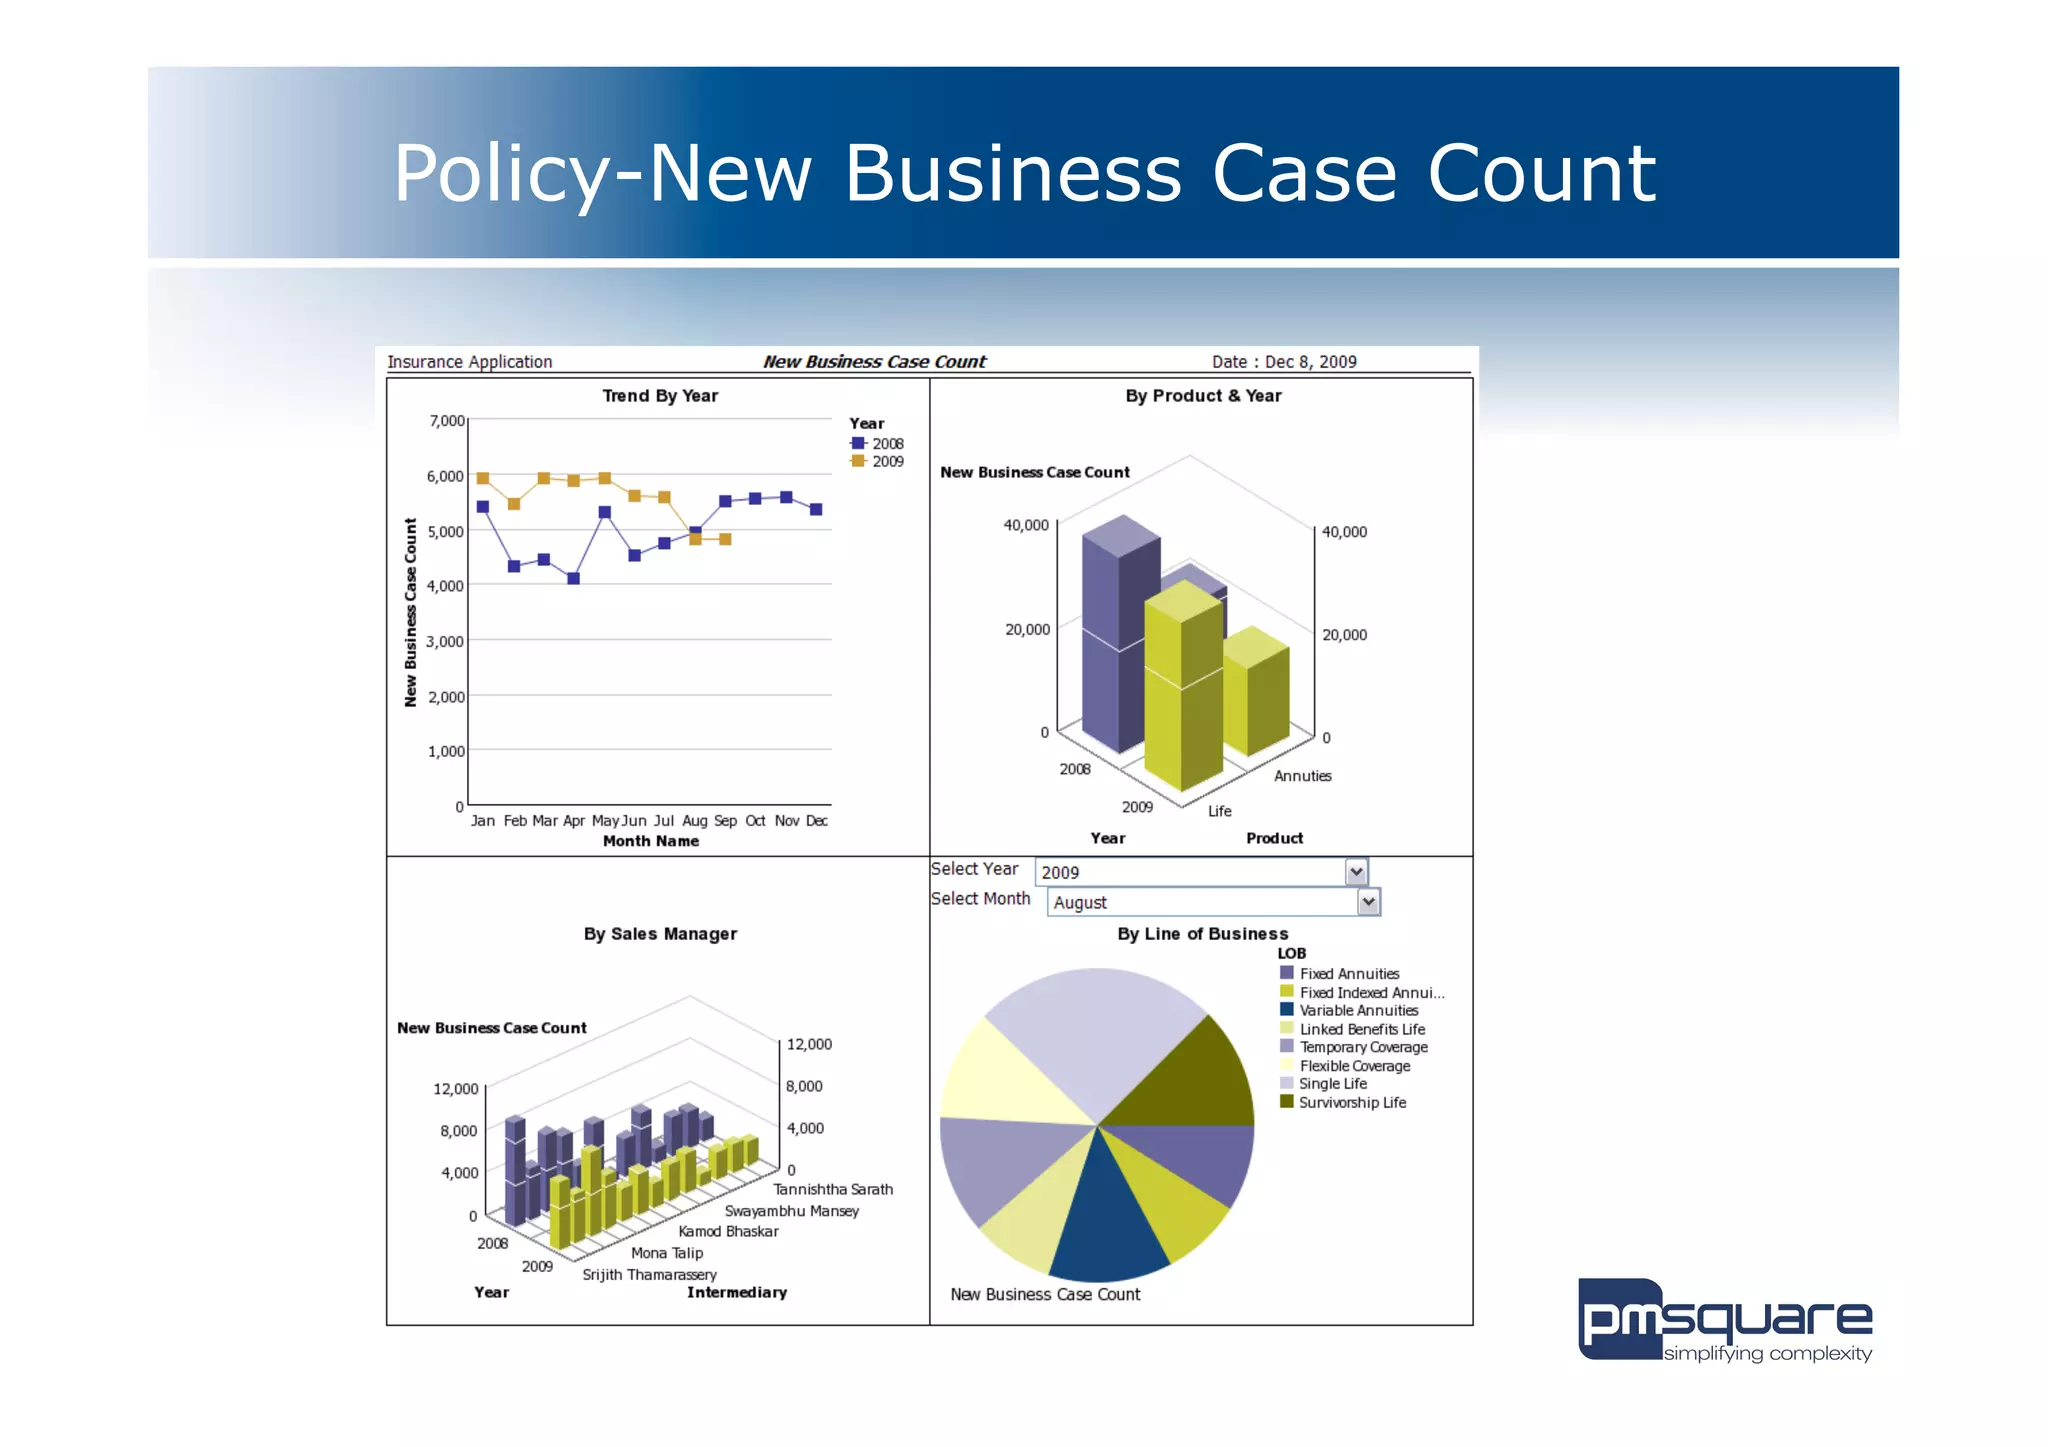
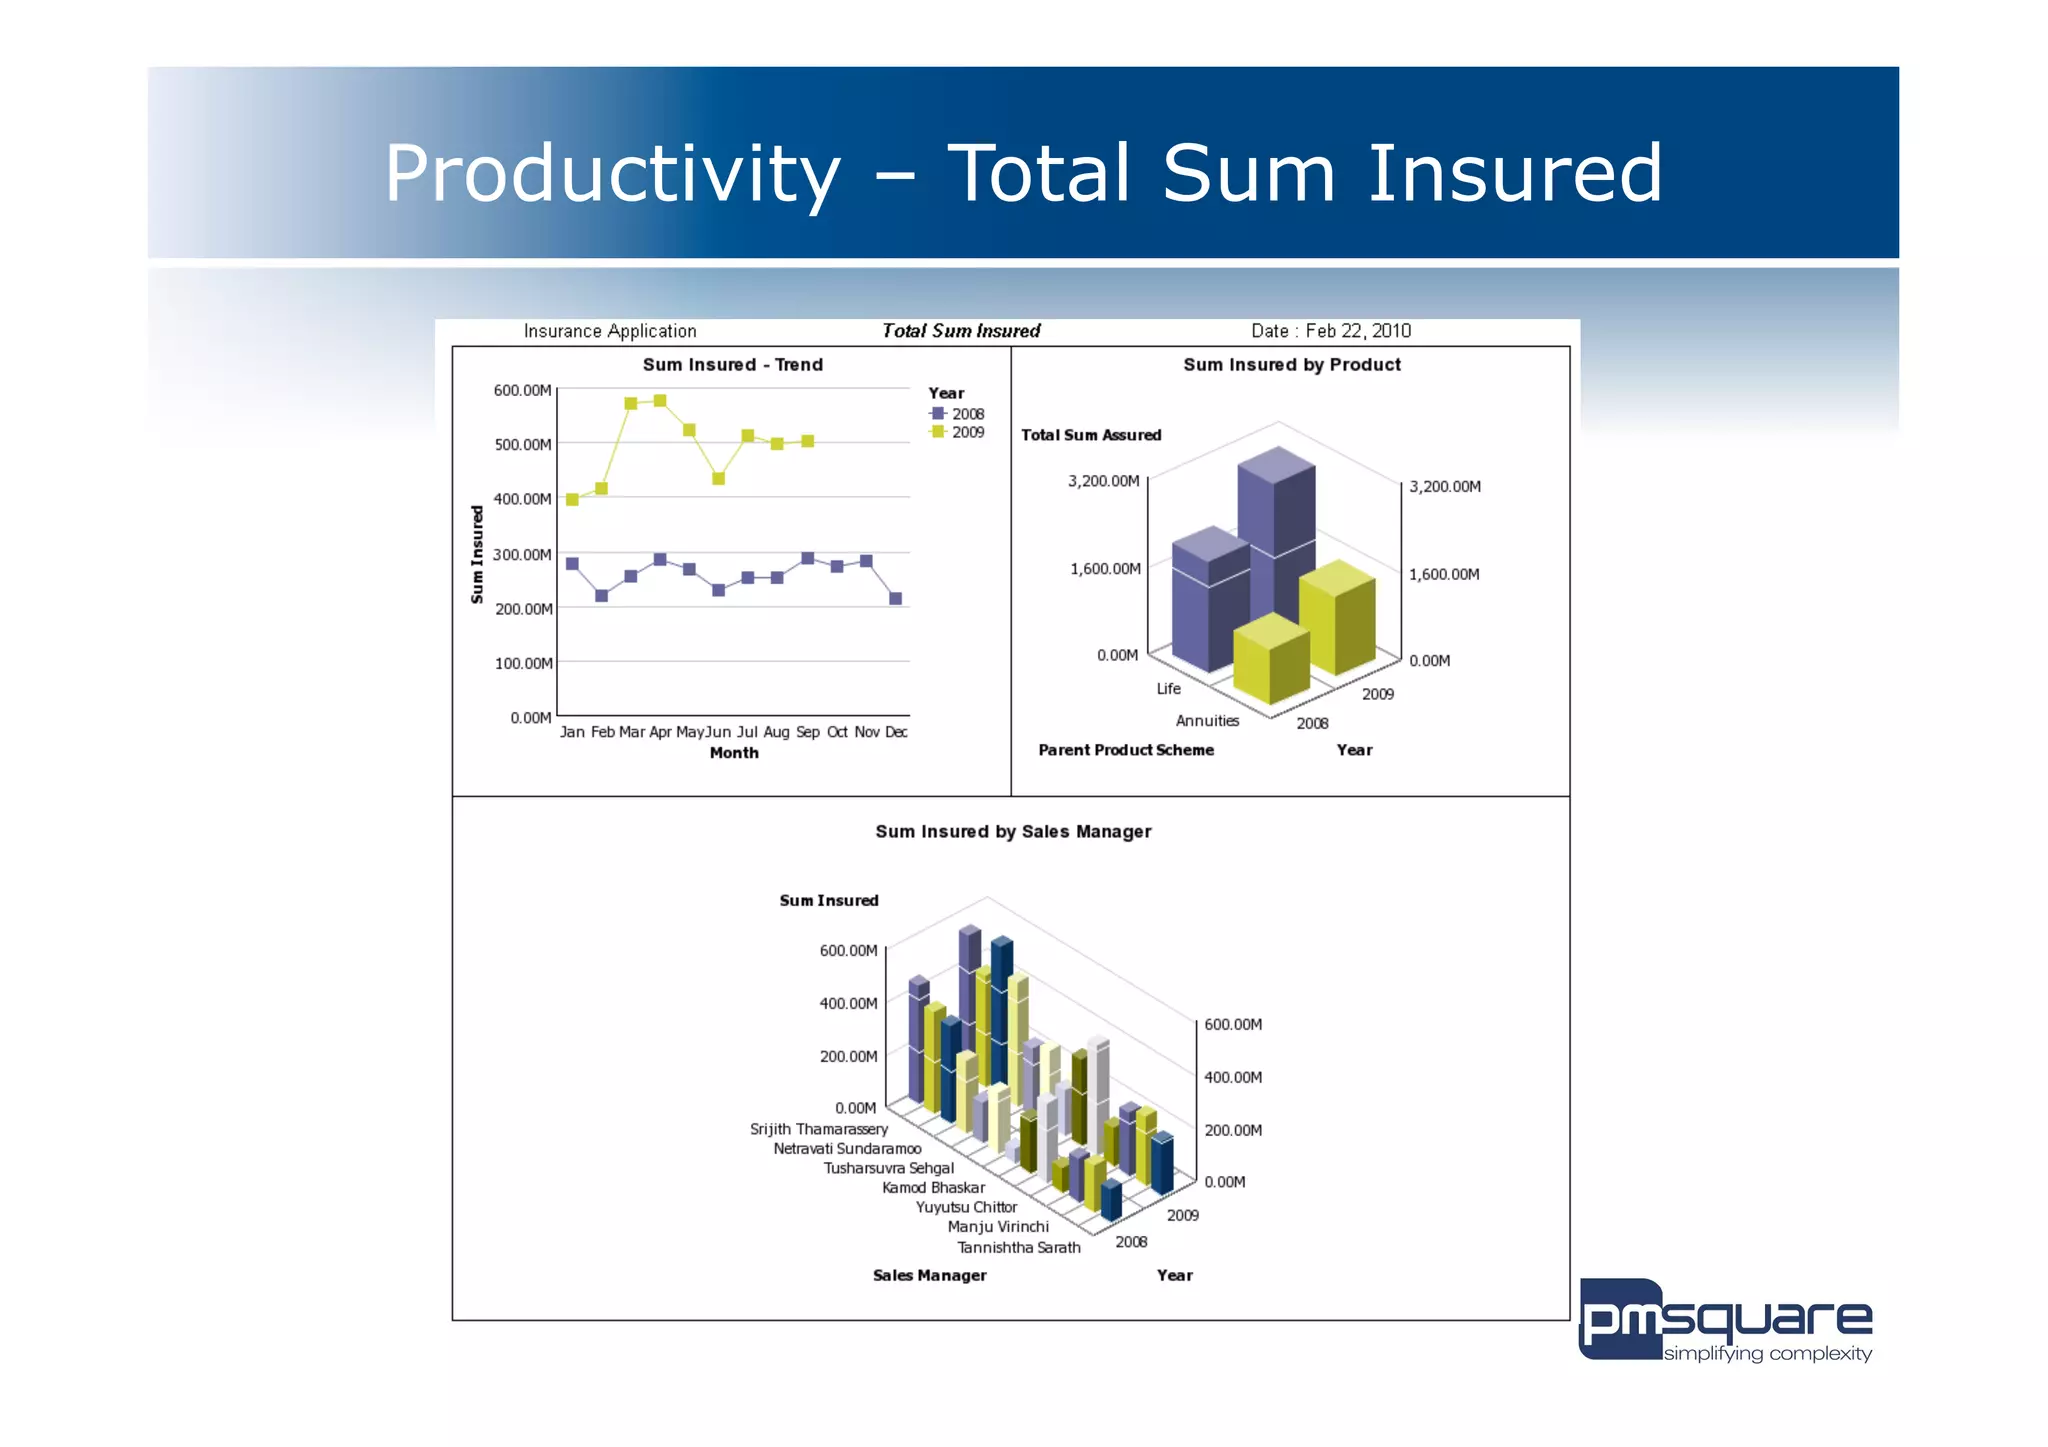
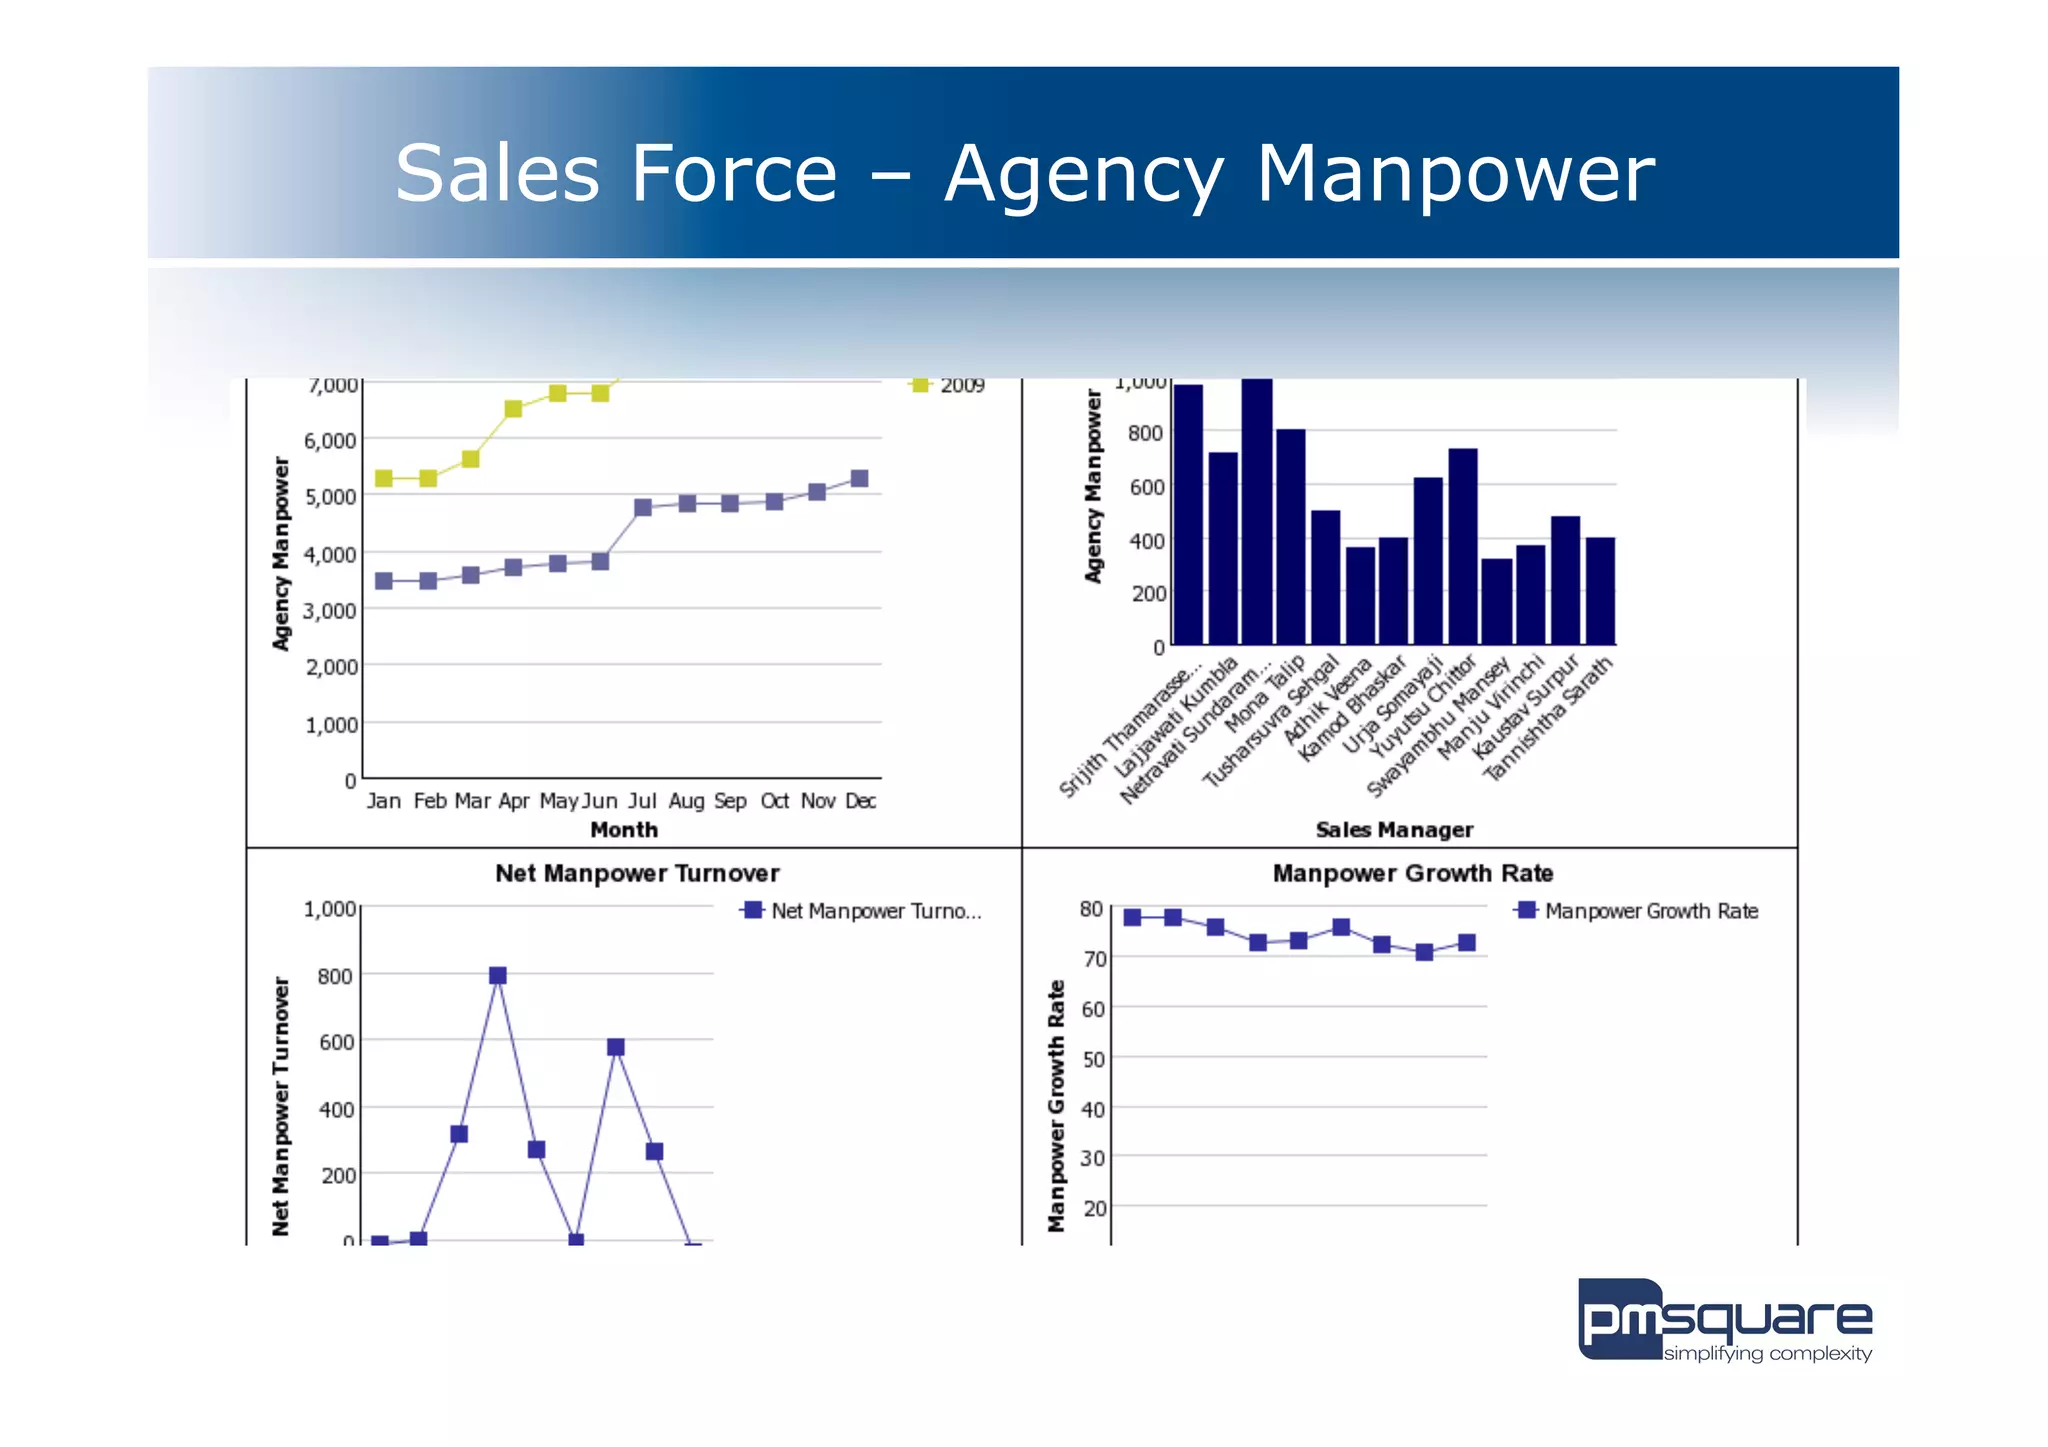
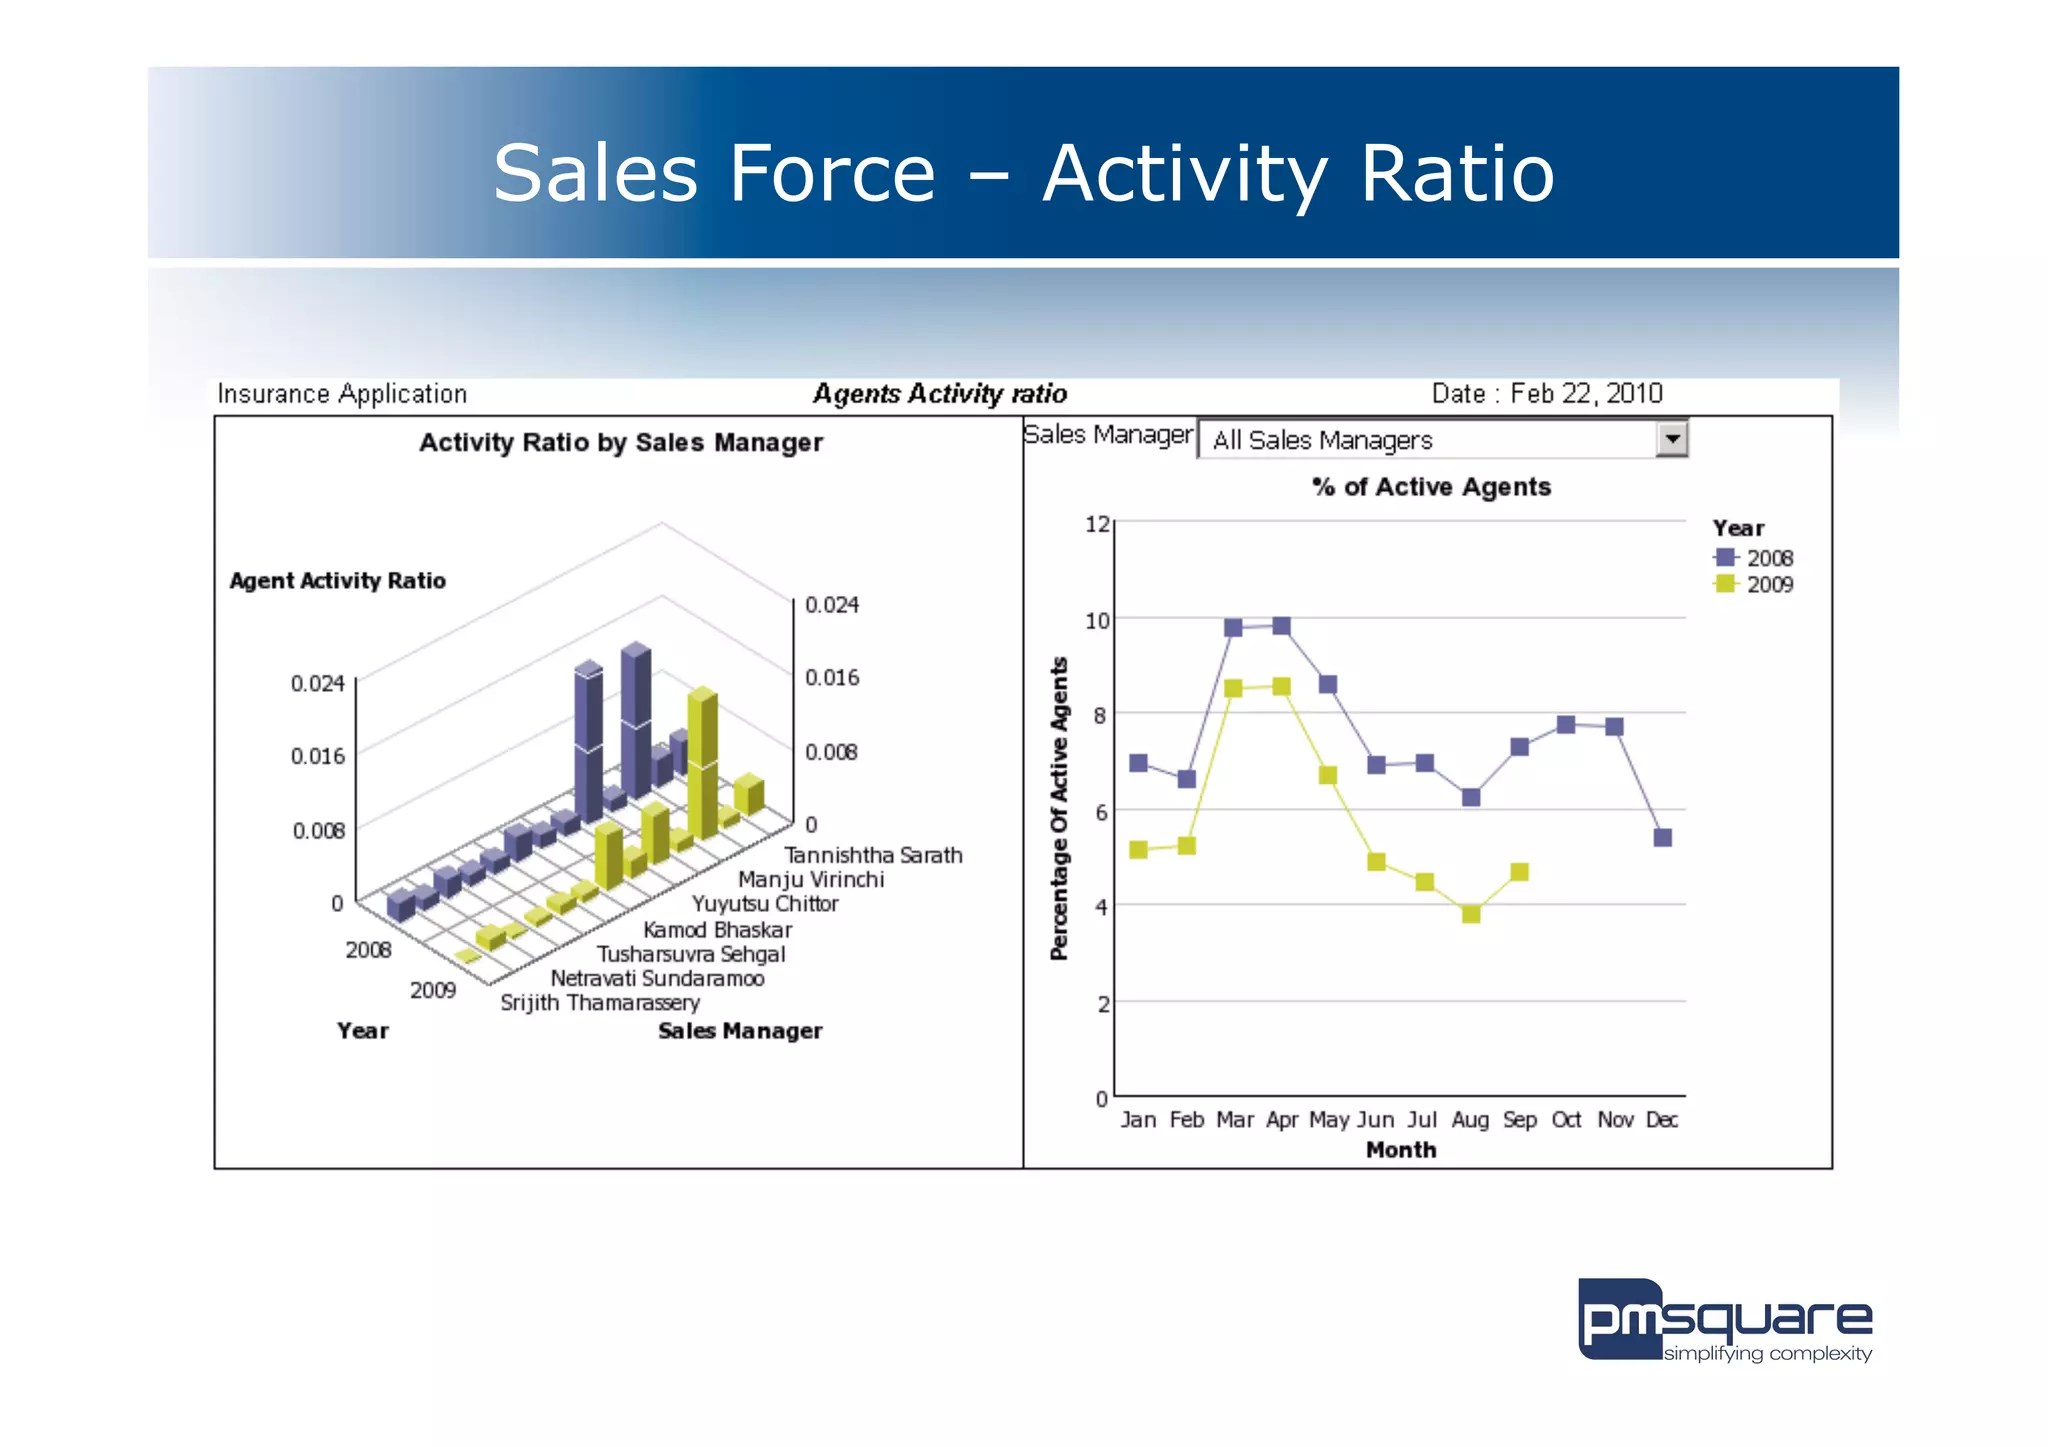
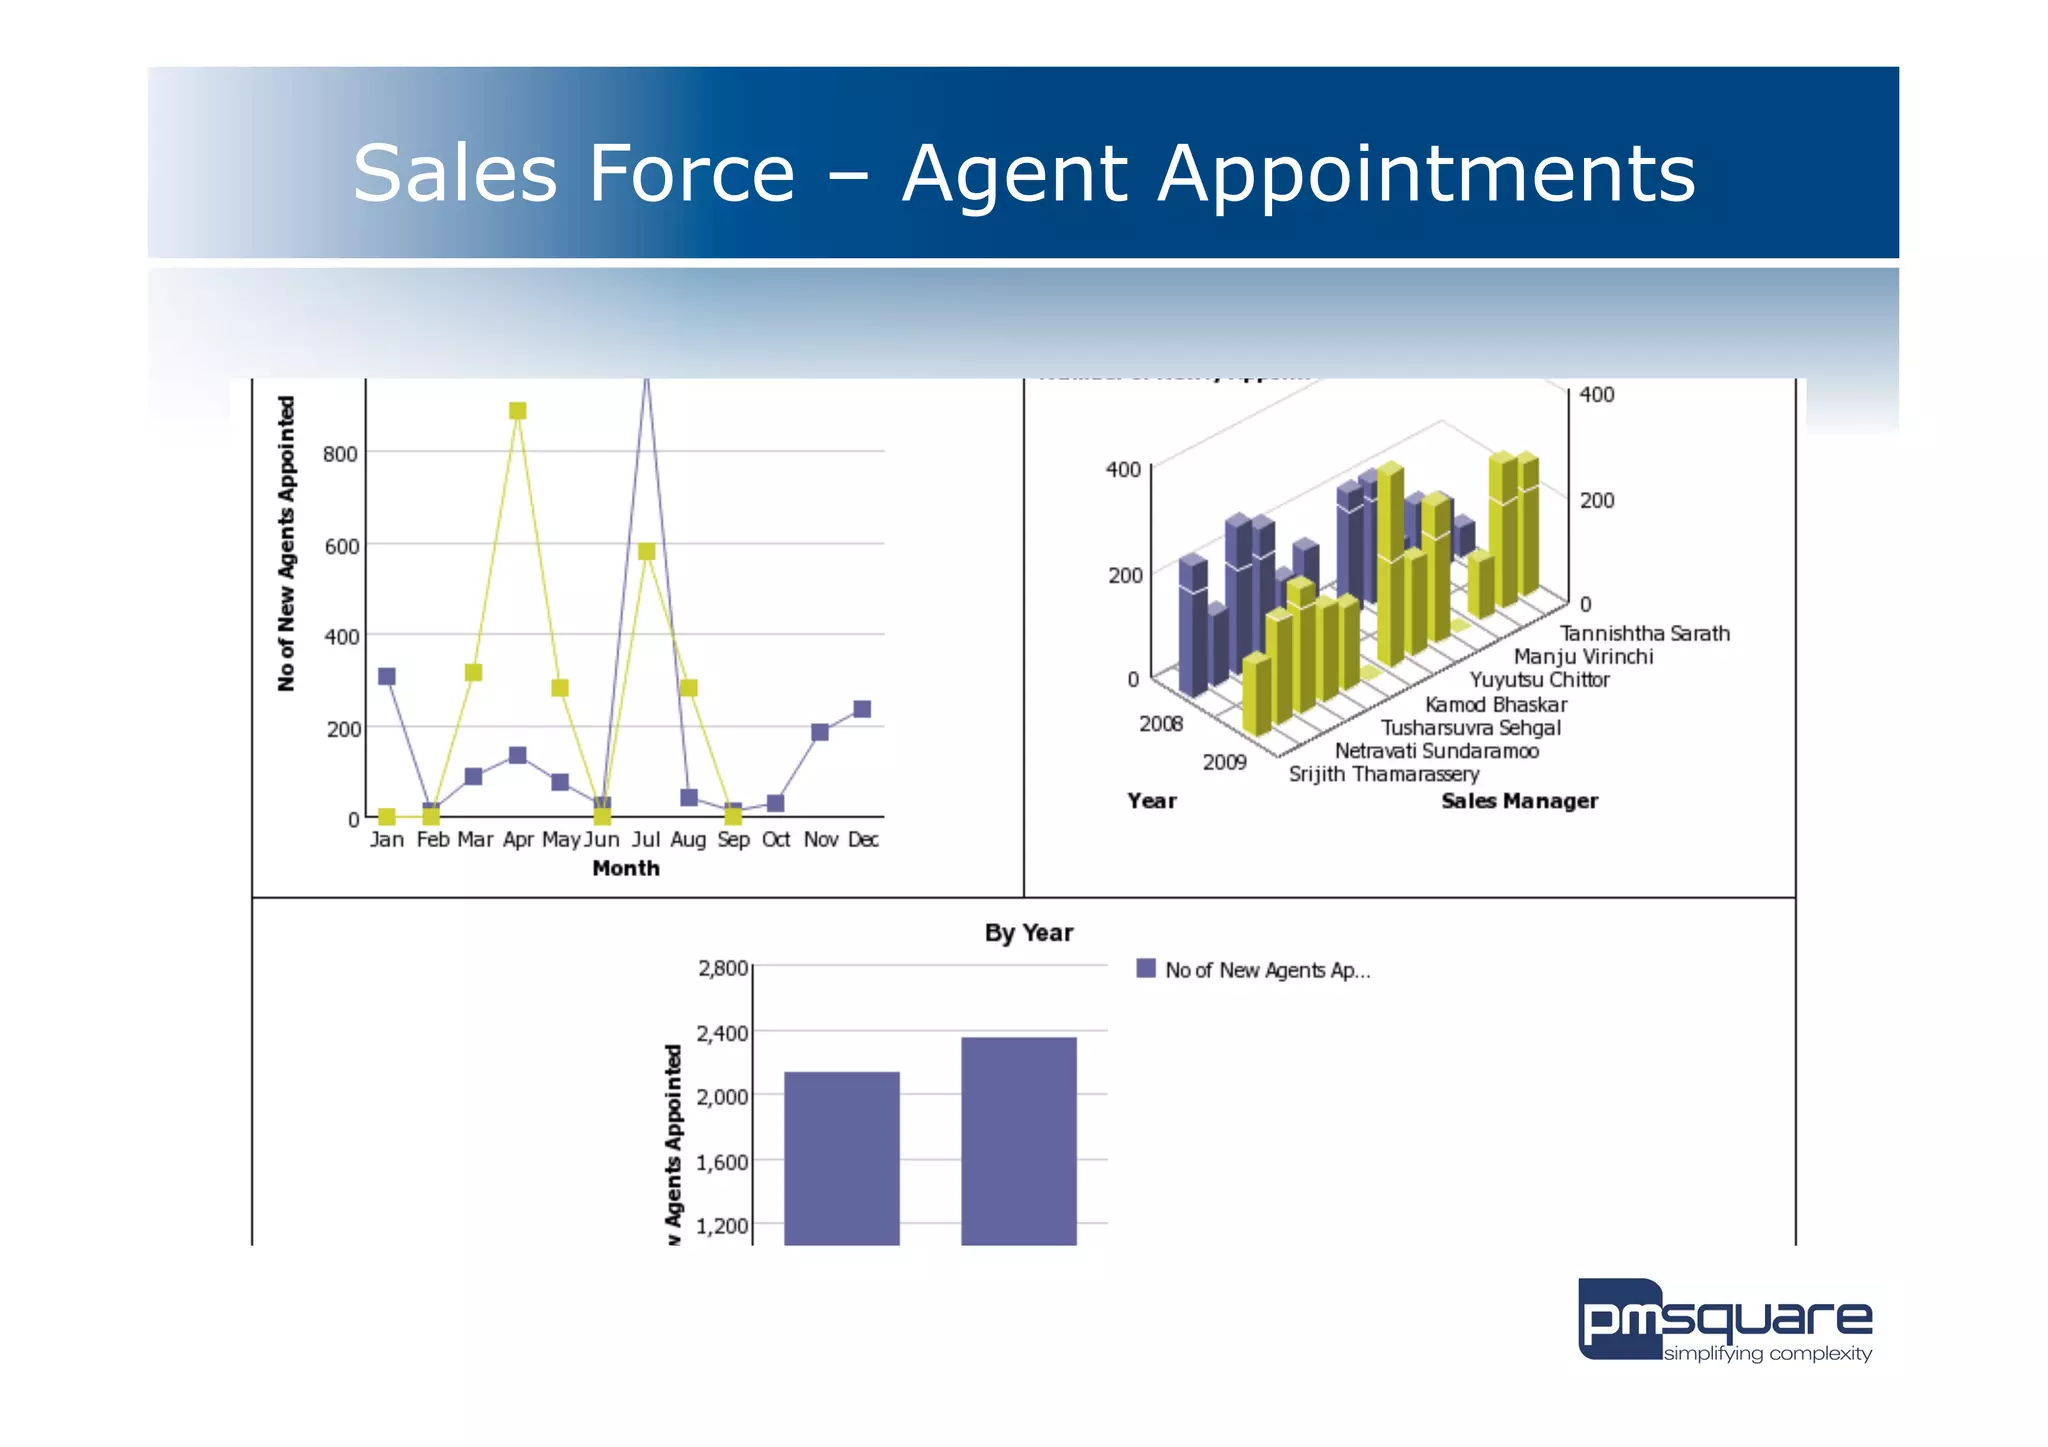
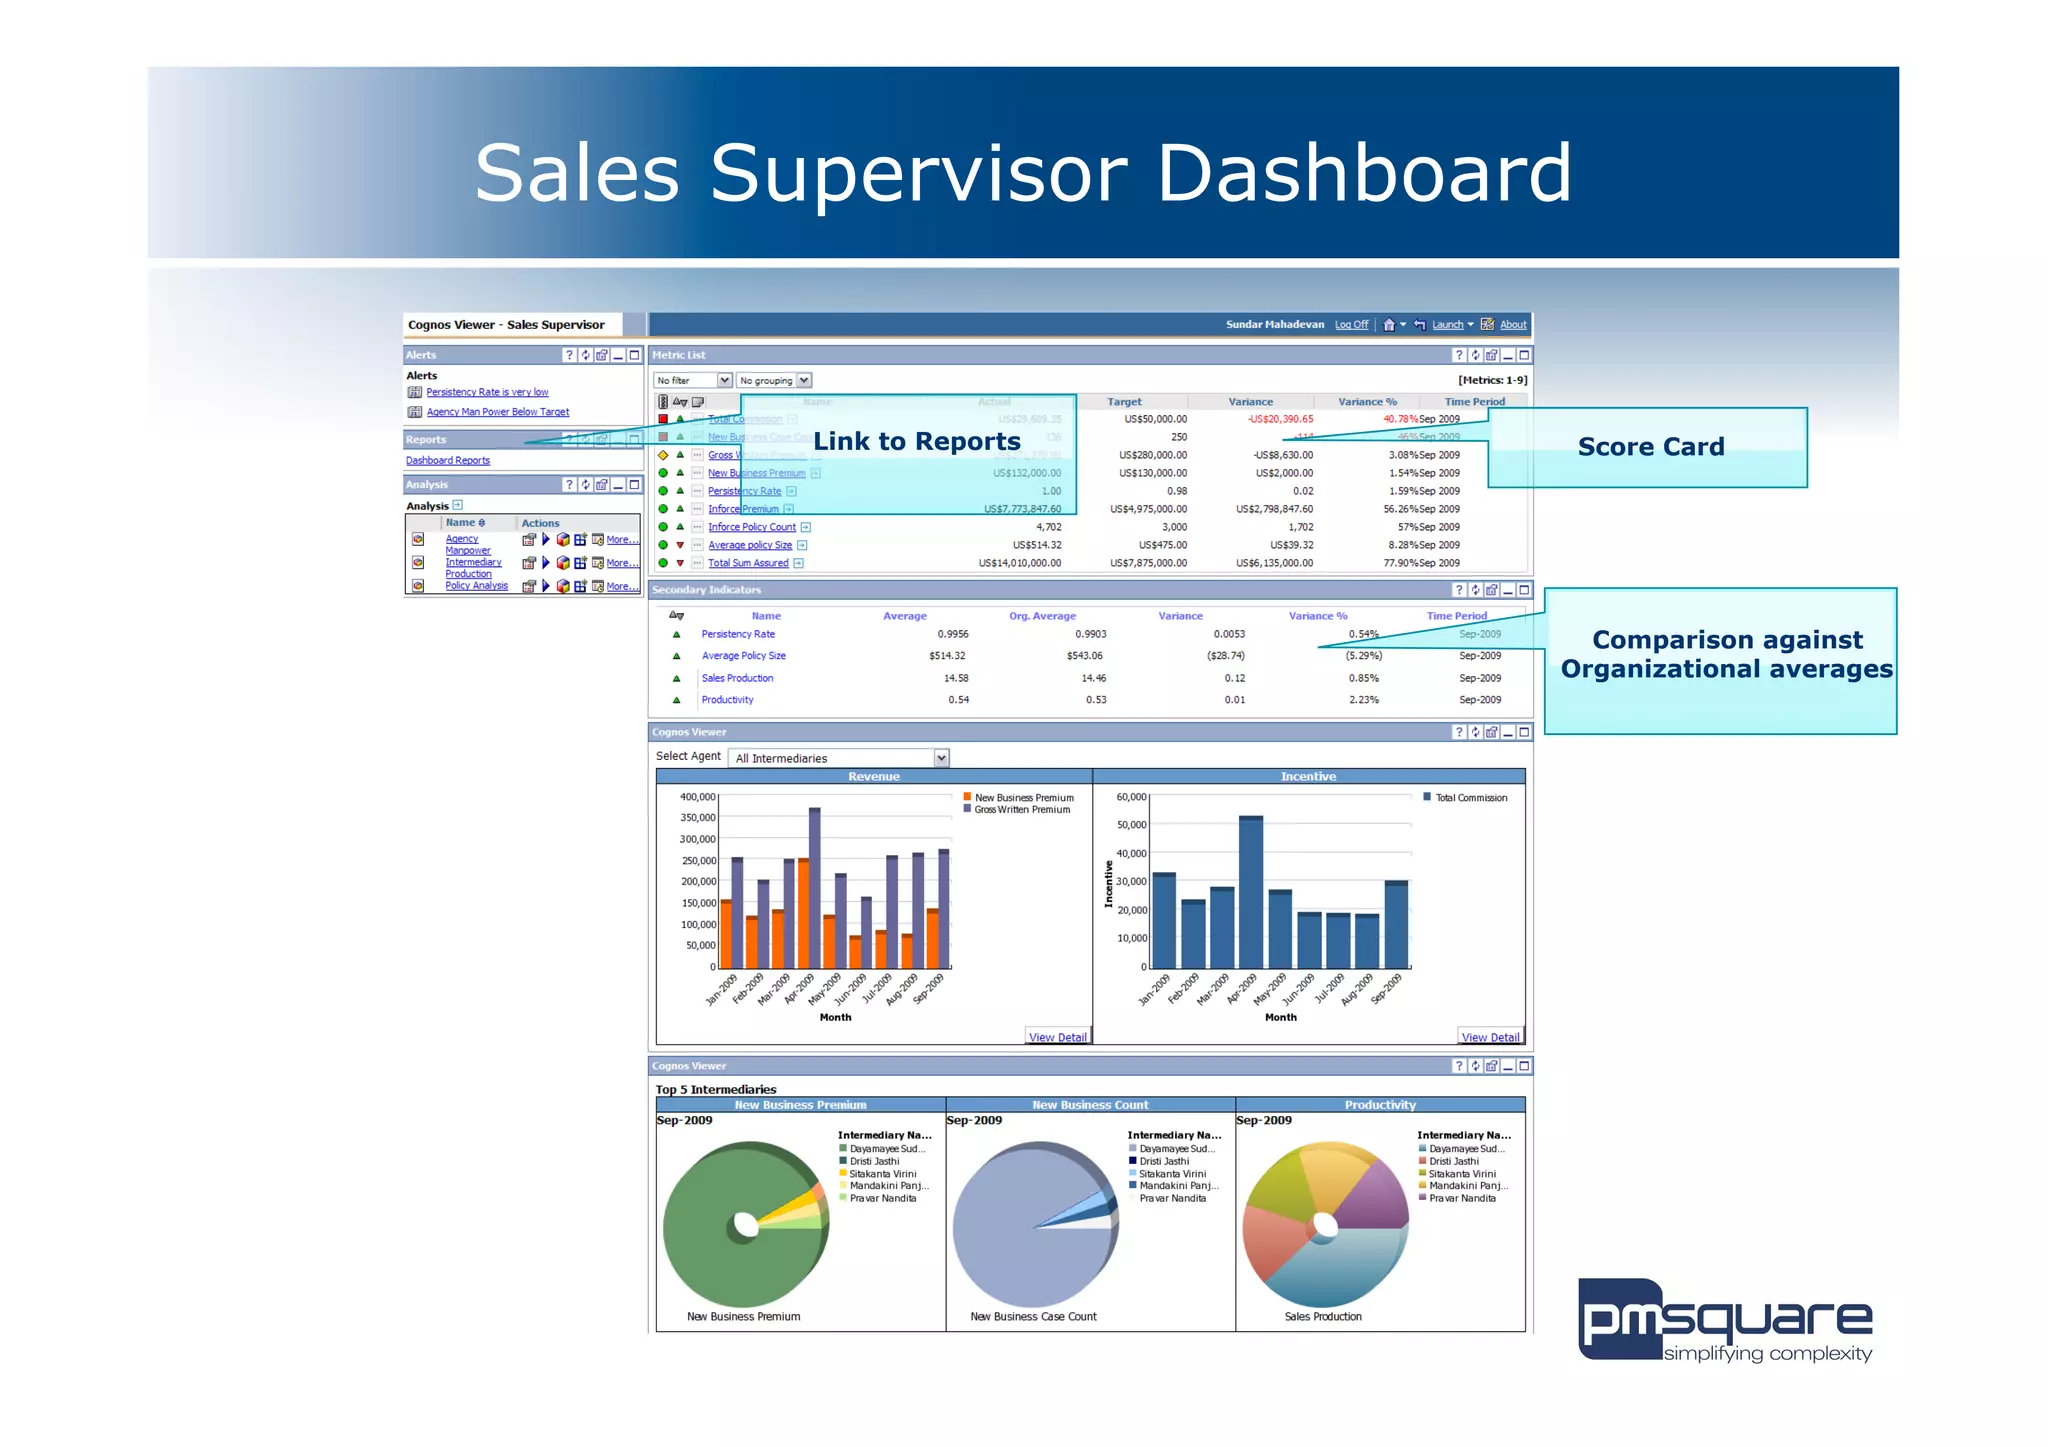
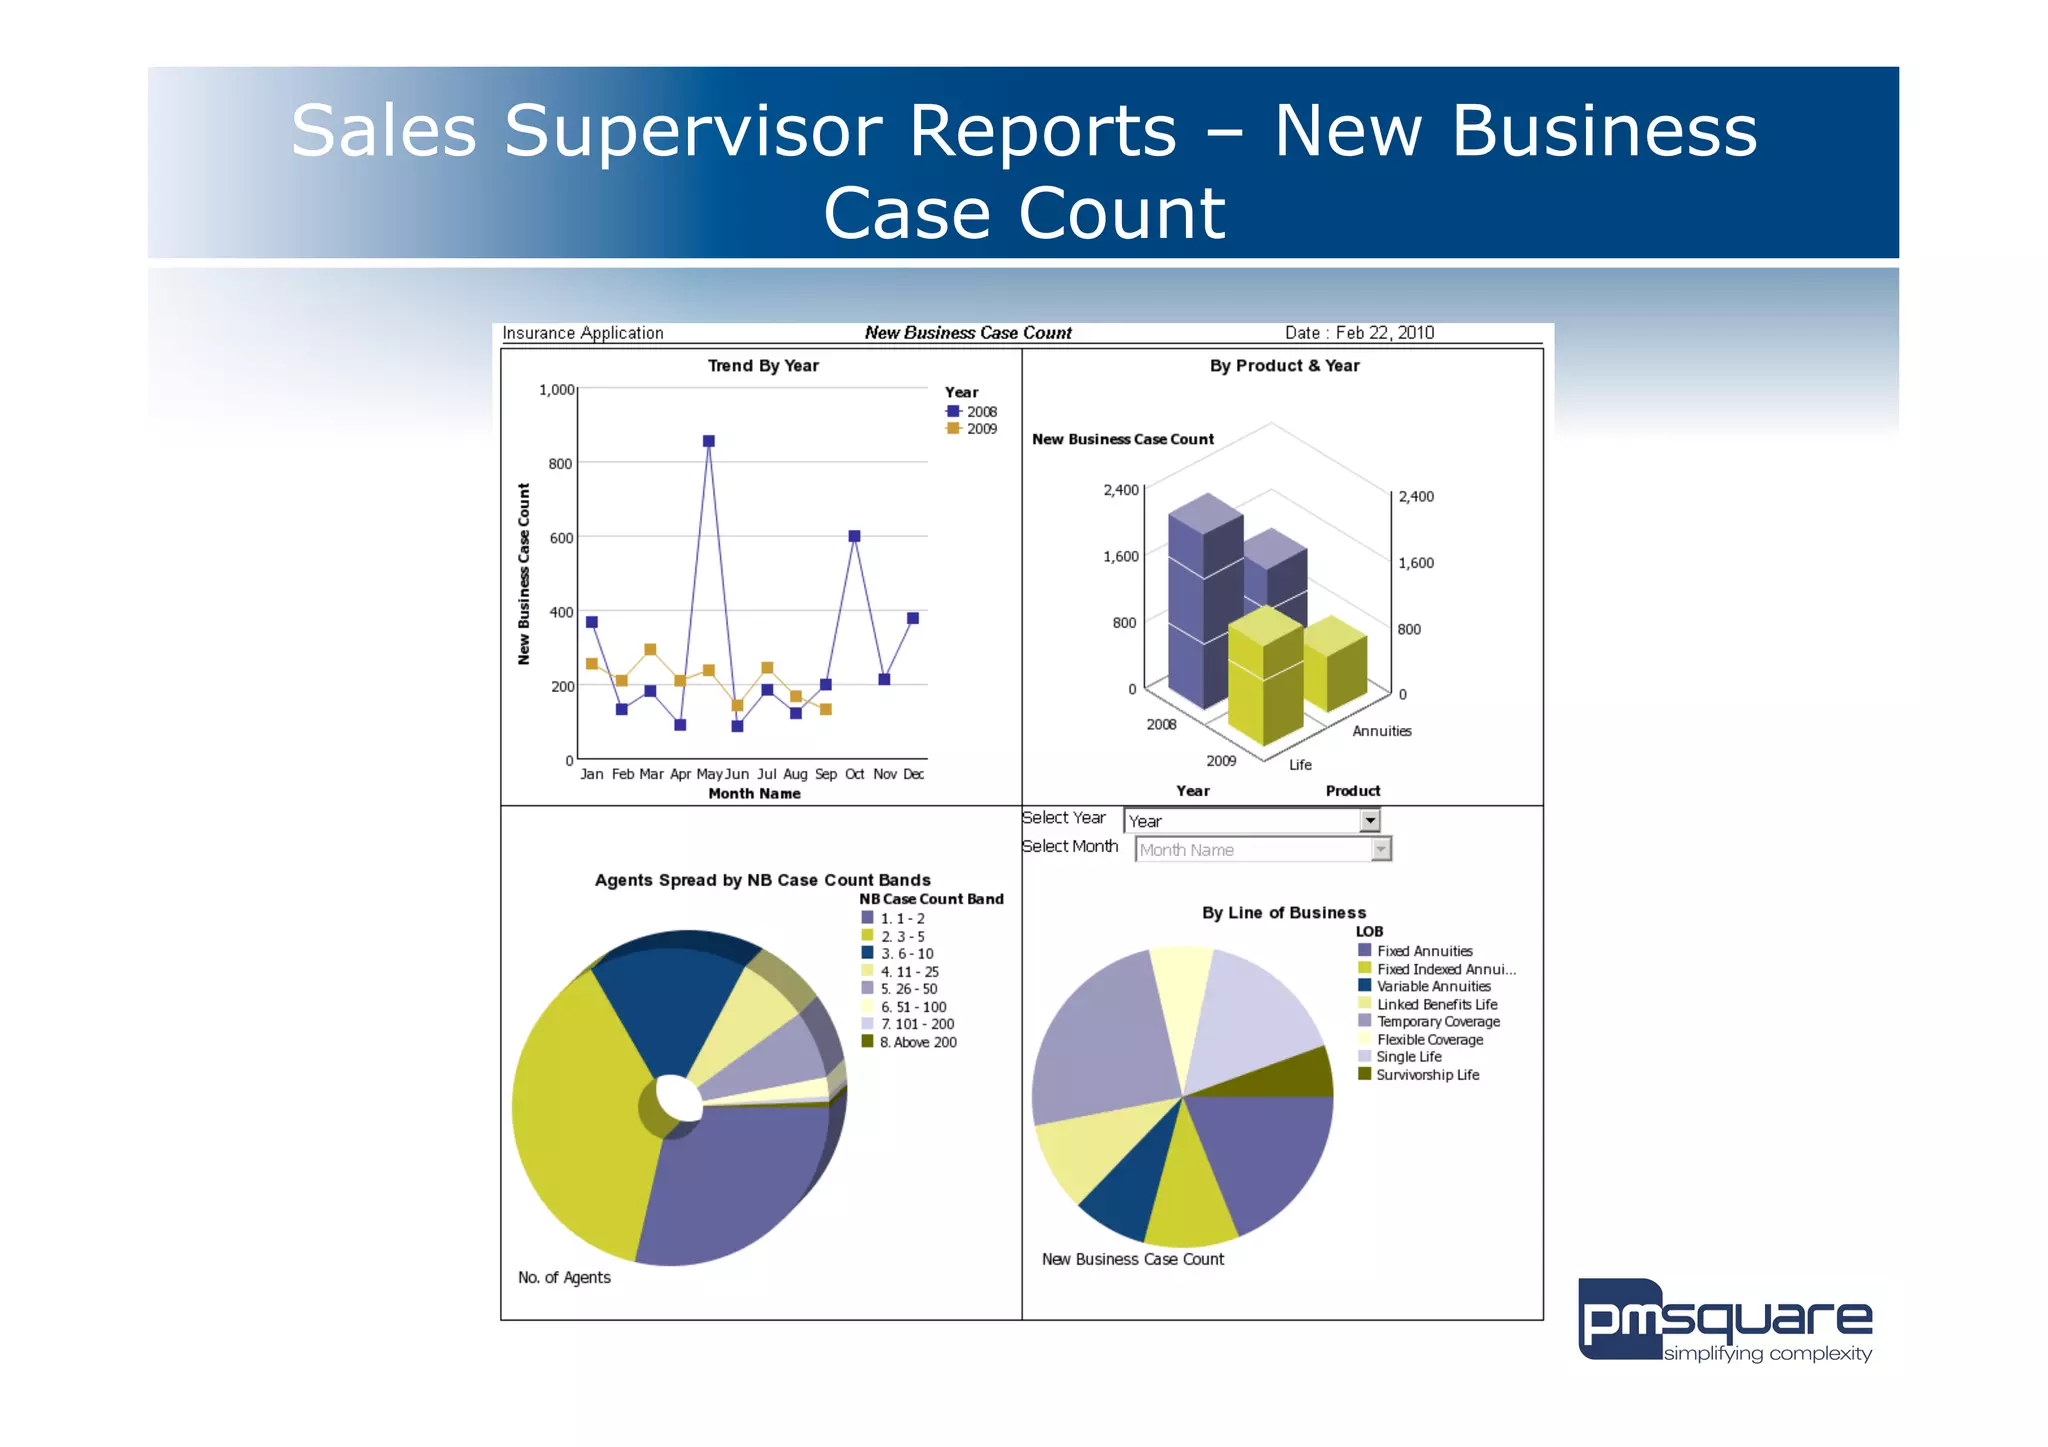
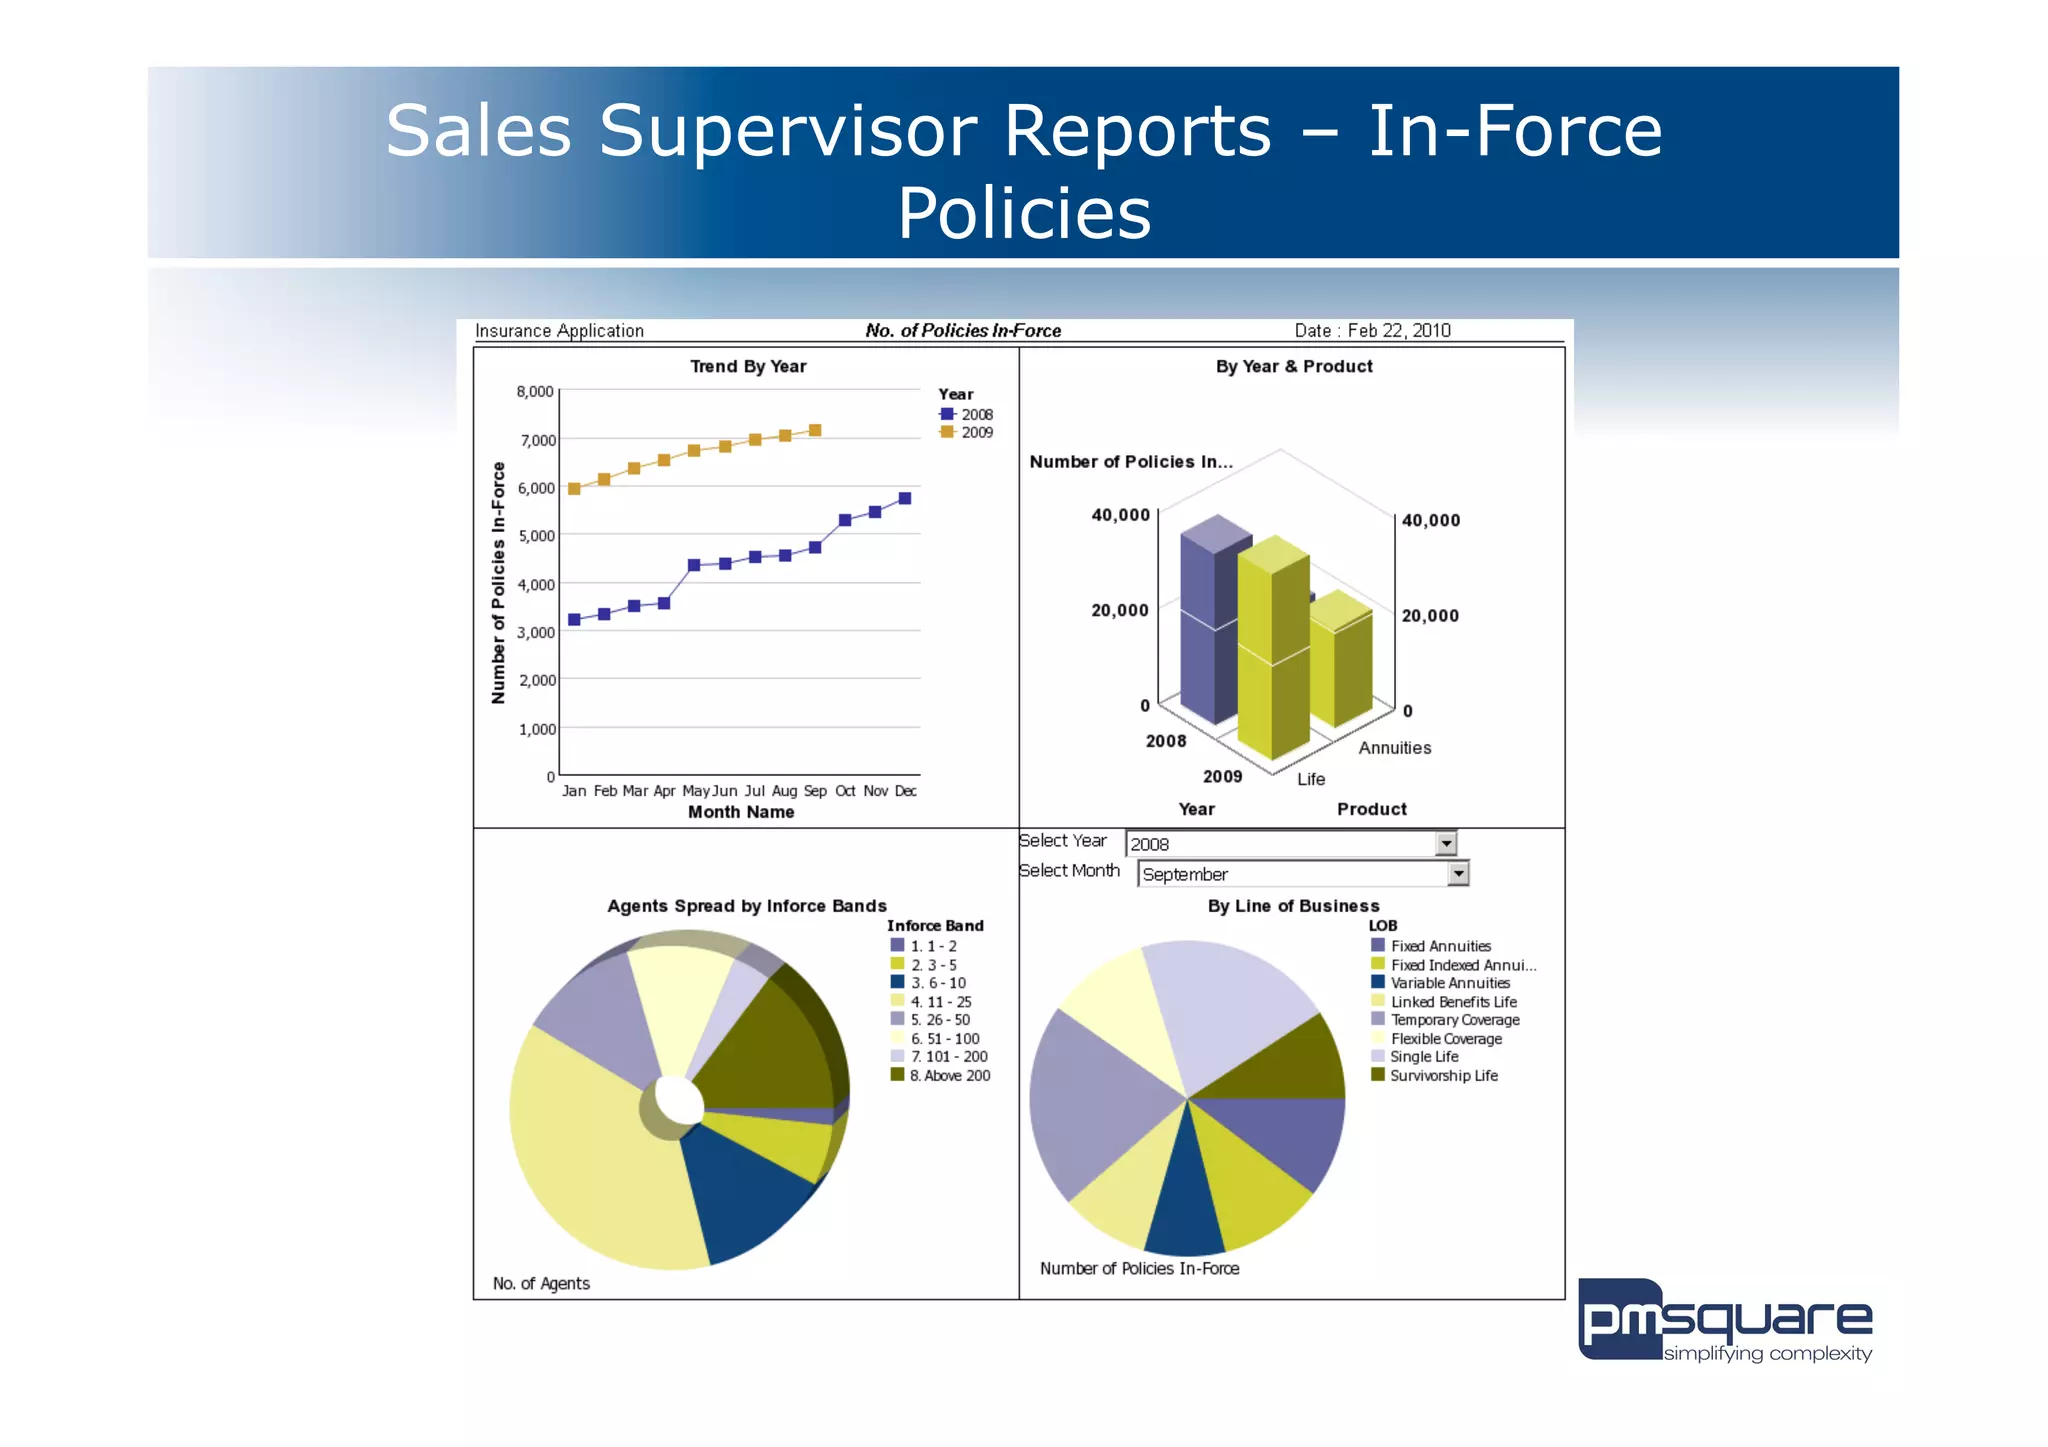
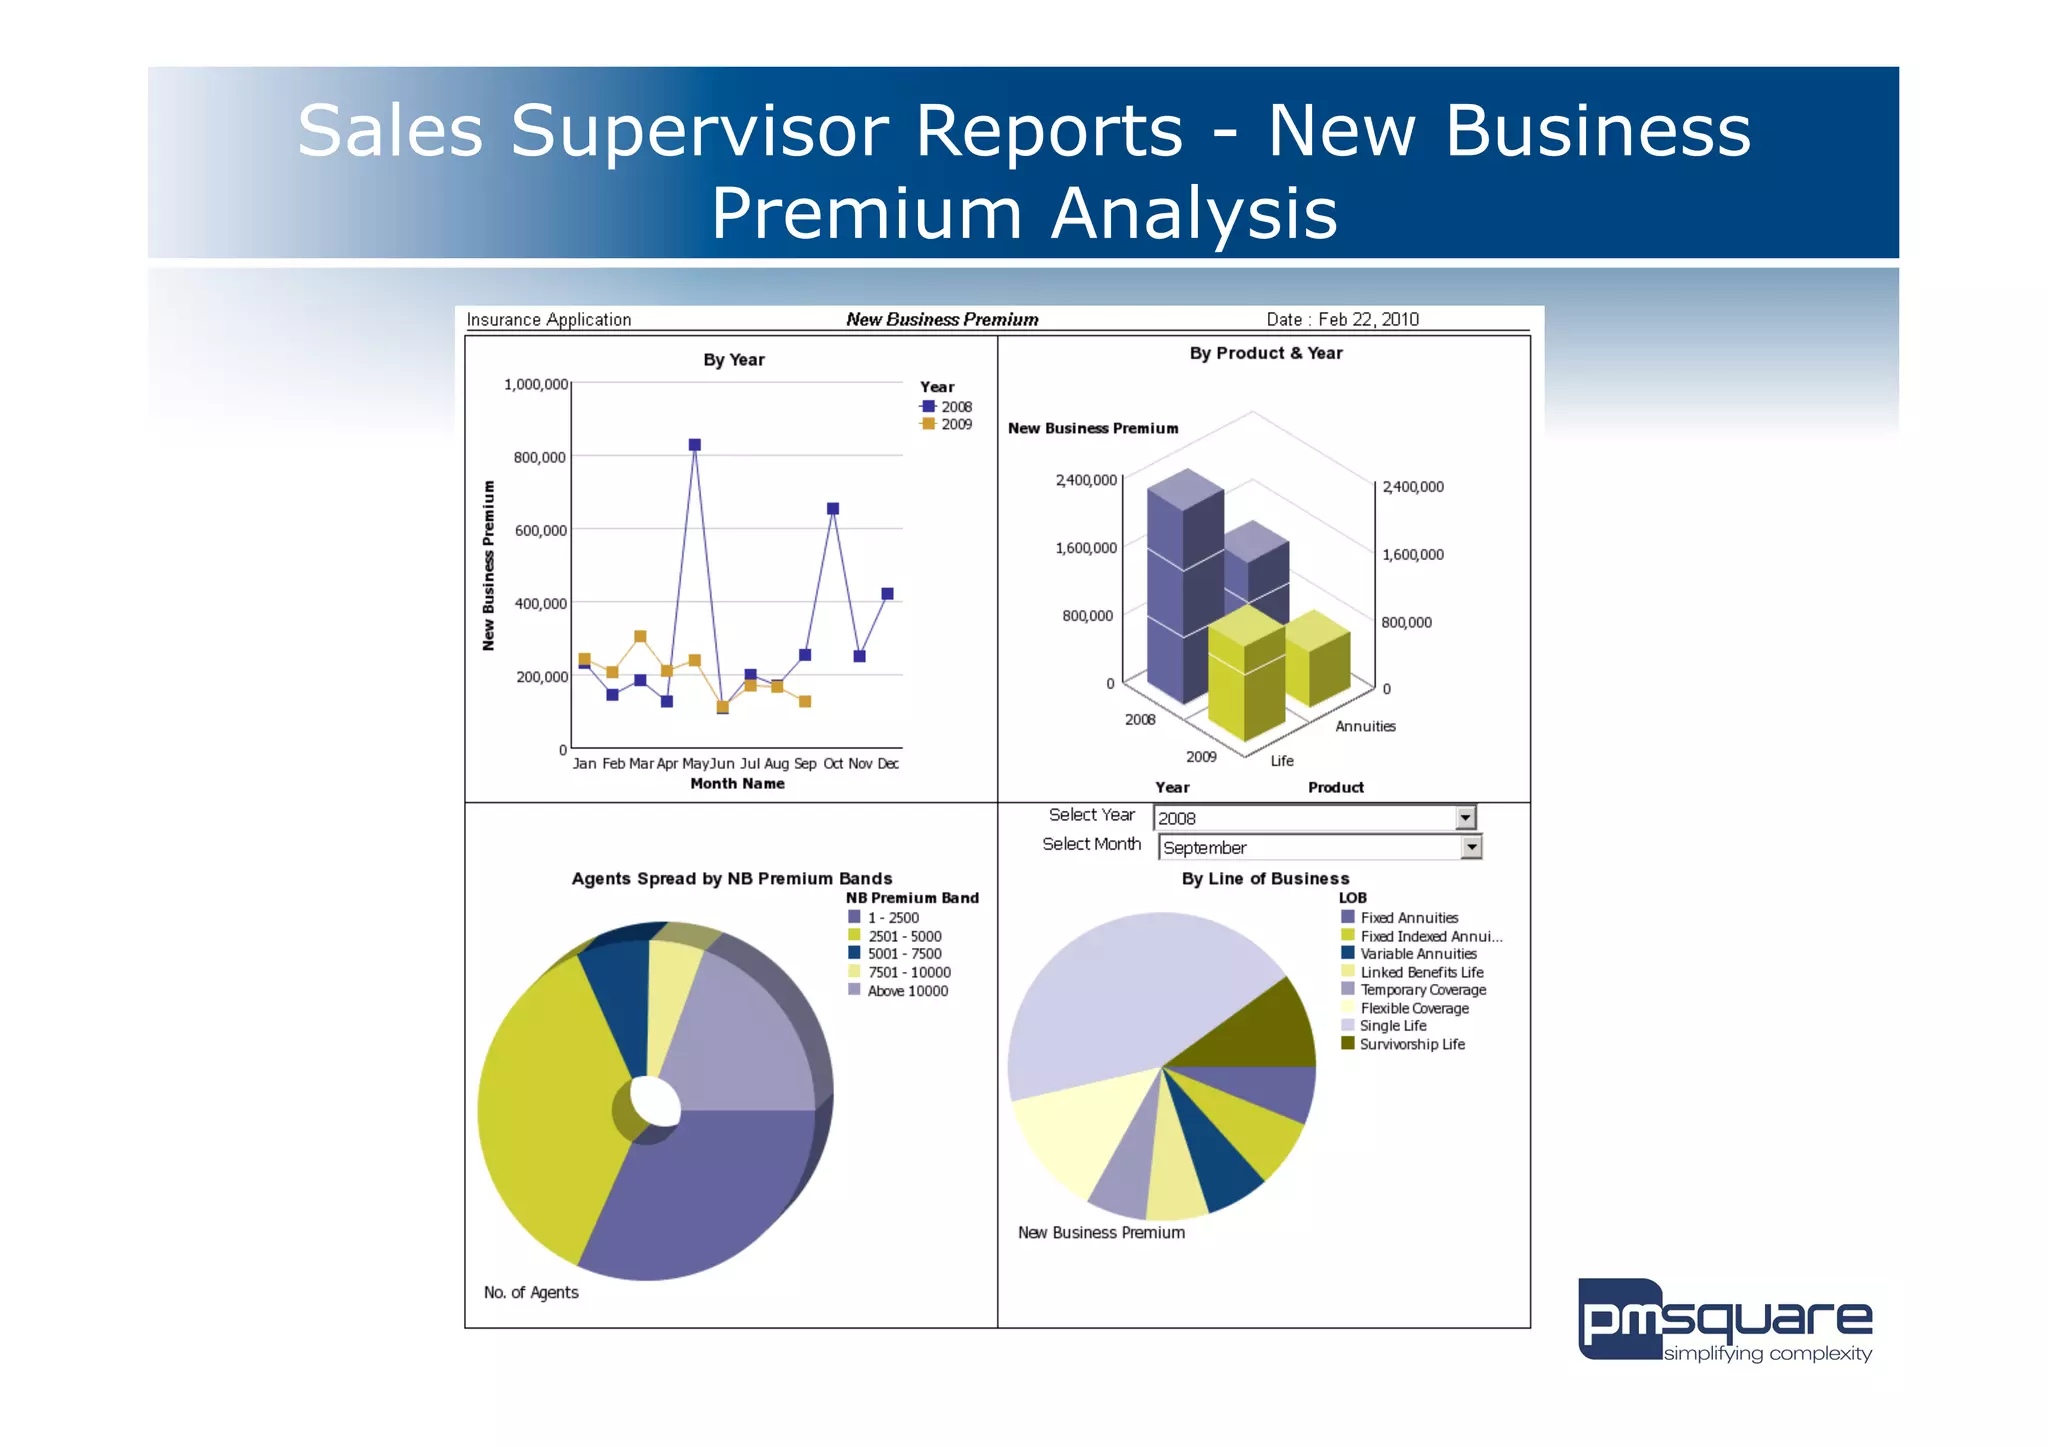
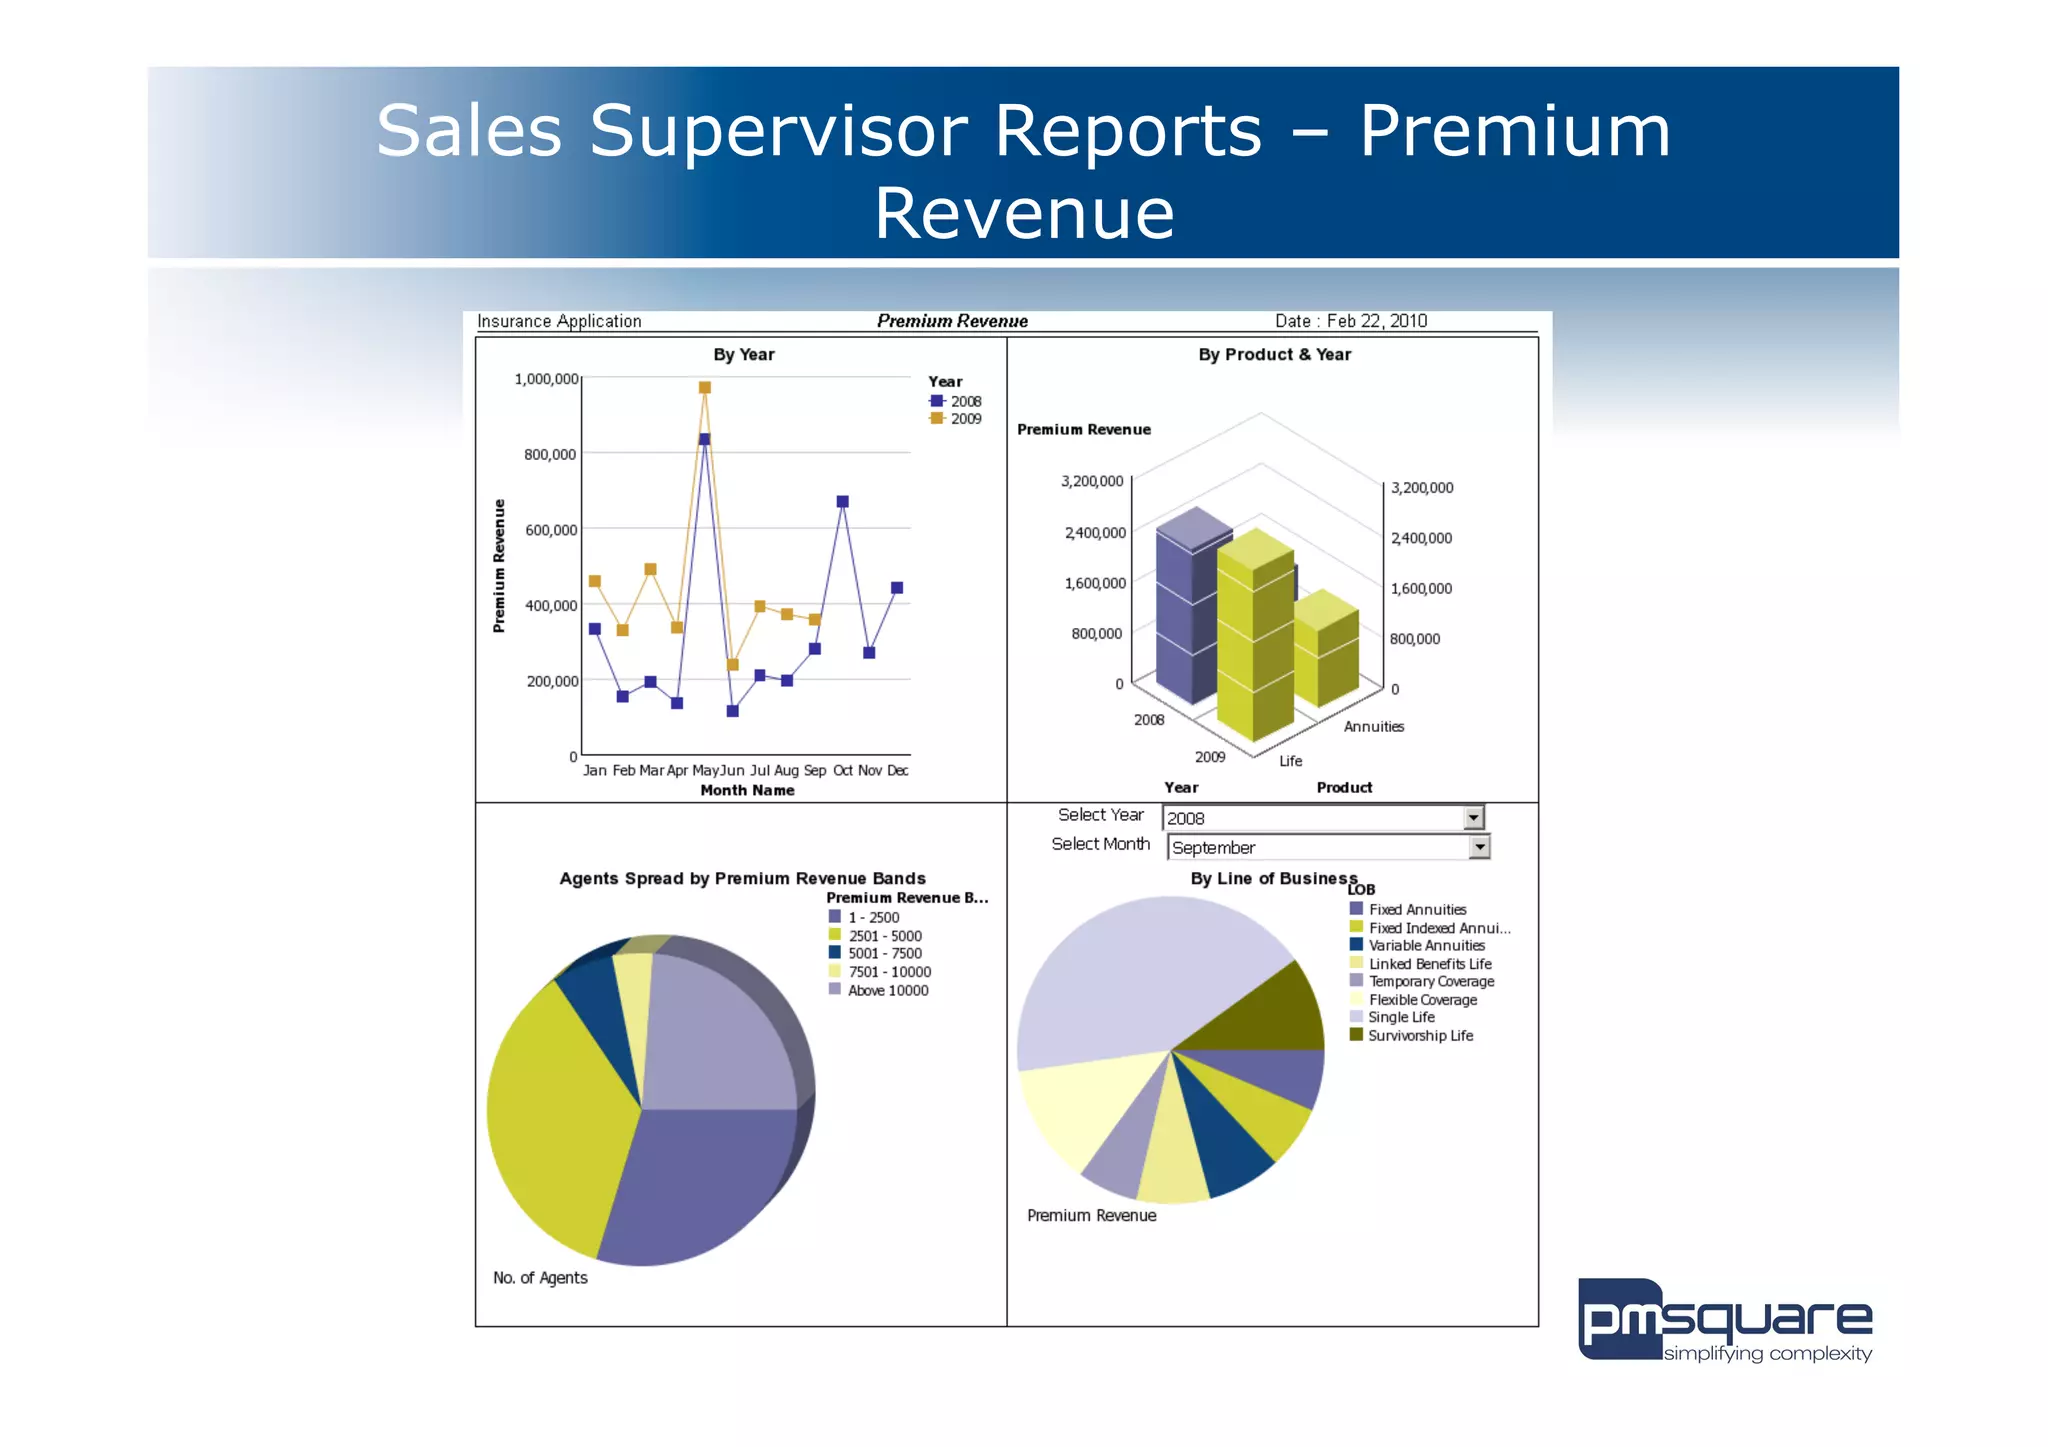
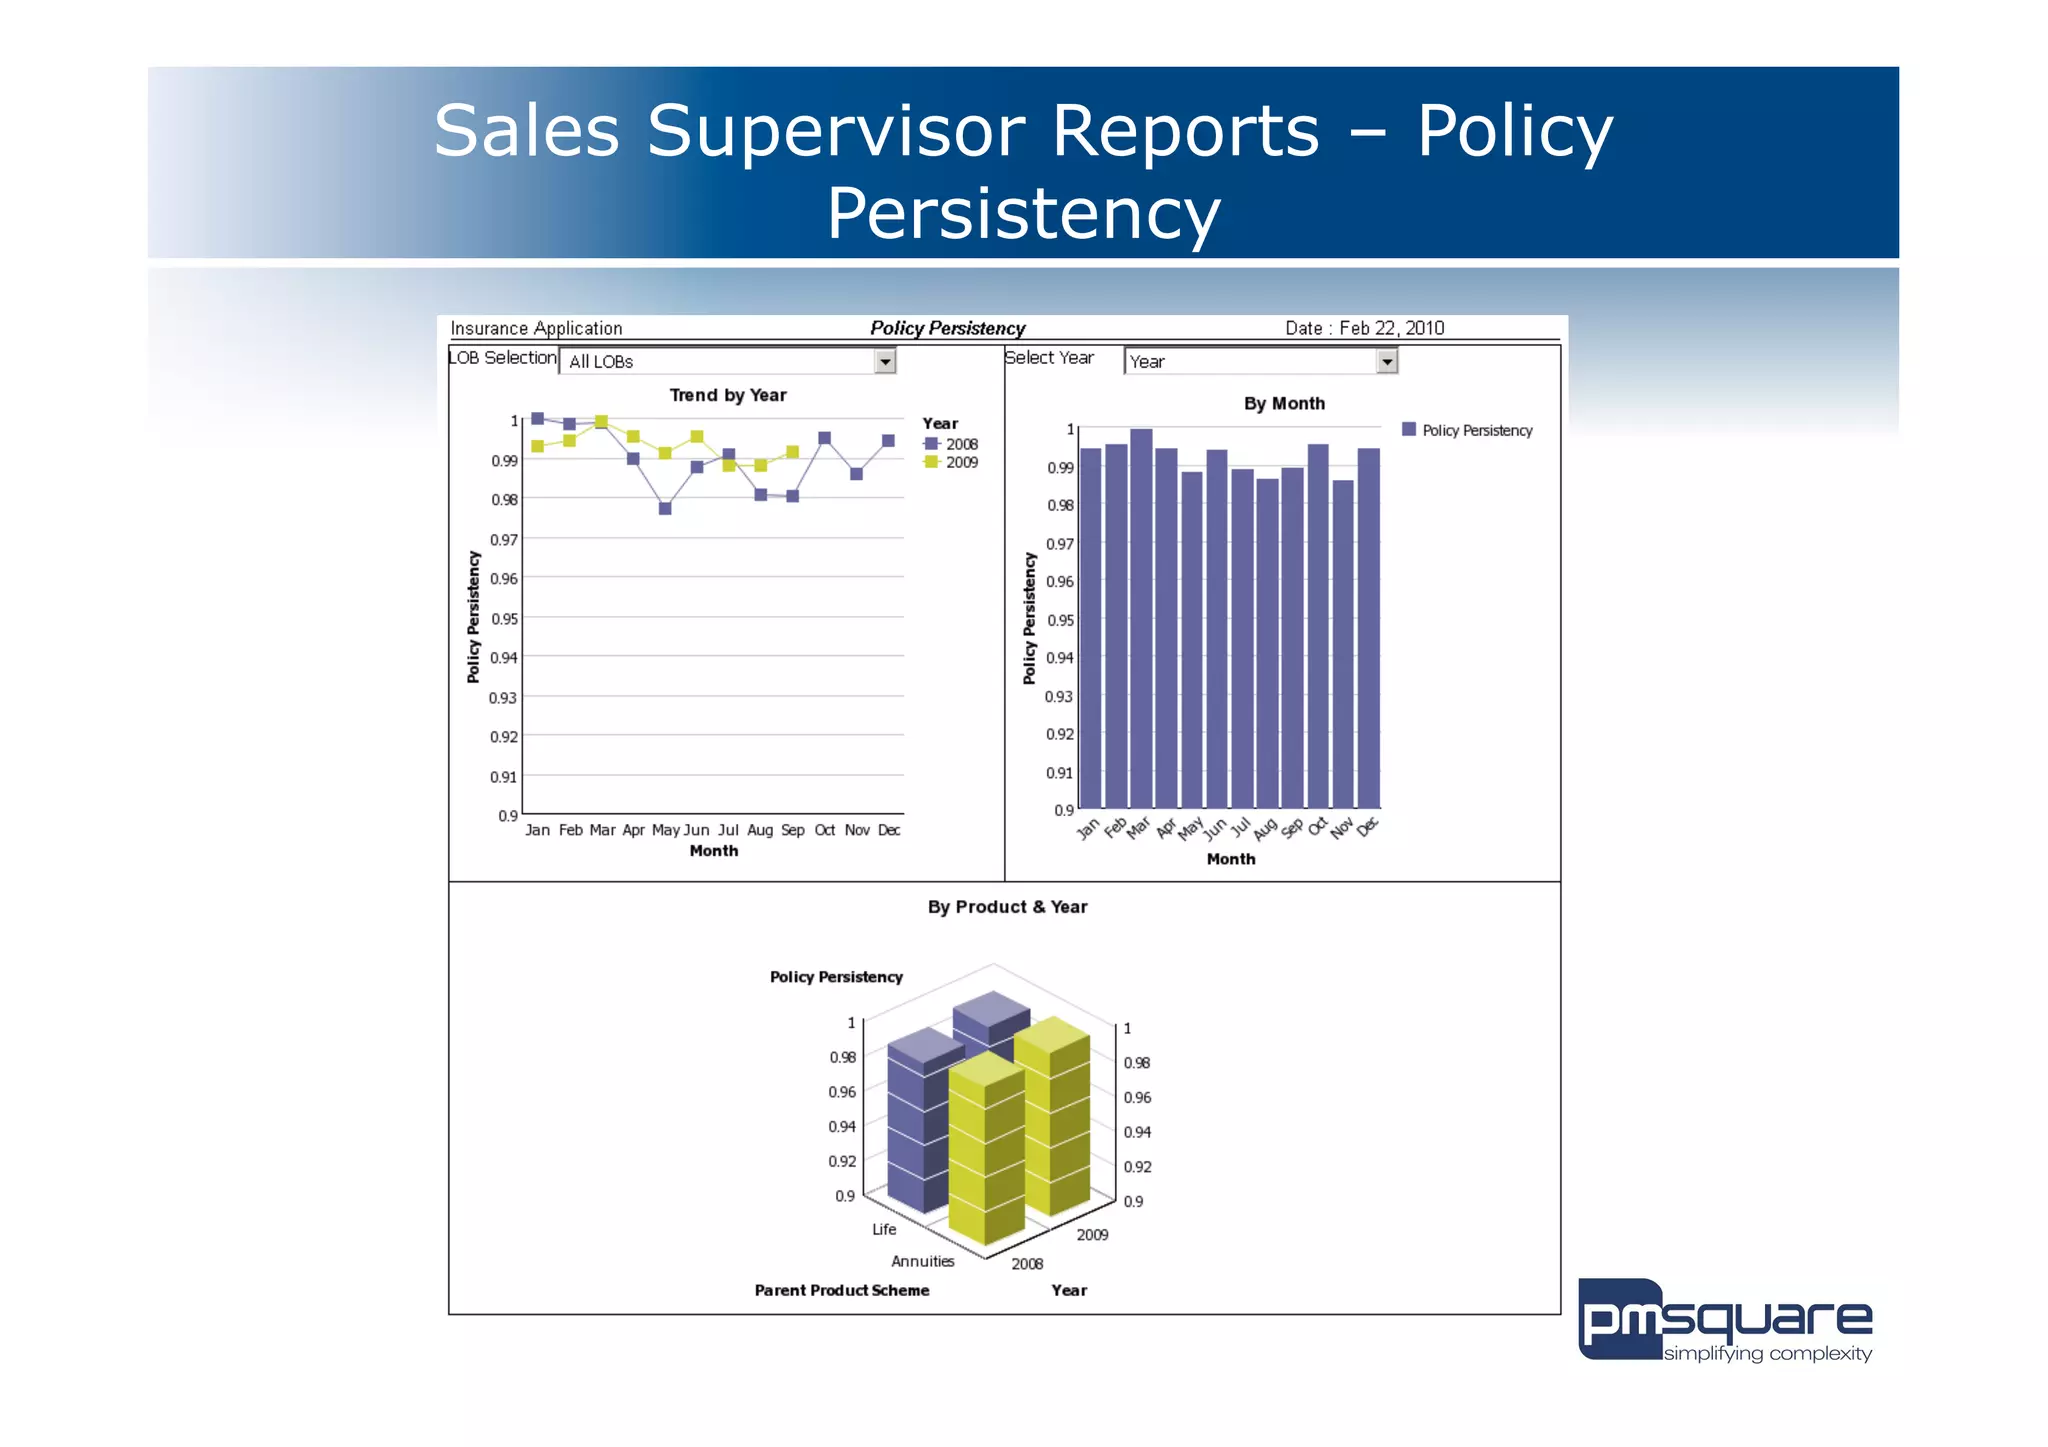
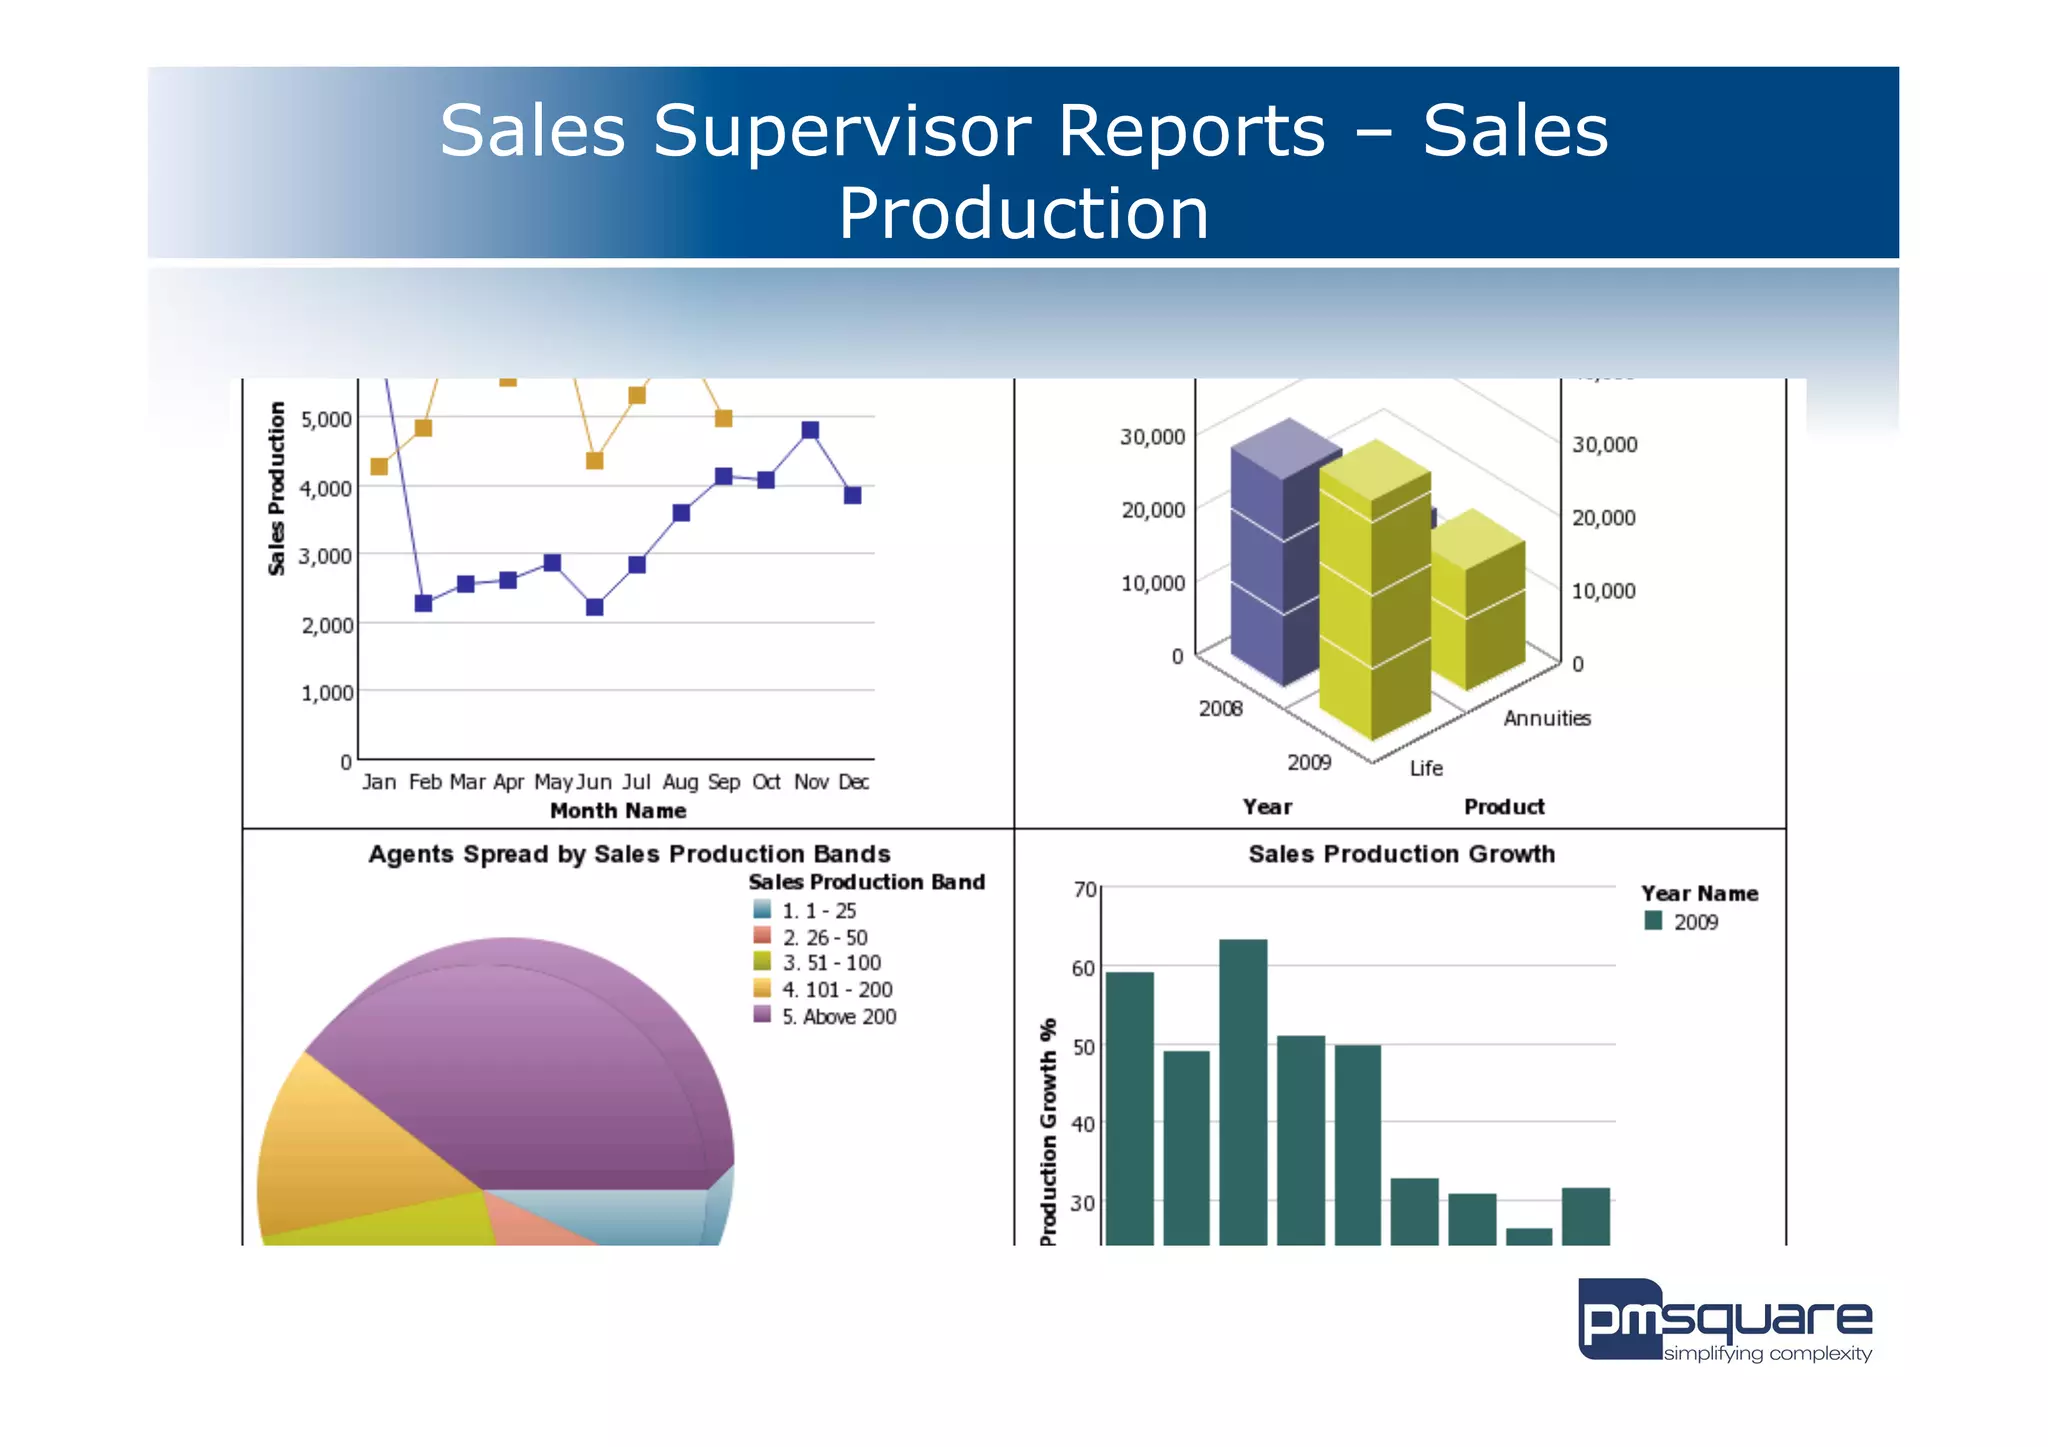
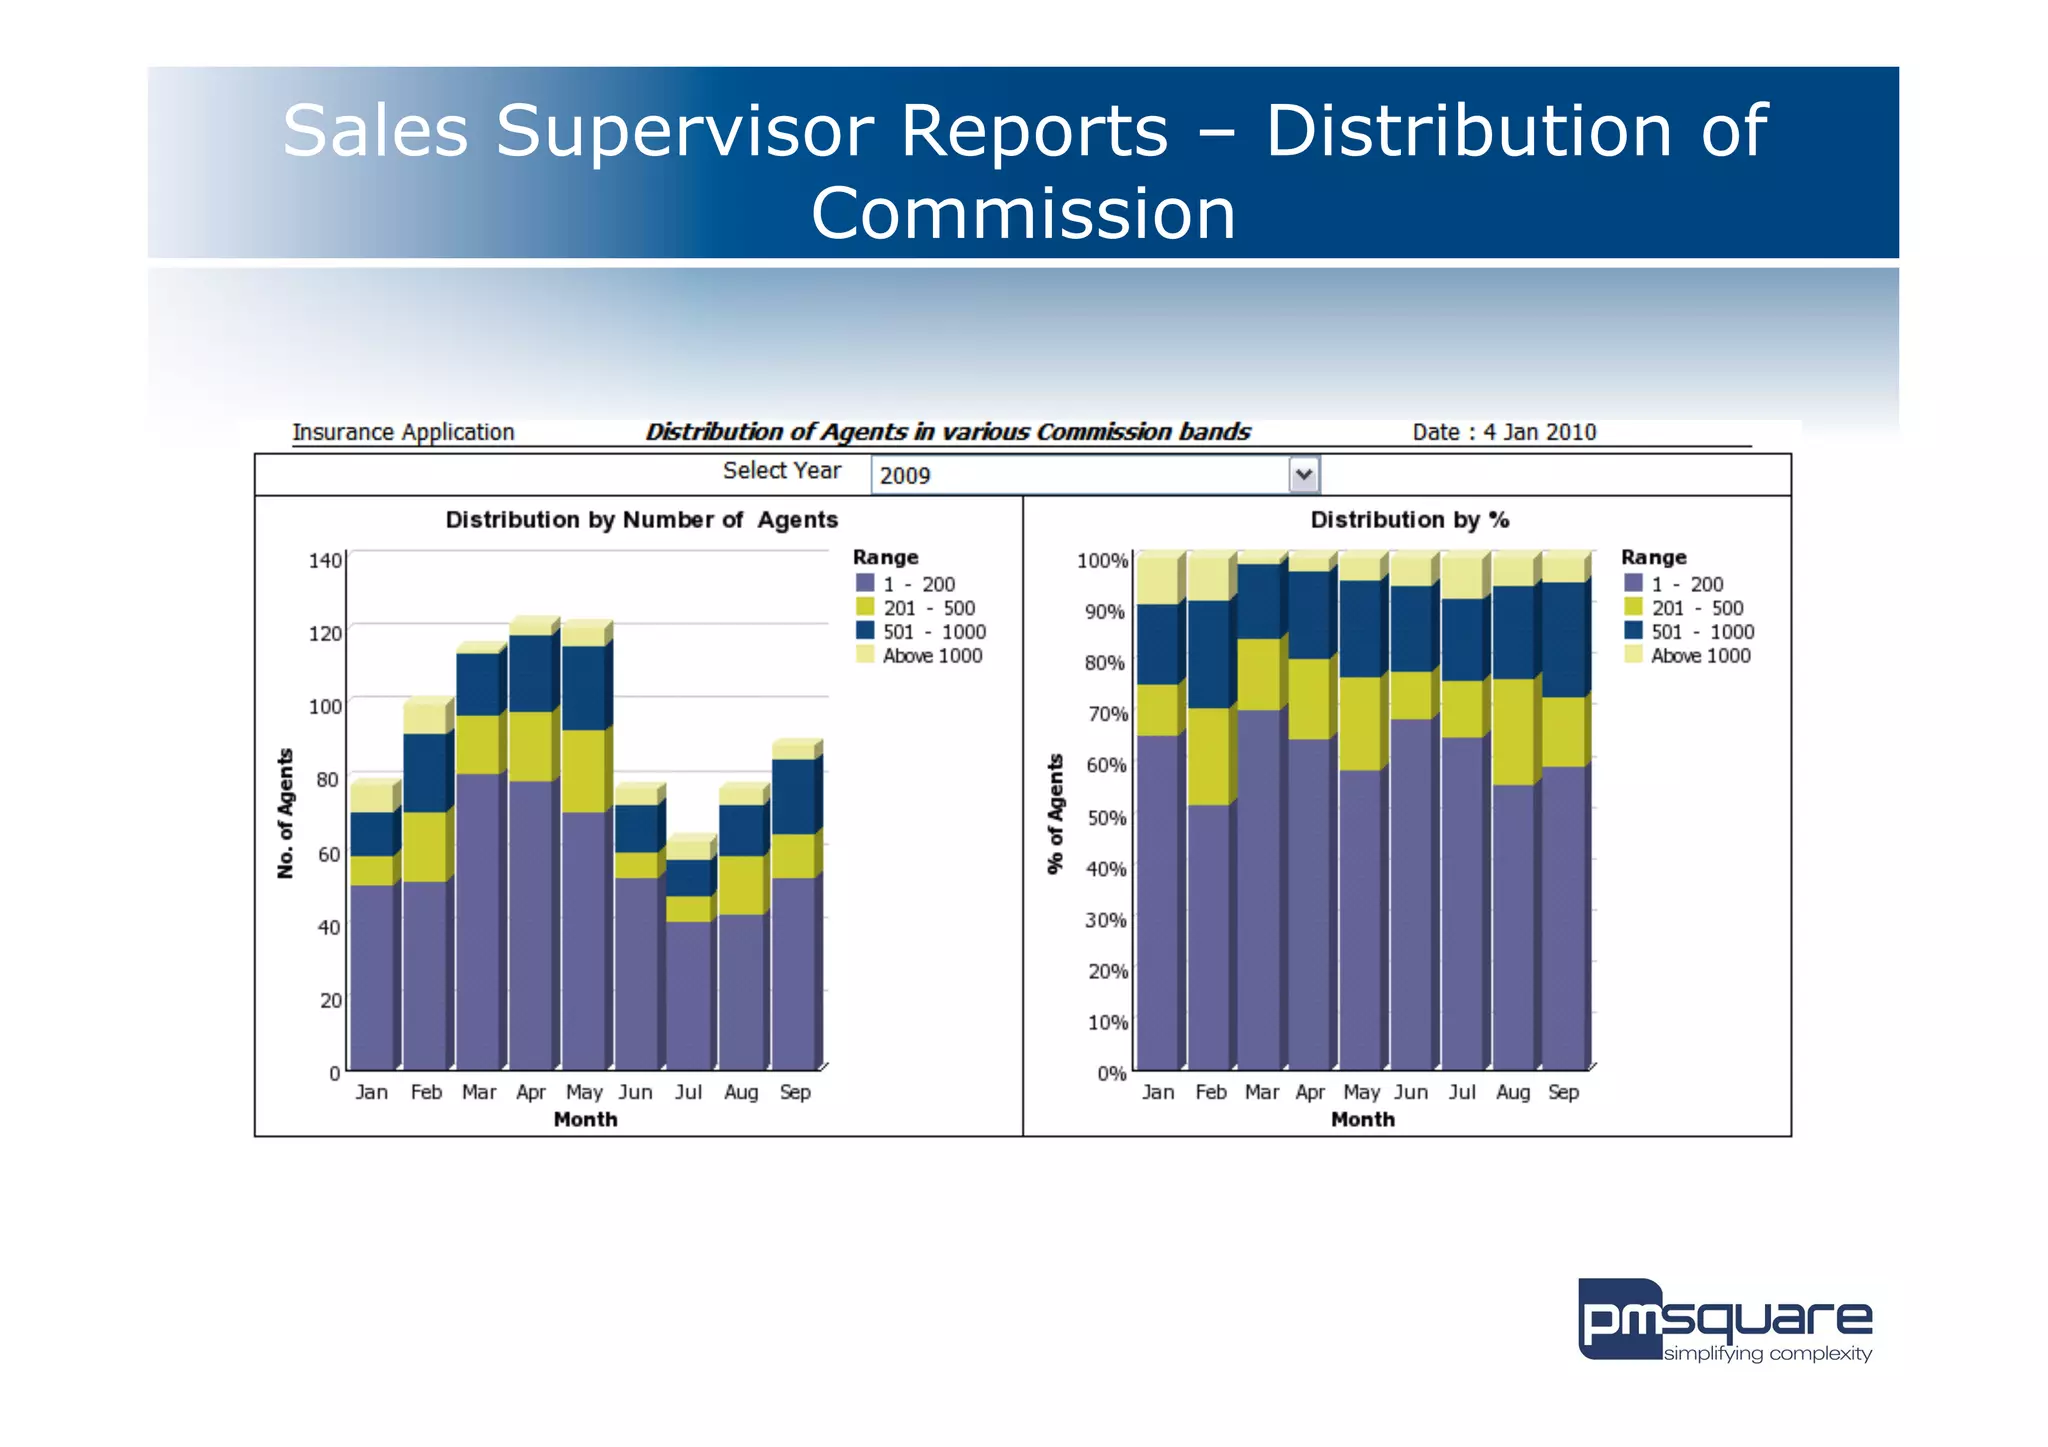

PMSquare offers consulting services focused on customer analytics, finance management, talent performance, and operational excellence to enhance business outcomes across various industries. Their solutions include pre-built frameworks like the IBM Insurance Sales Performance Dashboard, designed to present key performance indicators visually for senior executives, allowing them to track sales and productivity. The dashboard enables informed decision-making through robust analytical tools, customizable reports, and role-based access to critical data.


