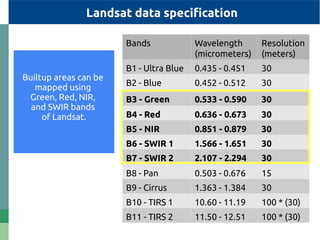
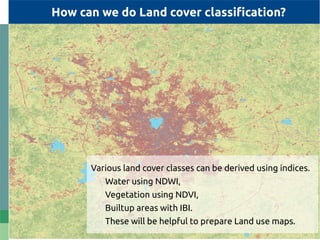
Built-Up Index for extraction of
building footprints -
from satellite data using - QGIS
Why should we extract building footprints?
●
To understand urban sprawl.
●
To model city growth .
●
To plan facilities like hospitals, schools based on city growth.
●
To monitor master plan execution.
●
To plan/replan transportation networks .
What data do we need?
To extract building footprint,
●
We need multispectral satellite data.
●
Landsat satellite data from NASA.
●
Sentinel 2 satellite data from ESA can also be used.
But using these datasets due to their resolutions we will only
be able to extract building footprint but not individual
buildings.
To extract individual buildings we need satellite datasets of
higher resolutions.
Bands Wavelength
(micrometers)
Resolution
(meters)
B1 - Ultra Blue 0.435 - 0.451 30
B2 - Blue 0.452 - 0.512 30
B3 - Green 0.533 - 0.590 30
B4 - Red 0.636 - 0.673 30
B5 - NIR 0.851 - 0.879 30
B6 - SWIR 1 1.566 - 1.651 30
B7 - SWIR 2 2.107 - 2.294 30
B8 - Pan 0.503 - 0.676 15
B9 - Cirrus 1.363 - 1.384 30
B10 - TIRS 1 10.60 - 11.19 100 * (30)
B11 - TIRS 2 11.50 - 12.51 100 * (30)
Landsat data specification
Builtup areas can be
mapped using
Green, Red, NIR,
and SWIR bands
of Landsat.
Bands useful to extract building footprint
Green
Red Short wave infra red (SWIR)
Near infra red (NIR)
INFRARED SPECTRUMVISIBLE SPECTRUM
This is how they look after color coding them
INFRARED SPECTRUMVISIBLE SPECTRUM
Near infra red (NIR)Green
Red Short wave infra red (SWIR)
Math behind Index based Builtup Index
IBI result
Green
Red
NIR
SWIR
2 x SWIR / ( SWIR+NIR ) – [ NIR / (NIR+RED) + GREEN / (GREEN+RED) ]
2 x SWIR / ( SWIR+NIR ) + [ NIR / (NIR+RED) + GREEN / (GREEN+RED) ]
IBI =
Why these bands are used?
●
Normalized difference building index(NDBI) is derived from
NIR and SWIR.
●
Minerals have peculiar signature in this spectrum when
compared to vegetation or water.
●
But sand and soil also have minerals in it. So NDBI sometimes
has similar signatures for buildings and sand/soil.
●
So to enhance building footprint IBI is derived as a
combination of
– NDBI,
– (SAVI or NDVI – depending on plant cover)
– NDWI
Computing IBI using QGIS
Load raster layers Green, Red and NIR, SWIR bands in QGIS
Computing IBI using QGIS
Go to main menu
>> Choose Raster
>> Raster Calculator
Output
Formula
Input
2 x SWIR / ( SWIR+NIR ) – [ NIR / (NIR+RED) + GREEN / (GREEN+RED) ]
2 x SWIR / ( SWIR+NIR ) + [ NIR / (NIR+RED) + GREEN / (GREEN+RED) ]
IBI =
Results
2 x SWIR / ( SWIR+NIR ) – [ NIR / (NIR+RED) + GREEN / (GREEN+RED) ]
2 x SWIR / ( SWIR+NIR ) + [ NIR / (NIR+RED) + GREEN / (GREEN+RED) ]
Ref: Raster styling in QGIS
IBI =
Range of IBI : -1 to +1
Higher value (towards 1) : - Density of builtup areas
Lower value (towards -1) : - Low or No builtup areas
(water, vegetation, etc.,)
We convert this to vector using Raster to Vector convertor
Extracted building footprint
How can we do Land cover classification?
Various land cover classes can be derived using indices.
Water using NDWI,
Vegetation using NDVI,
Builtup areas with IBI.
These will be helpful to prepare Land use maps.

Index based built up index using satellite data

  • 1.
    Built-Up Index forextraction of building footprints - from satellite data using - QGIS
  • 2.
    Why should weextract building footprints? ● To understand urban sprawl. ● To model city growth . ● To plan facilities like hospitals, schools based on city growth. ● To monitor master plan execution. ● To plan/replan transportation networks .
  • 3.
    What data dowe need? To extract building footprint, ● We need multispectral satellite data. ● Landsat satellite data from NASA. ● Sentinel 2 satellite data from ESA can also be used. But using these datasets due to their resolutions we will only be able to extract building footprint but not individual buildings. To extract individual buildings we need satellite datasets of higher resolutions.
  • 4.
    Bands Wavelength (micrometers) Resolution (meters) B1 -Ultra Blue 0.435 - 0.451 30 B2 - Blue 0.452 - 0.512 30 B3 - Green 0.533 - 0.590 30 B4 - Red 0.636 - 0.673 30 B5 - NIR 0.851 - 0.879 30 B6 - SWIR 1 1.566 - 1.651 30 B7 - SWIR 2 2.107 - 2.294 30 B8 - Pan 0.503 - 0.676 15 B9 - Cirrus 1.363 - 1.384 30 B10 - TIRS 1 10.60 - 11.19 100 * (30) B11 - TIRS 2 11.50 - 12.51 100 * (30) Landsat data specification Builtup areas can be mapped using Green, Red, NIR, and SWIR bands of Landsat.
  • 5.
    Bands useful toextract building footprint Green Red Short wave infra red (SWIR) Near infra red (NIR) INFRARED SPECTRUMVISIBLE SPECTRUM
  • 6.
    This is howthey look after color coding them INFRARED SPECTRUMVISIBLE SPECTRUM Near infra red (NIR)Green Red Short wave infra red (SWIR)
  • 7.
    Math behind Indexbased Builtup Index IBI result Green Red NIR SWIR 2 x SWIR / ( SWIR+NIR ) – [ NIR / (NIR+RED) + GREEN / (GREEN+RED) ] 2 x SWIR / ( SWIR+NIR ) + [ NIR / (NIR+RED) + GREEN / (GREEN+RED) ] IBI =
  • 8.
    Why these bandsare used? ● Normalized difference building index(NDBI) is derived from NIR and SWIR. ● Minerals have peculiar signature in this spectrum when compared to vegetation or water. ● But sand and soil also have minerals in it. So NDBI sometimes has similar signatures for buildings and sand/soil. ● So to enhance building footprint IBI is derived as a combination of – NDBI, – (SAVI or NDVI – depending on plant cover) – NDWI
  • 9.
    Computing IBI usingQGIS Load raster layers Green, Red and NIR, SWIR bands in QGIS
  • 10.
    Computing IBI usingQGIS Go to main menu >> Choose Raster >> Raster Calculator Output Formula Input 2 x SWIR / ( SWIR+NIR ) – [ NIR / (NIR+RED) + GREEN / (GREEN+RED) ] 2 x SWIR / ( SWIR+NIR ) + [ NIR / (NIR+RED) + GREEN / (GREEN+RED) ] IBI =
  • 11.
    Results 2 x SWIR/ ( SWIR+NIR ) – [ NIR / (NIR+RED) + GREEN / (GREEN+RED) ] 2 x SWIR / ( SWIR+NIR ) + [ NIR / (NIR+RED) + GREEN / (GREEN+RED) ] Ref: Raster styling in QGIS IBI = Range of IBI : -1 to +1 Higher value (towards 1) : - Density of builtup areas Lower value (towards -1) : - Low or No builtup areas (water, vegetation, etc.,)
  • 12.
    We convert thisto vector using Raster to Vector convertor Extracted building footprint
  • 13.
    How can wedo Land cover classification? Various land cover classes can be derived using indices. Water using NDWI, Vegetation using NDVI, Builtup areas with IBI. These will be helpful to prepare Land use maps.