Downloaded 587 times


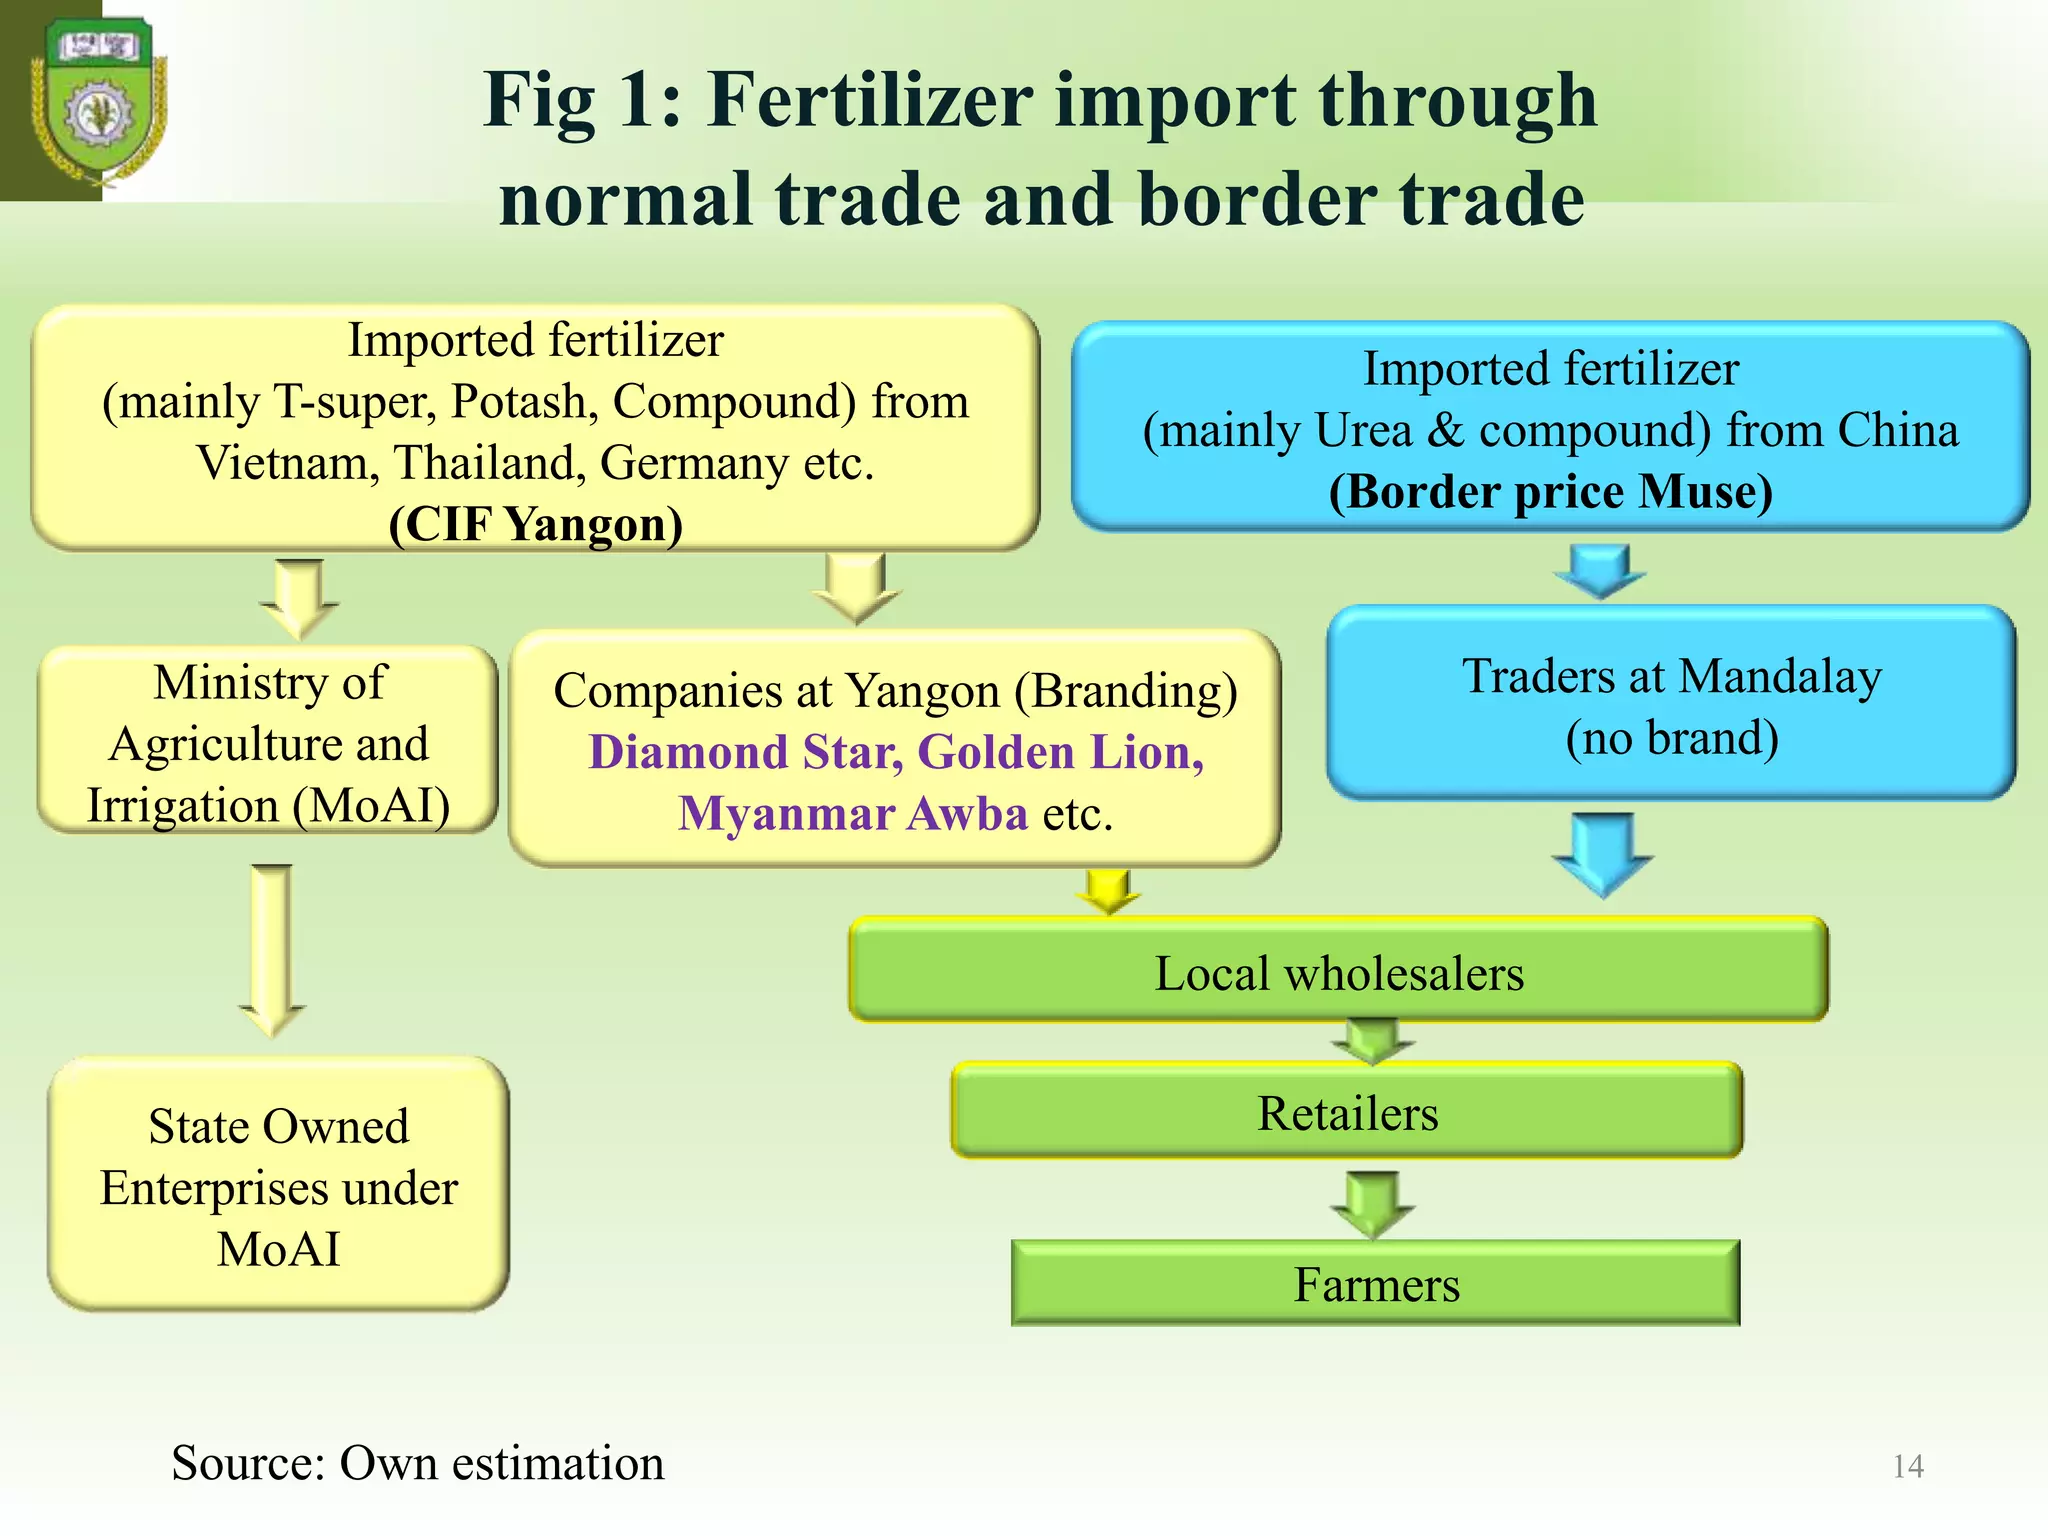


This document discusses fertilizer policy and the fertilizer market in Myanmar. It contains several tables and figures analyzing fertilizer use, consumption trends, prices, distribution, and quality over time. Some key points: - Fertilizer use increased crop yields and helped Myanmar achieve food self-sufficiency after 1978. However, the fertilizer market remains underdeveloped with issues around price, access, and quality. - Government subsidies kept fertilizer prices low until the 1990s but were withdrawn in the 2000s, raising prices. Private sector distribution has also increased while government distribution declined. - Total fertilizer consumption peaked in 2006-2007 at around 170,000 metric tons before declining. Consumption per hectare


![Certification of Organic Products [compatibility mode]](https://cdn.slidesharecdn.com/ss_thumbnails/certification-warangal1compatibilitymode-171207062321-thumbnail.jpg?width=640&height=640&fit=bounds)


