Downloaded 209 times

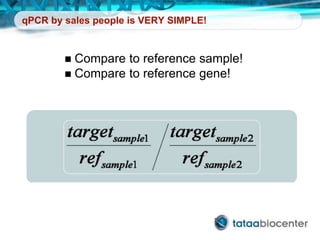
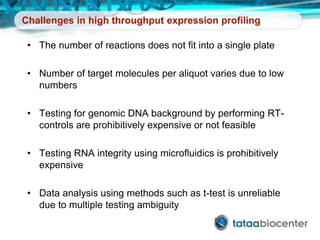
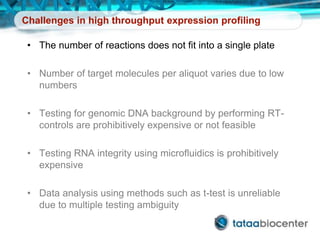
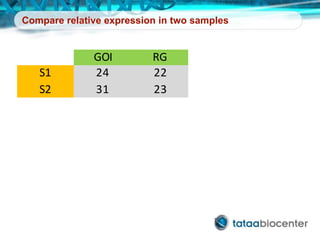
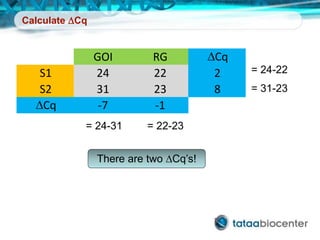
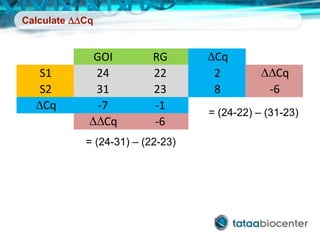
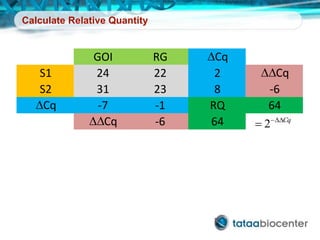
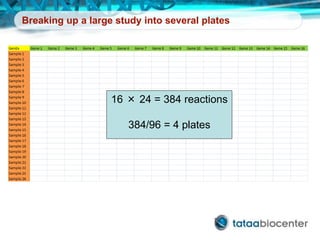
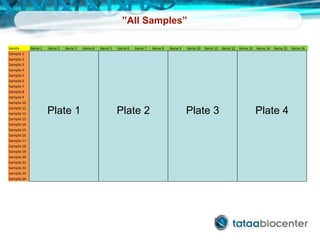
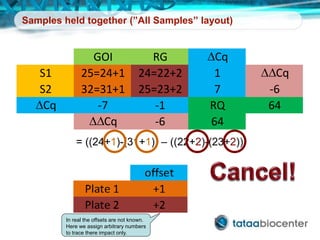
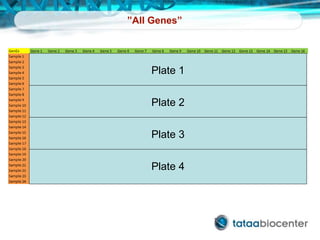
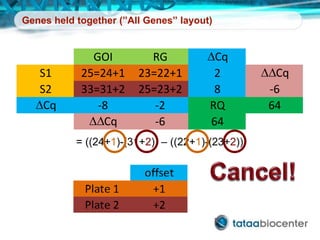
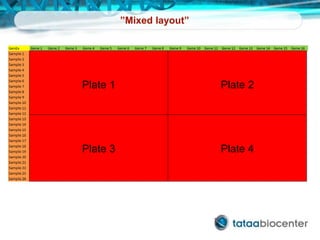
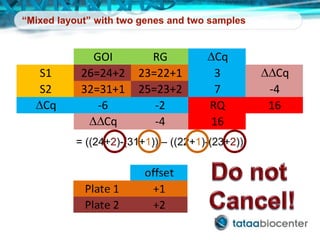
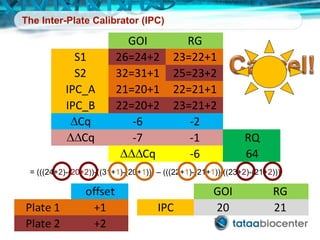
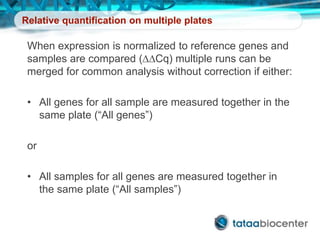
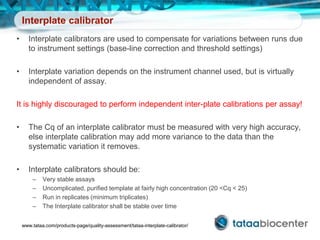
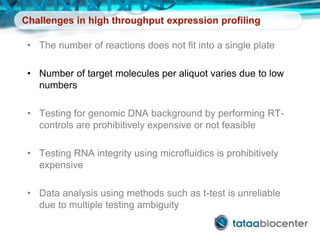
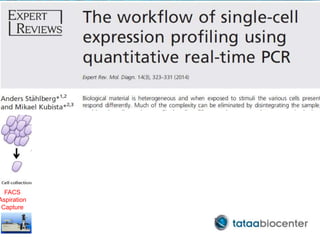
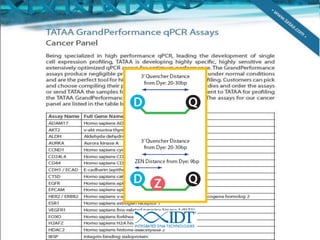
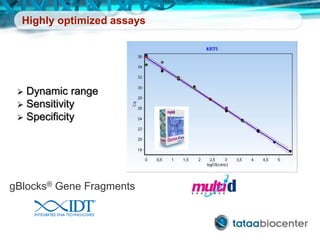
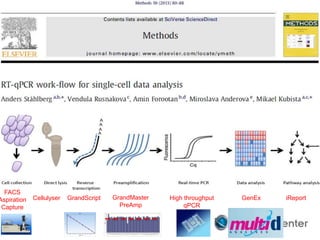

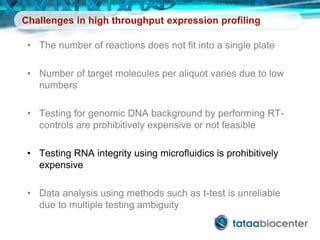
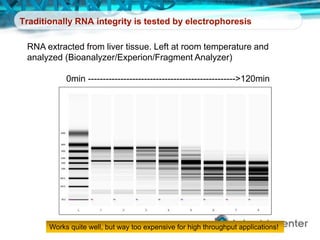
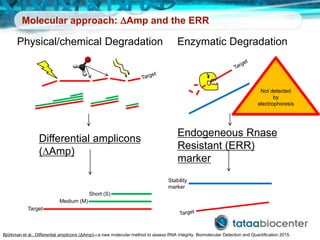
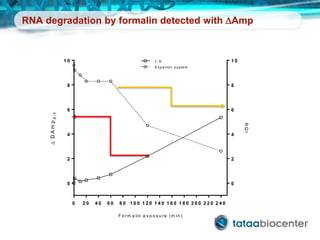
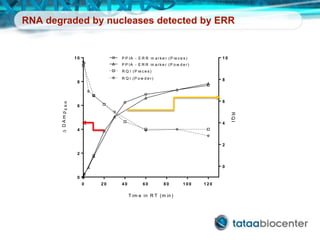
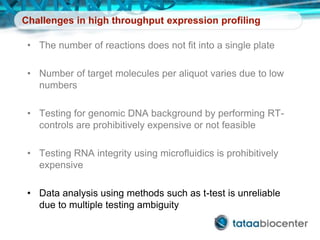
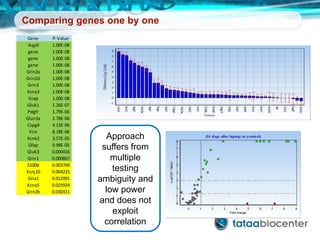
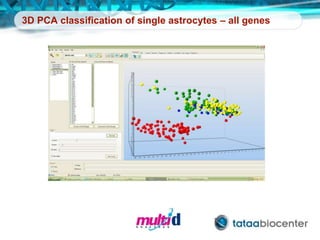
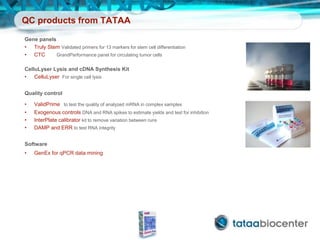


Dr. Mikael Kubista's presentation discusses the challenges of high-throughput qPCR, including issues with fitting reactions into a single plate, data analysis reliability, and the costs of necessary controls. It highlights the importance of interplate calibrators to manage variability and emphasizes the necessity for accurate RNA integrity testing. The document also outlines potential methodologies and tools for optimizing gene expression profiling in complex biological samples.


![[DL輪読会]NAS-FPN: Learning Scalable Feature Pyramid Architecture for Object Det...](https://cdn.slidesharecdn.com/ss_thumbnails/20190419misono-190513060423-thumbnail.jpg?width=640&height=640&fit=bounds)


![[DL輪読会]DIVERSE TRAJECTORY FORECASTING WITH DETERMINANTAL POINT PROCESSES](https://cdn.slidesharecdn.com/ss_thumbnails/kimura20200821dlseminarv1-200821021249-thumbnail.jpg?width=640&height=640&fit=bounds)


![Polymer [ बहुलक ] Chemistry Notes PDF - Irfanullah Mehar - JJ Sir Chemistry.pdf](https://cdn.slidesharecdn.com/ss_thumbnails/polymerchemistrynotespdf-irfanullahmehar-jjsirchemistry-260210172118-3f9b37f7-thumbnail.jpg?width=640&height=640&fit=bounds)


