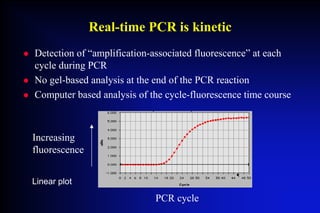
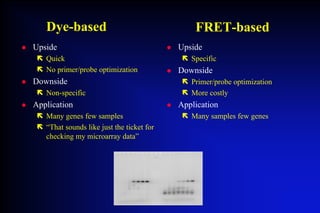
Real time and Quantitative (RTAQ) PCR
or….. for this audience…
“ so I have an outlier and I want to see if it
really is changed”
Nigel Walker, Ph.D.
Laboratory of Computational Biology and Risk Analysis,
Environmental Toxicology Program, NIEHS
I’ve got 30 minutes- what am I going to say?
z What I am going to tell you
Ñ Overview of the technology
Ñ Overview of Software based quantitation
Ñ Assay Designs
Ñ Types of Quantitative analysis
z What I am not going to tell you
Ñ How to design primers
Ñ How to use different types of PCR machines
Ñ All there is to know- this is just a brief intro
Conventional RT-PCR
z Reverse transcription (RT) of cDNA from RNA
Ñ Oligo d(T)
Ñ Random Hexamer
Ñ Gene specific primer
z PCR amplification of a defined DNA sequence from cDNA
Ñ Traditionally a 3-phase multi-cycle reaction
Ñ Denaturation, annealing, primer extension
z Electrophoretic separation of PCR products (amplicons)
Ñ PCR for specific number of cycles
Ñ Run products on an agarose gel
Real-time PCR is kinetic
z Detection of “amplification-associated fluorescence” at each
cycle during PCR
z No gel-based analysis at the end of the PCR reaction
z Computer based analysis of the cycle-fluorescence time course
Increasing
fluorescence
Linear plot
PCR cycle
Specialized Instrumentation is needed
z 96-well format
Ñ ABI SDS 7700
Ñ ABI 7000
Ñ ABI 5700
Ñ BioRad Icycler
Ñ Stratagene Mx4000
z Capillary tube format-
Ñ Roche Light cycler
z 384-well format HT systems
Ñ ABI SDS 7900
Software-based analysis
z Data acquisition
Ñ Fluorescence in each well at all cycles.
Ñ Software-based curve fit of fluorescence vs cycle #
z Threshold
Ñ Fluorescence level that is significantly greater than the baseline.
Ñ Automatically determined/User controlled
z CT (Cycle threshold)
Ñ Cycle at which fluorescence for a given sample reaches the threshold.
Ñ CT correlates, inversely, with the starting concentration of the target.
Ñ Varies with threshold- not transferable across different plates
Software-based analysis
Baseline
CT (cycle threshold)
Increasing
fluorescence
Threshold
(10sd)
Log plot
Example analysis of CYP1A1
•SYBR Green detection
•10-fold dilution series
No RNA controls
CT values
Threshold
Linear range for CYP1A1 by RTAQ-PCR
1pg-100ng Total RNA
95% E
z CT correlates, inversely, with the starting concentration of the target.
Amplification-associated fluorescence
z Fluorescent dye
Ñ Detects accumulation of DNA (SYBR green)
z FRET (Fluorescent Resonance Energy Transfer) based.
Ñ Detect accumulation of a fluorescent molecule (Taqman)
Ñ Detect accumulation of specific DNA product-(Molecular Beacons, LC)
Methods of fluorescence detection
Light
Cycler
Molecular
Beacons
Taqman
SYBR Green
R
Taq
Q
R Q
“Direct-NS” “Indirect” “Direct-S”
D A
“Direct-S”
Dye-based FRET-based
z Upside
Ñ Quick
Ñ No primer/probe optimization
z Downside
Ñ Non-specific
z Application
Ñ Many genes few samples
Ñ “That sounds like just the ticket for
checking my microarray data”
z Upside
Ñ Specific
z Downside
Ñ Primer/probe optimization
Ñ More costly
z Application
Ñ Many samples few genes
Primer sets
z There are no large databases of primer sets
Ñ We attempted to get a database going early on with little success.
z Commercial pre-developed assays are available
z Dye-based
Ñ Existing primers could be adapted but may not be the best
z Probe-based
Ñ Unlikely that existing PCR primer pairs will be suitable
Ñ Primers and probes designed to match specific reaction conditions.
z Primer design
Ñ Primer Express™ software facilitates design (for ABI system) (SCL copies)
Ñ No optimization of primer annealing temperature
Ñ Multiple primer sets can use same default cycling conditions on SDS7700
Quantitation
z Absolute quantitation (eg. copies/ug RNA)
Ñ Interpolate CT vs standard curve of known copies of nucleic acid
Ñ Total RNA, in vitro transcribed RNA, DNA
z Unit-less quantitation (arbitrary values/ug RNA)
Ñ Interpolate CT vs dilution curve of a “quantitator standard RNA”
Relative quantitation
z ∆CT between “control” and “treated” RNAs on a single plate
Ñ Fold-difference
Ñ Cannot compare Ct between samples on different plates
z ∆CT between “calibrator” RNA sample and unknown RNA
Ñ Same calibrator RNA can be on multiple plates
z ∆∆CT between “control” and “treated”
Ñ Fold change-normalized to a separate reference gene/sample
Relative fold change
z CT inversely correlated with starting copies
z Each cycle there is a “doubling” of amplicons (assuming 100%
efficiency)
z Difference in 1 cycle therefore a 2=fold difference in copies
Fold change = 2∆ CT
∆Ct = 3.31
Fold difference in starting copy number = 2 3.31 = 9.9
Correlation of real-time and microarray
R2
= 0.6888
0.1
1
10
100
0.1 1 10 100
Microarray fold
Data from Martinez et al (submitted), SYBR, 2∆Ct
Efficiency adjustment
For a ∆Ct=1, Fold change = efficiency
z 2∆ CT assumes a 100% efficient amplification
z For single gene efficiency adjustment use
Ñ Fold change = e ∆Ct
Ñ Where efficiency(e%) = 10 (-1/slope)
z For a ∆Ct=1, Fold change = efficiency
Calculation of Efficiency
z Based on a linear plot of CT vs. log copies:
z Efficiency(e%) = 10 (-1/slope)
z 100% efficiency (2 copies each cycle) slope of –3.3219.
Slope = -3.462
e = 10 (-1/3.462) = 1.95
1.95 copies per cycle
∆Ct = 3.3
Fold= (1.95) 3.31 = 9.1 fold
Efficiency adjusted Normalization
z Fold-change can be “normalized” relative to a “reference gene”
z Reference can be a separate sample on the plate
z Beware of the interpretation of a normalized fold change
Ñ Assumption that the reference gene is “unaffected” by treatment
Can I really detect <2X changes?
z How can you be sure a difference is real?
Ñ T-test on triplicates CTs
z Sensitivity of discrimination is dependent upon..
Ñ Efficiency
Ñ Assay variability
Ñ Number of Replicates
Variability impact on ∆Ct
z Taqman or SYBR
z Standard deviations (n = 9)
Ñ 0.2-0.5 cycles
Ñ CV, 1-2% on CT values
z Power calculation for ∆Ct =1, 90%, p<0.05 (T-test)
Ñ sd=0.25, n = 3
Ñ sd =0.33, n = 4
Ñ sd= 0.5. n = 7
Issues of assay design
z RNA specific sets -ie Primers spanning intron location
Ñ If you know the gene and have the time go for it.
Ñ Not all genes in database and annotated esp. rat
z Do you need RNA specific sets?
Ñ RNA expression 103-108 copies/100ng total RNA
Ñ 100 ng RNA approx = 100 single gene copies (assuming 1% DNA contam)
z Reverse transcription
Ñ Gene specific primer is best especially if using a synthetic RNA standard
Ñ Oligo d(T)-may not be good for 5’ end targets
Ñ Random hexamers - poor for synthetic RNA standard
Some Take-home advice
z You’re not in Kansas anymore, so do your homework first
Ñ Learn the concepts before you do the assay
z Specialized machines
Ñ Make contact with someone who will let you use their machine
z The devil is in the details.
Ñ You can get the same CT from very different curves of different quality
z You still need gels
Ñ While quantitation is gel-free, a picture tells a thousand words
z Replicate
Ñ You can detect a 2X change with duplicates but is it for real?
Acknowledgements/Information sources
z Chris Miller- now the ABI Field Application Specialist!
z NIEHS Real-time PCR webpage
Ñ http://dir.niehs.nih.gov/pcr
z Applied Biosystems
Ñ http://www.appliedbiosystems.com/apps
z BioRad ICycler
Ñ http://www.bio-rad.com/iCycler/
z Stratagene
Ñ http://www.stratagene.com/q_pcr/index.htm
z Light Cycler
Ñ http://biochem.roche.com/lightcycler/lc_sys/lc_sys.htm
Additional Reference
Michael W. Pfaffl. A new mathematical model for relative quantification in real-
time RT-PCR. Nucleic Acids Research 29(9): 2005-2007, 2001.

qRT-PCR Presentation.pdf

  • 1.
    Real time andQuantitative (RTAQ) PCR or….. for this audience… “ so I have an outlier and I want to see if it really is changed” Nigel Walker, Ph.D. Laboratory of Computational Biology and Risk Analysis, Environmental Toxicology Program, NIEHS
  • 2.
    I’ve got 30minutes- what am I going to say? z What I am going to tell you Ñ Overview of the technology Ñ Overview of Software based quantitation Ñ Assay Designs Ñ Types of Quantitative analysis z What I am not going to tell you Ñ How to design primers Ñ How to use different types of PCR machines Ñ All there is to know- this is just a brief intro
  • 3.
    Conventional RT-PCR z Reversetranscription (RT) of cDNA from RNA Ñ Oligo d(T) Ñ Random Hexamer Ñ Gene specific primer z PCR amplification of a defined DNA sequence from cDNA Ñ Traditionally a 3-phase multi-cycle reaction Ñ Denaturation, annealing, primer extension z Electrophoretic separation of PCR products (amplicons) Ñ PCR for specific number of cycles Ñ Run products on an agarose gel
  • 4.
    Real-time PCR iskinetic z Detection of “amplification-associated fluorescence” at each cycle during PCR z No gel-based analysis at the end of the PCR reaction z Computer based analysis of the cycle-fluorescence time course Increasing fluorescence Linear plot PCR cycle
  • 5.
    Specialized Instrumentation isneeded z 96-well format Ñ ABI SDS 7700 Ñ ABI 7000 Ñ ABI 5700 Ñ BioRad Icycler Ñ Stratagene Mx4000 z Capillary tube format- Ñ Roche Light cycler z 384-well format HT systems Ñ ABI SDS 7900
  • 6.
    Software-based analysis z Dataacquisition Ñ Fluorescence in each well at all cycles. Ñ Software-based curve fit of fluorescence vs cycle # z Threshold Ñ Fluorescence level that is significantly greater than the baseline. Ñ Automatically determined/User controlled z CT (Cycle threshold) Ñ Cycle at which fluorescence for a given sample reaches the threshold. Ñ CT correlates, inversely, with the starting concentration of the target. Ñ Varies with threshold- not transferable across different plates
  • 7.
    Software-based analysis Baseline CT (cyclethreshold) Increasing fluorescence Threshold (10sd) Log plot
  • 8.
    Example analysis ofCYP1A1 •SYBR Green detection •10-fold dilution series No RNA controls CT values Threshold
  • 9.
    Linear range forCYP1A1 by RTAQ-PCR 1pg-100ng Total RNA 95% E z CT correlates, inversely, with the starting concentration of the target.
  • 10.
    Amplification-associated fluorescence z Fluorescentdye Ñ Detects accumulation of DNA (SYBR green) z FRET (Fluorescent Resonance Energy Transfer) based. Ñ Detect accumulation of a fluorescent molecule (Taqman) Ñ Detect accumulation of specific DNA product-(Molecular Beacons, LC)
  • 11.
    Methods of fluorescencedetection Light Cycler Molecular Beacons Taqman SYBR Green R Taq Q R Q “Direct-NS” “Indirect” “Direct-S” D A “Direct-S”
  • 12.
    Dye-based FRET-based z Upside ÑQuick Ñ No primer/probe optimization z Downside Ñ Non-specific z Application Ñ Many genes few samples Ñ “That sounds like just the ticket for checking my microarray data” z Upside Ñ Specific z Downside Ñ Primer/probe optimization Ñ More costly z Application Ñ Many samples few genes
  • 13.
    Primer sets z Thereare no large databases of primer sets Ñ We attempted to get a database going early on with little success. z Commercial pre-developed assays are available z Dye-based Ñ Existing primers could be adapted but may not be the best z Probe-based Ñ Unlikely that existing PCR primer pairs will be suitable Ñ Primers and probes designed to match specific reaction conditions. z Primer design Ñ Primer Express™ software facilitates design (for ABI system) (SCL copies) Ñ No optimization of primer annealing temperature Ñ Multiple primer sets can use same default cycling conditions on SDS7700
  • 14.
    Quantitation z Absolute quantitation(eg. copies/ug RNA) Ñ Interpolate CT vs standard curve of known copies of nucleic acid Ñ Total RNA, in vitro transcribed RNA, DNA z Unit-less quantitation (arbitrary values/ug RNA) Ñ Interpolate CT vs dilution curve of a “quantitator standard RNA”
  • 15.
    Relative quantitation z ∆CTbetween “control” and “treated” RNAs on a single plate Ñ Fold-difference Ñ Cannot compare Ct between samples on different plates z ∆CT between “calibrator” RNA sample and unknown RNA Ñ Same calibrator RNA can be on multiple plates z ∆∆CT between “control” and “treated” Ñ Fold change-normalized to a separate reference gene/sample
  • 16.
    Relative fold change zCT inversely correlated with starting copies z Each cycle there is a “doubling” of amplicons (assuming 100% efficiency) z Difference in 1 cycle therefore a 2=fold difference in copies Fold change = 2∆ CT ∆Ct = 3.31 Fold difference in starting copy number = 2 3.31 = 9.9
  • 17.
    Correlation of real-timeand microarray R2 = 0.6888 0.1 1 10 100 0.1 1 10 100 Microarray fold Data from Martinez et al (submitted), SYBR, 2∆Ct
  • 18.
    Efficiency adjustment For a∆Ct=1, Fold change = efficiency z 2∆ CT assumes a 100% efficient amplification z For single gene efficiency adjustment use Ñ Fold change = e ∆Ct Ñ Where efficiency(e%) = 10 (-1/slope) z For a ∆Ct=1, Fold change = efficiency
  • 19.
    Calculation of Efficiency zBased on a linear plot of CT vs. log copies: z Efficiency(e%) = 10 (-1/slope) z 100% efficiency (2 copies each cycle) slope of –3.3219. Slope = -3.462 e = 10 (-1/3.462) = 1.95 1.95 copies per cycle ∆Ct = 3.3 Fold= (1.95) 3.31 = 9.1 fold
  • 20.
    Efficiency adjusted Normalization zFold-change can be “normalized” relative to a “reference gene” z Reference can be a separate sample on the plate z Beware of the interpretation of a normalized fold change Ñ Assumption that the reference gene is “unaffected” by treatment
  • 21.
    Can I reallydetect <2X changes? z How can you be sure a difference is real? Ñ T-test on triplicates CTs z Sensitivity of discrimination is dependent upon.. Ñ Efficiency Ñ Assay variability Ñ Number of Replicates
  • 22.
    Variability impact on∆Ct z Taqman or SYBR z Standard deviations (n = 9) Ñ 0.2-0.5 cycles Ñ CV, 1-2% on CT values z Power calculation for ∆Ct =1, 90%, p<0.05 (T-test) Ñ sd=0.25, n = 3 Ñ sd =0.33, n = 4 Ñ sd= 0.5. n = 7
  • 23.
    Issues of assaydesign z RNA specific sets -ie Primers spanning intron location Ñ If you know the gene and have the time go for it. Ñ Not all genes in database and annotated esp. rat z Do you need RNA specific sets? Ñ RNA expression 103-108 copies/100ng total RNA Ñ 100 ng RNA approx = 100 single gene copies (assuming 1% DNA contam) z Reverse transcription Ñ Gene specific primer is best especially if using a synthetic RNA standard Ñ Oligo d(T)-may not be good for 5’ end targets Ñ Random hexamers - poor for synthetic RNA standard
  • 24.
    Some Take-home advice zYou’re not in Kansas anymore, so do your homework first Ñ Learn the concepts before you do the assay z Specialized machines Ñ Make contact with someone who will let you use their machine z The devil is in the details. Ñ You can get the same CT from very different curves of different quality z You still need gels Ñ While quantitation is gel-free, a picture tells a thousand words z Replicate Ñ You can detect a 2X change with duplicates but is it for real?
  • 25.
    Acknowledgements/Information sources z ChrisMiller- now the ABI Field Application Specialist! z NIEHS Real-time PCR webpage Ñ http://dir.niehs.nih.gov/pcr z Applied Biosystems Ñ http://www.appliedbiosystems.com/apps z BioRad ICycler Ñ http://www.bio-rad.com/iCycler/ z Stratagene Ñ http://www.stratagene.com/q_pcr/index.htm z Light Cycler Ñ http://biochem.roche.com/lightcycler/lc_sys/lc_sys.htm
  • 26.
    Additional Reference Michael W.Pfaffl. A new mathematical model for relative quantification in real- time RT-PCR. Nucleic Acids Research 29(9): 2005-2007, 2001.