Downloaded 523 times
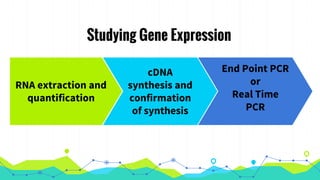
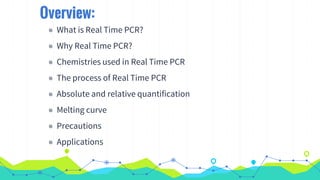
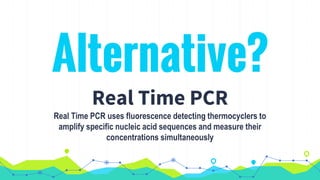

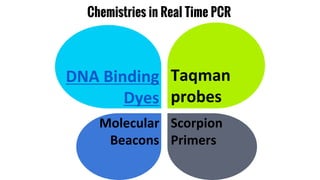
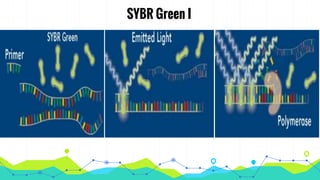
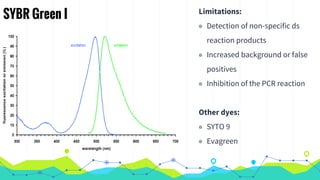
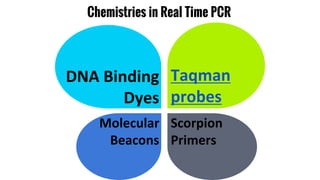
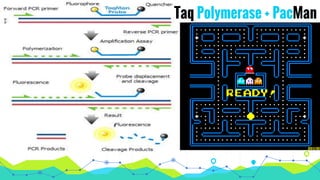
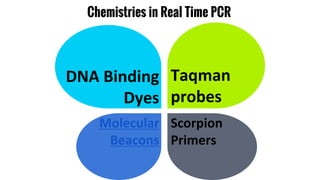
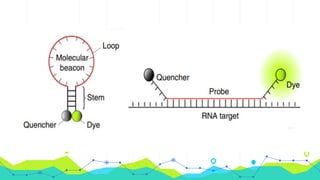
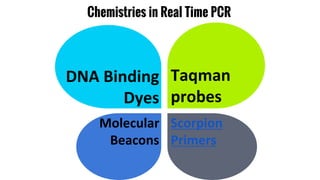
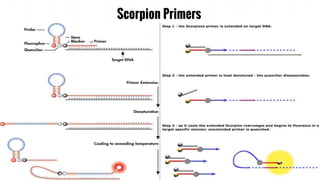


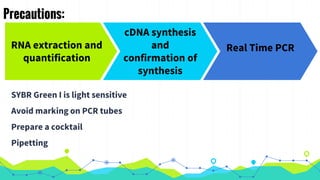
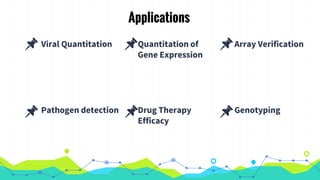
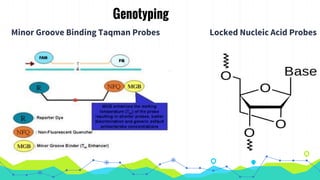
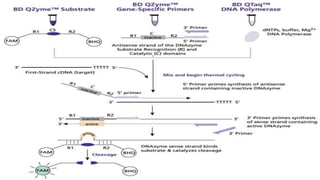


The document provides an overview of real-time PCR (Polymerase Chain Reaction), detailing its significance, processes, and applications in biotechnology. It covers the chemistries used, such as DNA binding dyes and probes, and explains absolute and relative quantification methods along with practical precautions. Additionally, it highlights real-time PCR applications including viral quantitation, gene expression analysis, and pathogen detection.