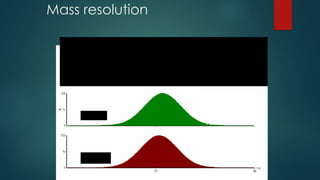
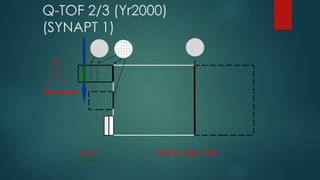
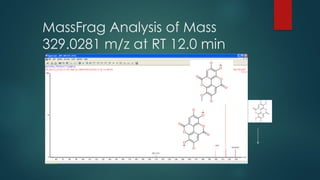
The document discusses high-resolution mass spectrometry (HRMS) solutions for identifying and structurally elucidating unknown compounds, detailing the workflow and technologies involved. It highlights the significance of various spectroscopic techniques, including NMR and mass spectrometry, in determining molecular formulas and structures. Case studies and advancements in technology, such as Waters' Q-TOF systems and lock mass corrections, are presented to illustrate the effectiveness of these methods in compound analysis.

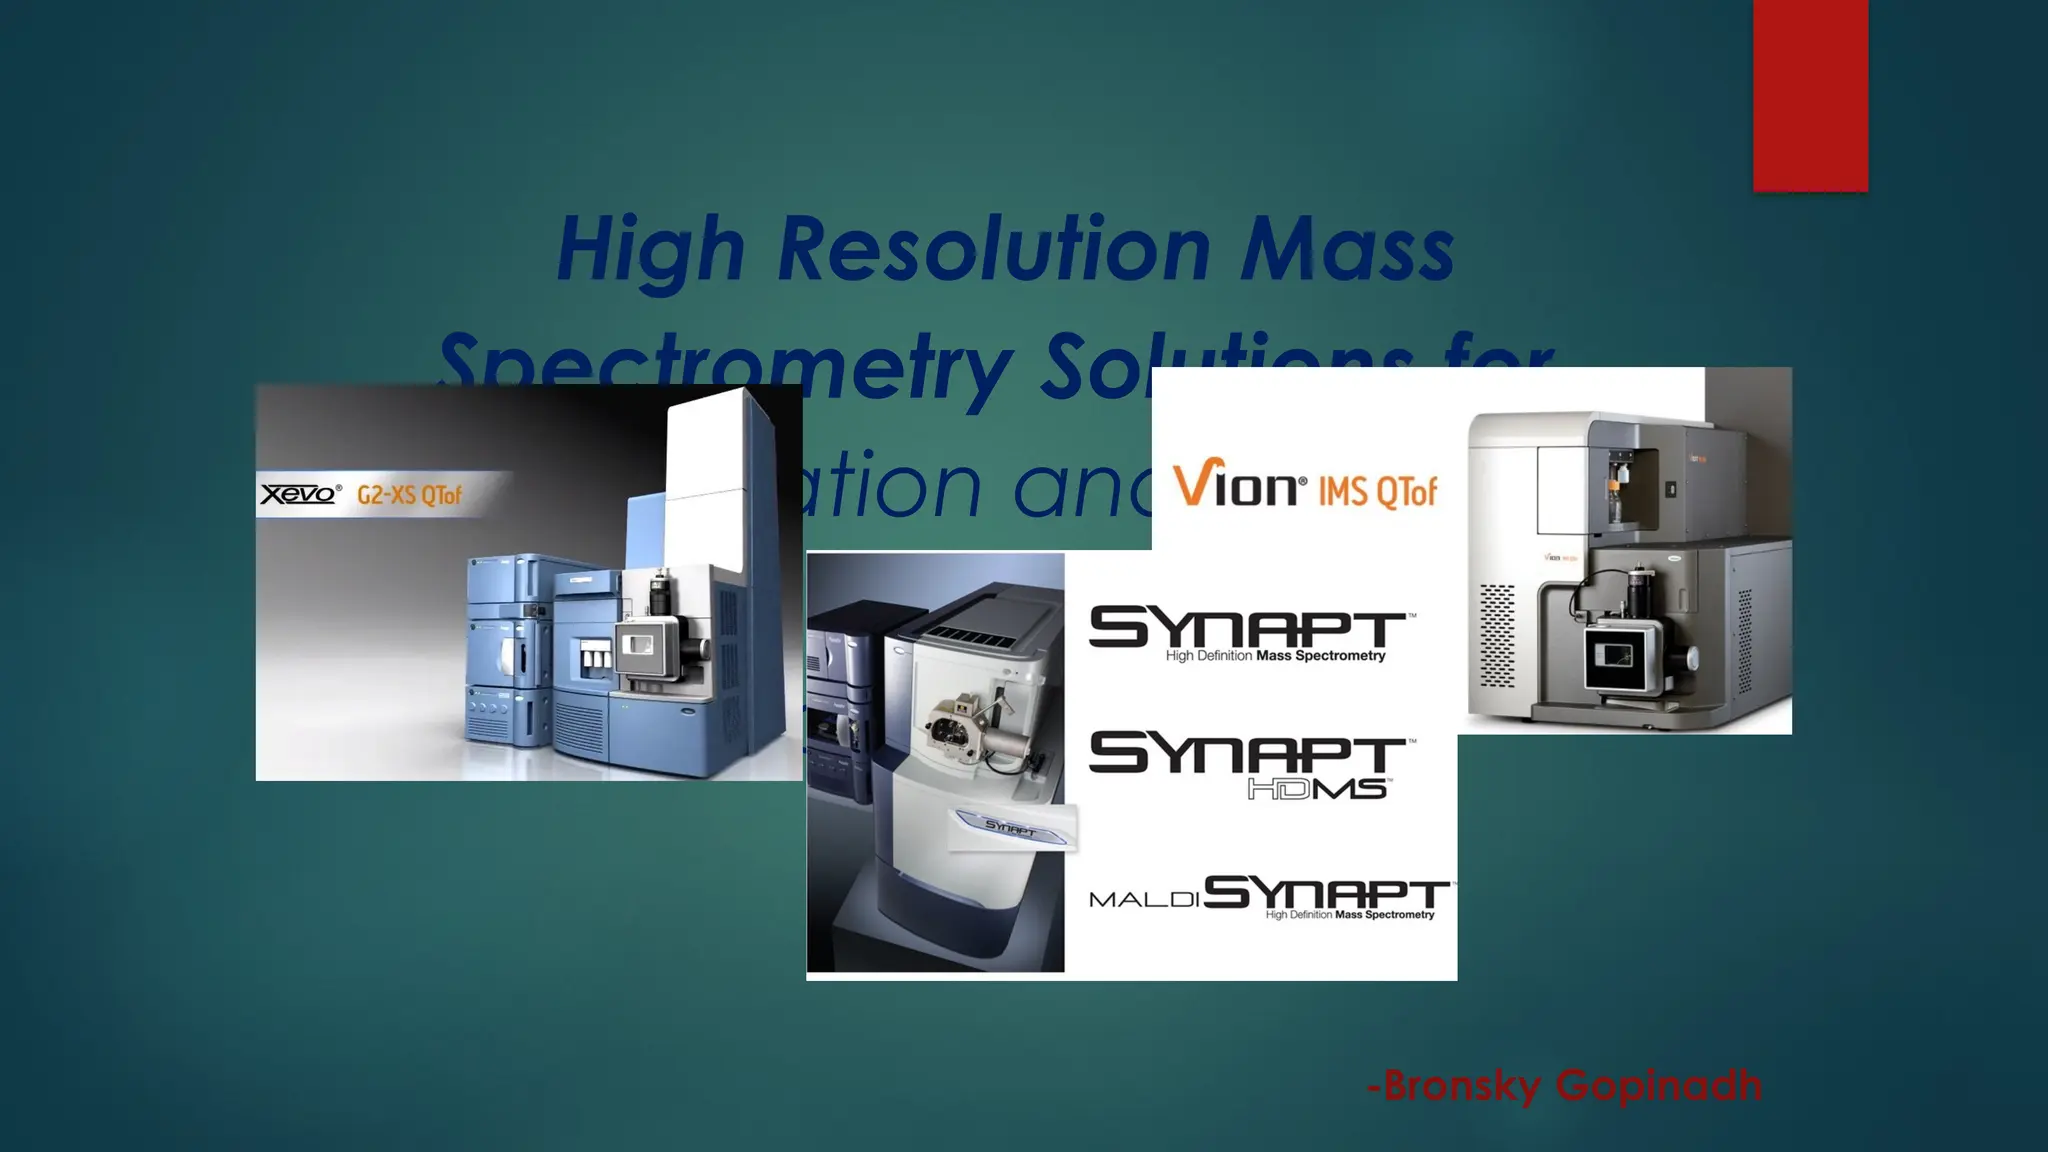


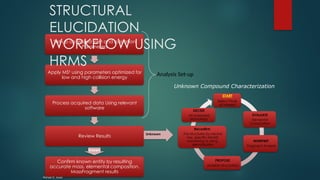


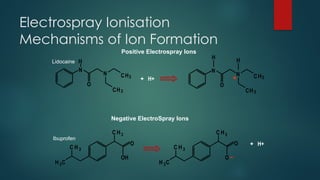


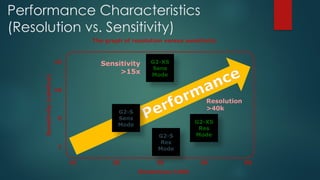


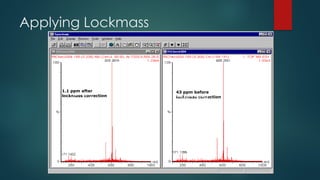
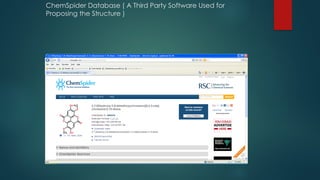
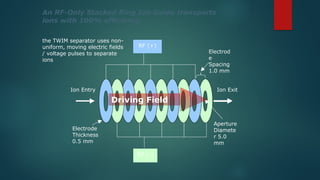
![Lock-Spray with
APCI
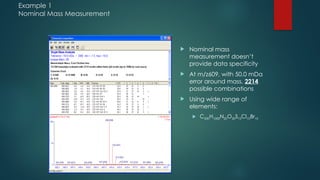
Exact Mass Results
17a-hydroxyprogesterone (C21H30O3)
[M+H]=331.2273
5 repeat injections
Inj No. Actual mDa
error
ppm
error
1 331.2274 0.1 0.3
2 331.2270 0.3 0.9
3 331.2273 0.0 0.0
4 331.2271 0.2 0.6
5 331.2273 0.0 0.0](https://image.slidesharecdn.com/highresolutionmassspectrometrysolutionsfor-240913141016-810a0fab/85/High-Resolution-Mass-Spectrometry-Solutions-for-pptx-54-320.jpg)


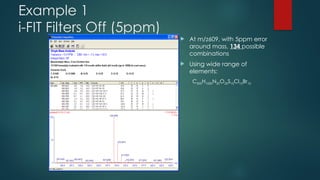


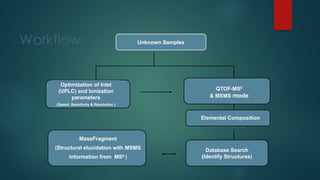
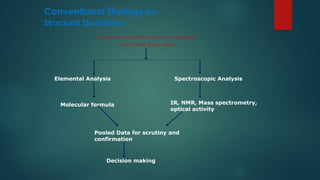
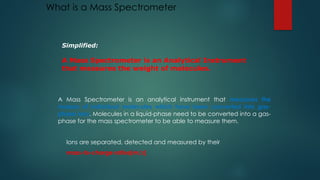
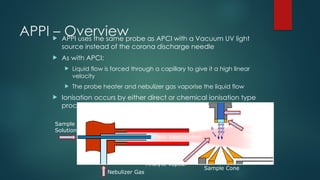
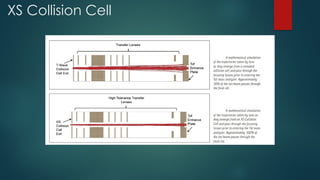
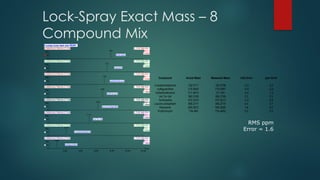
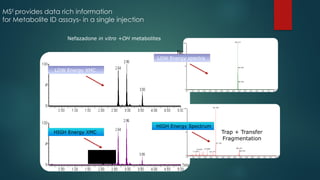
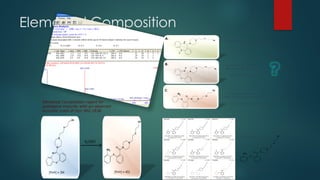
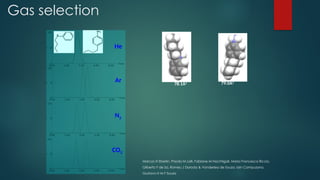
![Workflow (Contd…)
In the TOF MSE
experiment, the mass spectrometer performs data acquisition by rapidly
switching from a low-collision energy (CE) scan to a high-CE scan in a single run
The low-CE experiments provide information about the intact unfragmented ion, e.g.
[ M+H]+, while the high-CE scan generates fragment ion information
The low CE data generated from MSE
experiments performed on the QToF system provides
accurate mass information which is then used for predicting the elemental composition of the
chemical entities
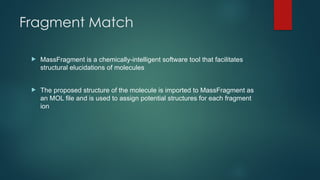
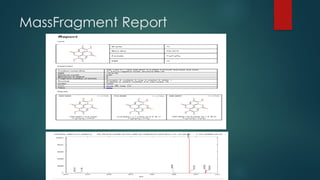
The high CE data is submitted along with a probable structure to MassFrag software within
MassLynx to propose structures for the fragment ions
MassFragment is a chemically-intelligent software tool that facilitates structural elucidations](https://image.slidesharecdn.com/highresolutionmassspectrometrysolutionsfor-240913141016-810a0fab/85/High-Resolution-Mass-Spectrometry-Solutions-for-pptx-67-320.jpg)
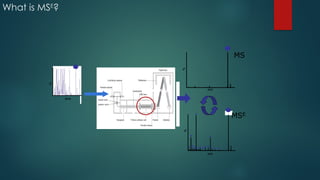
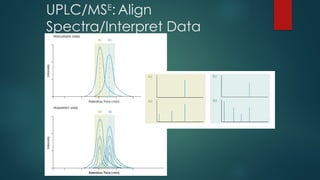


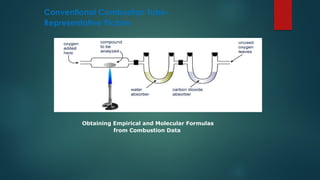
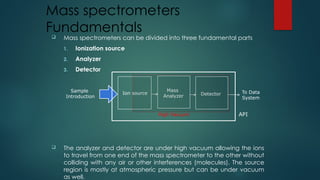
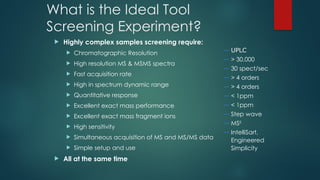
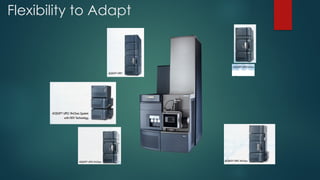
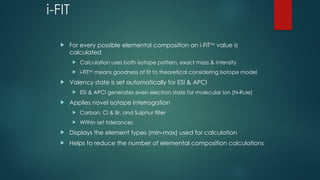
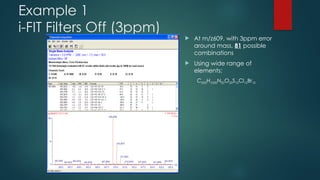
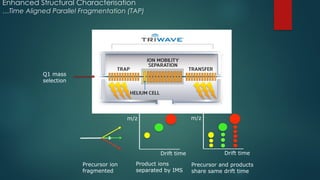
![Maximizing Separation Power:
Combining Elevated Temperature with UPLC Technology
16-Feb-2006 16667.00000000
Time
5.00 10.00 15.00 20.00 25.00 30.00 35.00 40.00 45.00 50.00
%
0
100
021606_PR_ESIPOS_007 1: TOF MS ES+
BPI
2.38e3
15.51
11.41
0.43
0.46
5.00
2.95
1.09
2.08
6.00
6.97
7.87 8.73
11.42
14.74
11.51
11.53
15.52 33.94
28.86
27.58
16.25
27.57
20.54
16.77
18.51
21.42
25.84
25.23
32.66
31.17
33.97
47.19
47.18
33.99
45.76
41.66
16-Feb-2006 16667.00000000
Time
10.80 11.00 11.20 11.40 11.60 11.80 12.00 12.20 12.40 12.60 12.80
%
0
100
021606_PR_ESIPOS_007 1:TOFMSES+
BPI
1.55e3
11.41
10.94
11.42
11.51
11.50
11.53
Rainville
Chinese Ginseng Extract
ACQUITY UPLC BEH C18
2.1 x 300 mm, 1.7 µm
[2 columns in series]
Temp = 90 o
C
13,500 PSI
Peak Capacity = 870
1 hour run time](https://image.slidesharecdn.com/highresolutionmassspectrometrysolutionsfor-240913141016-810a0fab/85/High-Resolution-Mass-Spectrometry-Solutions-for-pptx-84-320.jpg)


![LIQUID CHROMATOGRAPHY- MASS SPECTROSCOPY[LC-MS]](https://cdn.slidesharecdn.com/ss_thumbnails/63-191219160156-thumbnail.jpg?width=640&height=640&fit=bounds)


