
Download to read offline
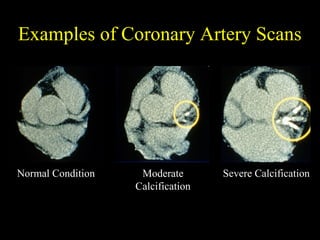
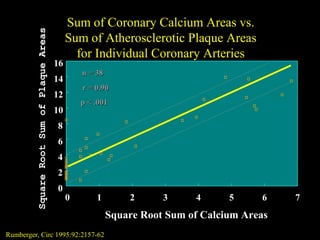
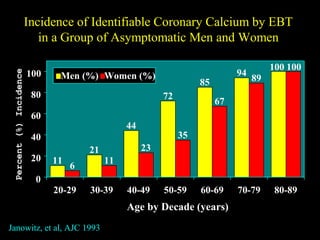
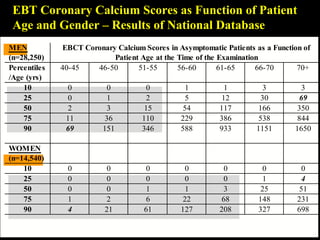
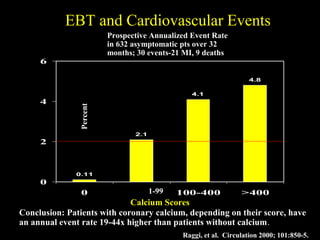
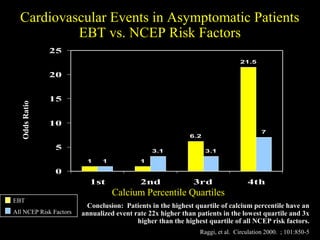
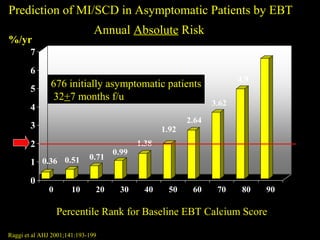
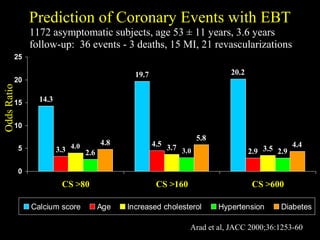
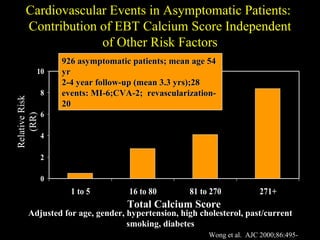
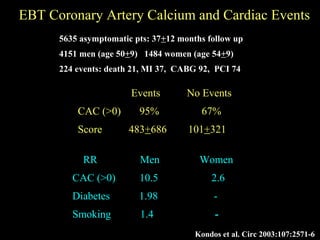
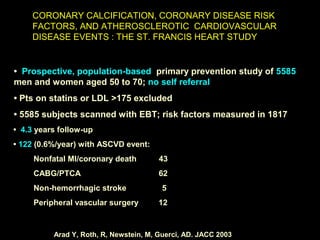
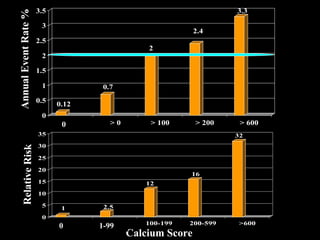
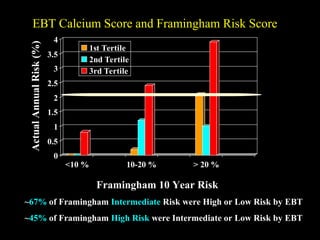
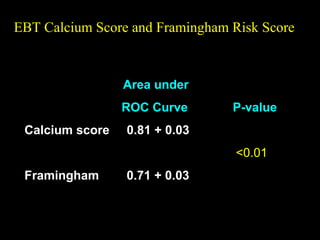
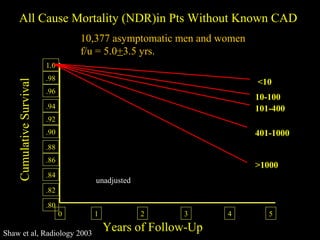
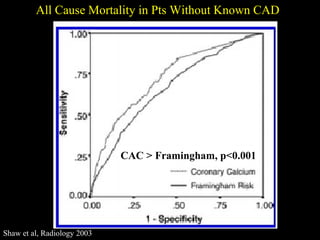
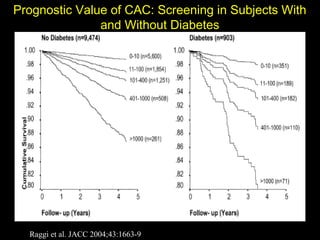
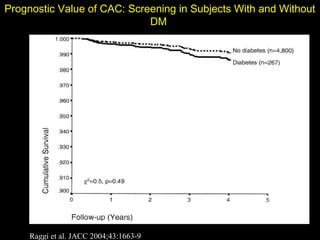
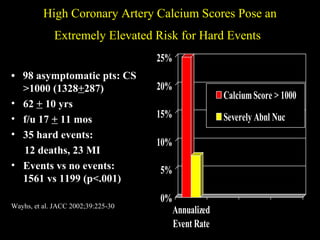
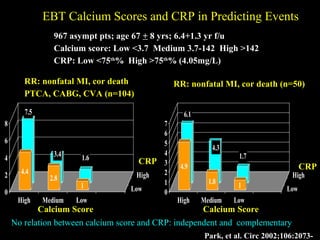
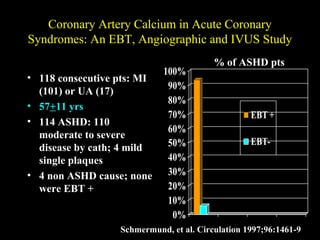
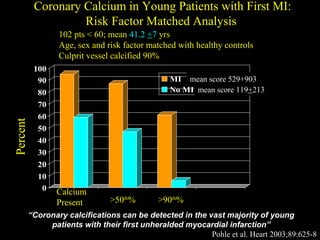
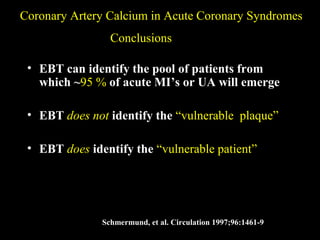
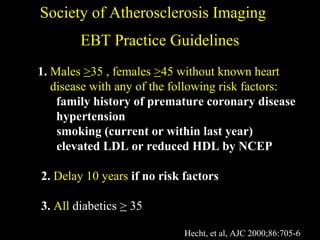

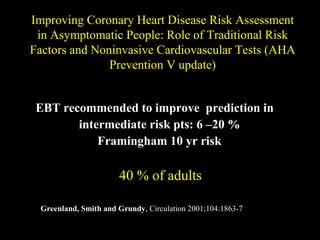
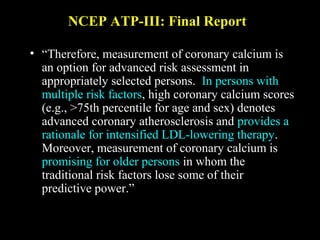
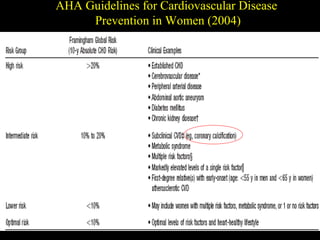
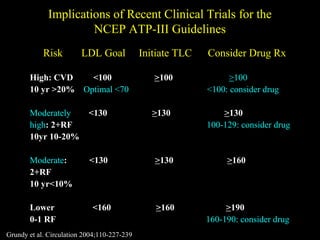
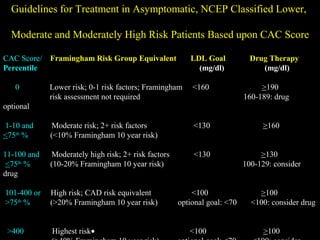
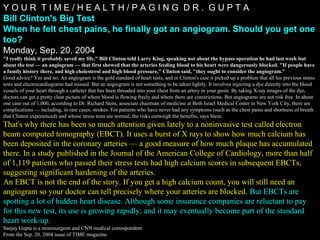

The document discusses the role of imaging coronary calcium using electron beam tomography (EBT) scans. It provides evidence that EBT calcium scores are strongly correlated with the amount of atherosclerotic plaque buildup. It also shows that higher EBT calcium scores are associated with significantly higher risks of future cardiovascular events, with risk increasing progressively as calcium scores rise. EBT calcium scoring more accurately predicts cardiovascular risk than traditional risk models like Framingham and can reclassify a person's risk level in about half of intermediate-risk individuals.


