
Download to read offline
![EBT and Coronary Artery CalciumEBT and Coronary Artery Calcium
Coronary Artery CalciumCoronary Artery Calcium ISIS AtherosclerosisAtherosclerosis
There areThere are NONO false positive calcium measuresfalse positive calcium measures
by EBT [i.e. ALL calcium is plaque]by EBT [i.e. ALL calcium is plaque]
Establishes a diagnosis ofEstablishes a diagnosis of
coronary atherosclerosiscoronary atherosclerosis](https://image.slidesharecdn.com/9efnxcb7toynfdrkocfa-signature-26ef91b794525dae1462a02923bcb802632ee8d44f6c070f1e331fbfb9f5a8b7-poli-160907160911/85/3rd-vulnerable-plaque-rumberg-3-16-02-2-1-320.jpg)
![EBT and Coronary Artery CalciumEBT and Coronary Artery Calcium
Coronary Artery CalciumCoronary Artery Calcium ISIS AtherosclerosisAtherosclerosis
There areThere are NONO false positive calcium measuresfalse positive calcium measures
by EBT [i.e. ALL calcium is plaque]by EBT [i.e. ALL calcium is plaque]
Establishes a diagnosis ofEstablishes a diagnosis of
coronary atherosclerosiscoronary atherosclerosis](https://image.slidesharecdn.com/9efnxcb7toynfdrkocfa-signature-26ef91b794525dae1462a02923bcb802632ee8d44f6c070f1e331fbfb9f5a8b7-poli-160907160911/75/3rd-vulnerable-plaque-rumberg-3-16-02-2-1-2048.jpg)
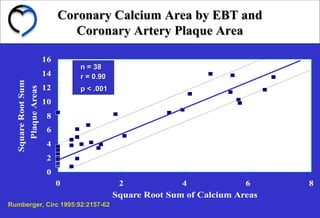
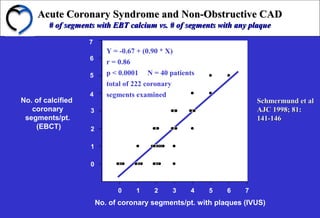

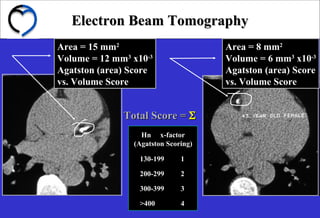

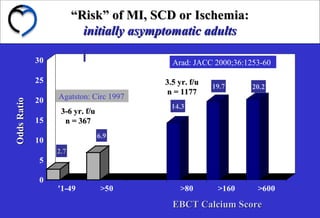
Coronary artery calcium detected by electron beam tomography (EBT) establishes a diagnosis of coronary atherosclerosis, as there are no false positive calcium measurements. The amount of calcium seen on EBT correlates directly with the actual amount of coronary plaque measured by intravascular ultrasound and histopathology. Studies have also shown that a higher coronary artery calcium score on EBT is associated with greater risk of future myocardial infarction, sudden cardiac death, or ischemia over follow-up periods of 3-6 years.


![PERI-PROSTHETIC FRACTURE NAIL-PLATE CONSTRUCT [NPC].pptx](https://cdn.slidesharecdn.com/ss_thumbnails/drarunkumardrmohamedashrafperiprostheticfrasturenail-plateconstructnpc-260209164459-7e9d15a1-thumbnail.jpg?width=640&height=640&fit=bounds)
![ONFH[AVN HIP] -TRIPLE REGIME -A NOVAL SURGICAL CONCEPT .pptx](https://cdn.slidesharecdn.com/ss_thumbnails/onfhavnhip2026koaconcalicutdrgokuldevdrmashraf-260210064517-213ec005-thumbnail.jpg?width=640&height=640&fit=bounds)


![CTEV [ clubfoot] DR ARUN LAL ,DR MOHAMED ASHRAF travancore medical college k...](https://cdn.slidesharecdn.com/ss_thumbnails/ctevclubfootdrarunlaldrmohamedashraftravancoremedicalcollegekollamkeralaindia-260208063247-18fc466c-thumbnail.jpg?width=640&height=640&fit=bounds)

