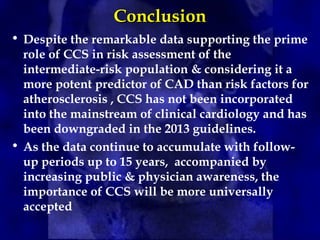
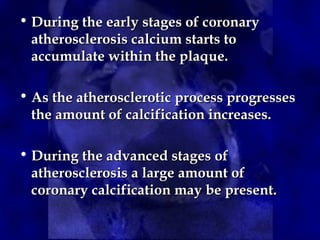
CT calcium scoring is a non-invasive imaging test that quantifies coronary artery calcium (CAC) using computed tomography (CT) to assess atherosclerotic burden and predict cardiovascular risk. It is primarily used for risk stratification in asymptomatic individuals, guiding preventive strategies. The scan is performed using ECG-gated non-contrast CT, with results expressed as an Agatston score, categorizing patients into low (0), mild (1-99), moderate (100-399), and high (≥400) risk groups. A higher score indicates greater atherosclerotic burden and an increased risk of coronary artery disease (CAD) and cardiovascular events. While CT calcium scoring improves risk assessment beyond traditional clinical factors, it does not differentiate stable from unstable plaques and is not typically used in symptomatic patients. Future advancements include AI-assisted scoring and integration with predictive models to refine cardiovascular risk assessment.
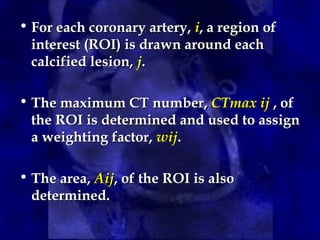
![• The method is based on the maximum x-ray
attenuation coefficient, or CT number
(measured in Hounsfield units [HU]), and
the area of calcium deposits.
• First, calcified lesions are identified on CT
images by applying a threshold of 130 HU
to the entire image set; tissues with
densities equal to or greater than the
threshold are considered to correspond to
calcium.
Agatston Score
Agatston Score](https://image.slidesharecdn.com/scoringctcalcium-250320072337-b90236cc/85/CT-Calcium-Scoring-Lecture-Overview-Powerpoint-14-320.jpg)