Download to read offline

![[Price for scheduled purchasing]
Arbitrarily made
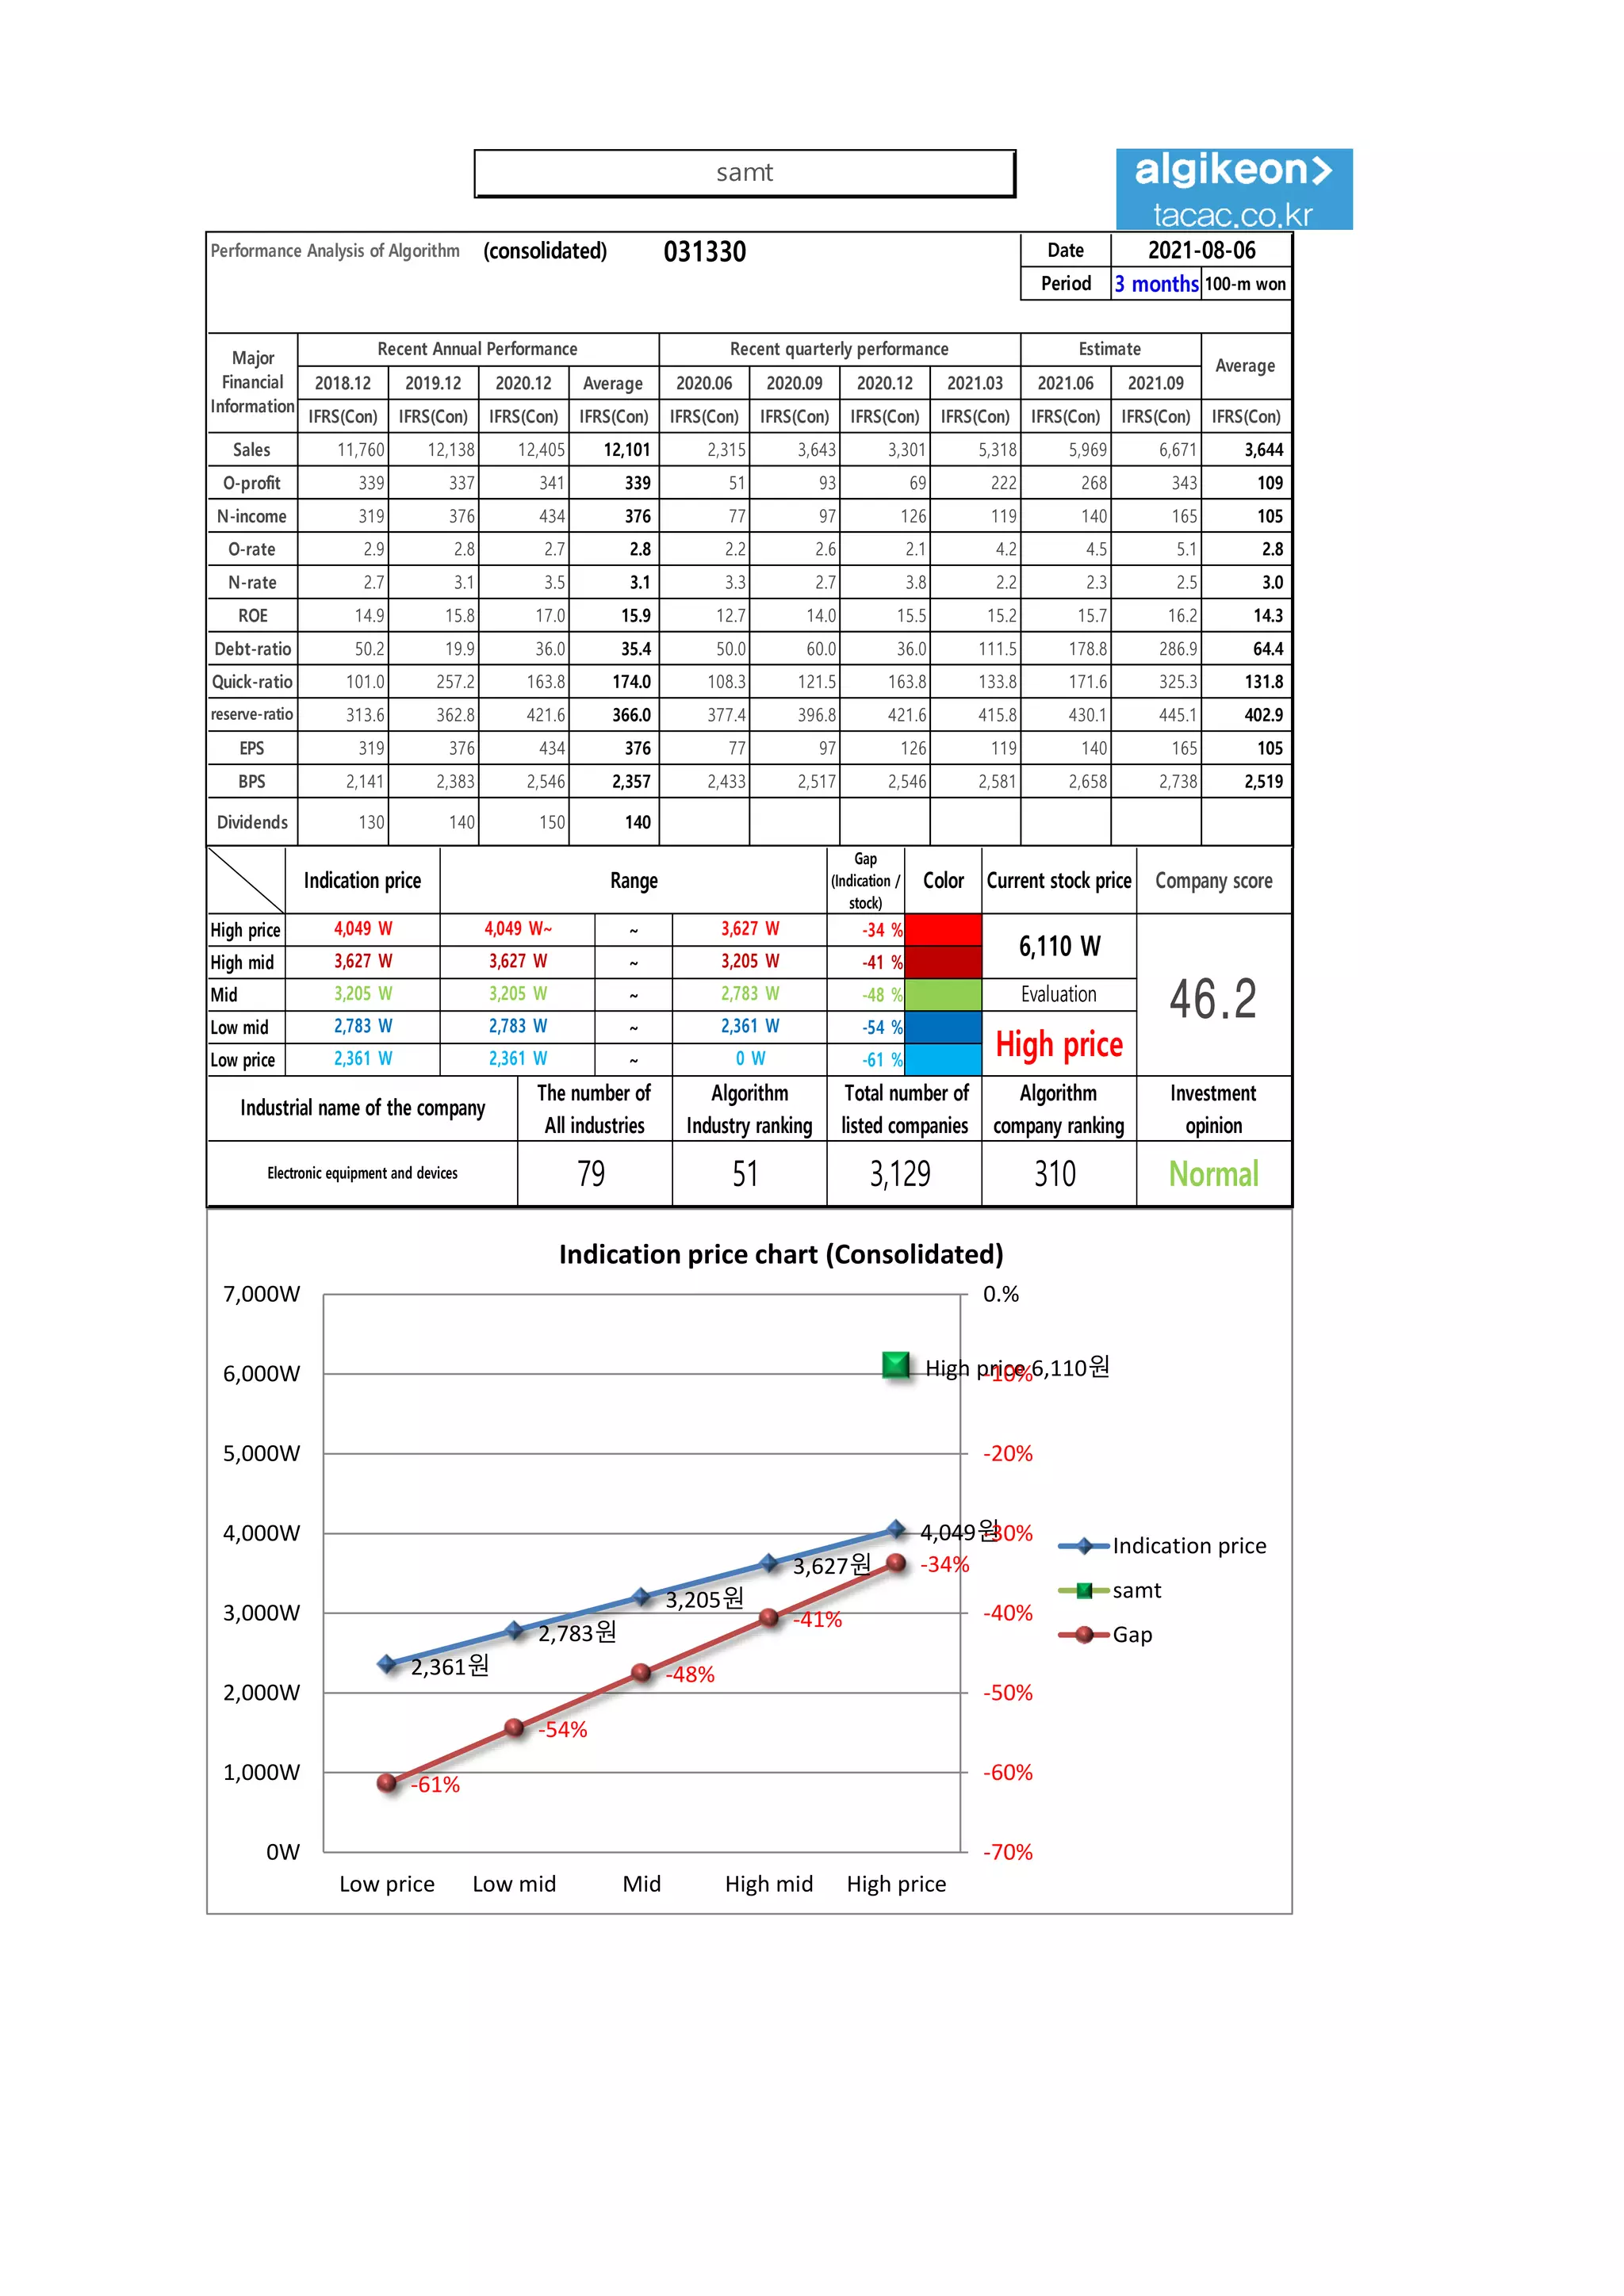
Algorithm stocks Trading Strategies (consolidated) 031330 Date
Period
Gap
(Indication /
stock)
Color
2021-08-06
3 months
Current stock price Evaluation
Stock price rise
probability score
Investment opinion Prospective purchase amount
6,110 W High price 38.7 Normal 3,500,000 W
Suggested Purchase
Amount 1,176,669 W
Number of stocks
purchased 193
Indication price Range Buying / Selling Buying / Selling [Stocks]
High price 4,049 W 4,049 W~ ~ 3,627 W -34 % 396,963 W 98
High mid 3,627 W 3,627 W ~ 3,205 W -41 % 478,214 W 132
Mid 3,205 W 3,205 W ~ 2,783 W -48 % 559,464 W 175
Low mid 2,783 W 2,783 W ~ 2,361 W -54 % 640,715 W 230
low price 2,361 W 2,361 W ~ 0 W -61 % 721,966 W 306
Stock price rise
probability score
A Sector 45.5 51.8 45.2 47.5 53.8 52.8
38.7
B Sector 35.4 32.5 43.8 47.5 30.4 46.3
Total average
2021.03.16 2021.04.13 2021.05.12 2021.06.10 2021.07.08 2021.08.05
40.5 42.2 44.5 23.8 42.1 49.5
44 % 15 %
2021.04.13 2021.05.12 2021.06.10 2021.07.08 2021.08.05
Total of
increase rate
Total score
A Sector 12 % -15 % 5 % 12 % -2 %
-4 % 51.0
B Sector -9 % 26 % 8 % -56 % 34 %
Total average 4 % 5 % -87 %
46
52
45 48
54 53
35
33
44
48
30
46
40 42 44
24
42
50
0
10
20
30
40
50
60
2021.03.16 2021.04.13 2021.05.12 2021.06.10 2021.07.08 2021.08.05
Stock price rise probability score
A sector
B sector
Total average
12%
-15%
5%
12%
-2%
-9%
26%
8%
-56%
34%
4% 5%
-87%
44%
15%
-100%
-80%
-60%
-40%
-20%
0%
20%
40%
60%
2021.04.13 2021.05.12 2021.06.10 2021.07.08 2021.08.05
Increase rate of stock price rise
A sector
B sector
Total average
samt](https://image.slidesharecdn.com/samt031330algorithminvestmentreport-210806015312/85/samt-031330-Algorithm-Investment-Report-2-320.jpg)

This document provides a summary of financial and stock performance data for a company over several quarters and years. It also includes an analysis of the company's current stock price compared to an indicated price range, recommendations to purchase stock if the price is within certain thresholds of the indicated range, and charts tracking the company's stock price increase probability and rates over time. The analysis aims to help investors determine if and when to purchase this company's stock.


![[더즌]dozn 462860 Algorithm Investment Report](https://cdn.slidesharecdn.com/ss_thumbnails/dozn462860algorithminvestmentreport-250920161038-b31c0a65-thumbnail.jpg?width=640&height=640&fit=bounds)


![[헥토파이낸셜]hectofinancial 234340 Algorithm Investment Report](https://cdn.slidesharecdn.com/ss_thumbnails/hectofinancial234340algorithminvestmentreport-250917010057-0603ecf0-thumbnail.jpg?width=640&height=640&fit=bounds)

![[동서]dongsuh 026960 Algorithm Investment Report](https://cdn.slidesharecdn.com/ss_thumbnails/dongsuh026960algorithminvestmentreport-251001020056-e986a251-thumbnail.jpg?width=640&height=640&fit=bounds)

![[ls머트리얼즈]LS Materials 417200 Algorithm Investment Report](https://cdn.slidesharecdn.com/ss_thumbnails/lsmaterials417200algorithminvestmentreport-260202182715-66072c7b-thumbnail.jpg?width=640&height=640&fit=bounds)
![[롯데웰푸드]lottewell food 280360 Algorithm Investment Report](https://cdn.slidesharecdn.com/ss_thumbnails/lottewellfood280360algorithminvestmentreport-251010014427-e0439c3a-thumbnail.jpg?width=640&height=640&fit=bounds)
![[동원산업]dongwon industries 006040 Algorithm Investment Report](https://cdn.slidesharecdn.com/ss_thumbnails/dongwonindustries006040algorithminvestmentreport-251003020532-5dd00f8a-thumbnail.jpg?width=640&height=640&fit=bounds)


![[쿠콘]coocon 294570 Algorithm Investment Report](https://cdn.slidesharecdn.com/ss_thumbnails/coocon294570algorithminvestmentreport-250926162409-bd6c1593-thumbnail.jpg?width=640&height=640&fit=bounds)
![[웹케시]webcash 053580 Algorithm Investment Report](https://cdn.slidesharecdn.com/ss_thumbnails/webcash053580algorithminvestmentreport-250925003052-f31dd73c-thumbnail.jpg?width=640&height=640&fit=bounds)
![[휴림로봇]hyulimrobot 090710 Algorithm Investment Report](https://cdn.slidesharecdn.com/ss_thumbnails/hyulimrobot090710algorithminvestmentreport-250923234005-7edfe548-thumbnail.jpg?width=640&height=640&fit=bounds)


![[한국공항]Korea Airport Service 005430 Algorithm Investment Report](https://cdn.slidesharecdn.com/ss_thumbnails/koreaairportservice005430algorithminvestmentreport-250915064019-e6873549-thumbnail.jpg?width=640&height=640&fit=bounds)
![[대상]Daesang 001680 Algorithm Investment Report](https://cdn.slidesharecdn.com/ss_thumbnails/daesang001680algorithminvestmentreport-250915063303-81c41298-thumbnail.jpg?width=640&height=640&fit=bounds)
![[삼성중공업] Samsung Heavy Industries 010140 Algorithm Investment Report](https://cdn.slidesharecdn.com/ss_thumbnails/samsungheavyindustries010140algorithminvestmentreport-250904015122-fe022f35-thumbnail.jpg?width=640&height=640&fit=bounds)
![대상 001680 알고리즘 기업분석 보고서 [알고리즘 기업분석 컨설팅-알기컨]](https://cdn.slidesharecdn.com/ss_thumbnails/001680-250303132112-443c504a-thumbnail.jpg?width=640&height=640&fit=bounds)
![[삼성전자]samsung electronics 005930 Algorithm Investment Report](https://cdn.slidesharecdn.com/ss_thumbnails/samsungelectronics005930algorithminvestmentreport-250227014600-4fa86dc7-thumbnail.jpg?width=640&height=640&fit=bounds)
![[동서]dongsuh 026960 Algorithm Investment Report](https://cdn.slidesharecdn.com/ss_thumbnails/dongsuh026960algorithminvestmentreport-250226011658-61b0afaa-thumbnail.jpg?width=640&height=640&fit=bounds)
![동원fnb 049770 알고리즘 기업분석 보고서 [알고리즘 기업분석 컨설팅-알기컨]](https://cdn.slidesharecdn.com/ss_thumbnails/fnb049770-250224032312-db728faf-thumbnail.jpg?width=640&height=640&fit=bounds)
![[SFA반도체]SFA semicon 036540 Algorithm Investment Report](https://cdn.slidesharecdn.com/ss_thumbnails/sfasemicon036540algorithminvestmentreport-250219022804-aa8f2510-thumbnail.jpg?width=640&height=640&fit=bounds)


