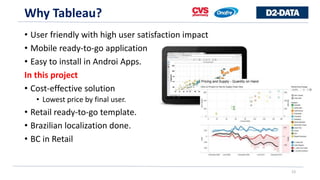
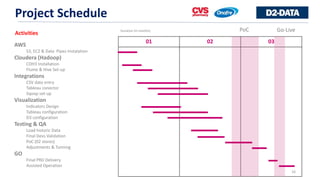
Hadoop running on Retail Business
1
Author: Douglas Bernardini
Onofre Profile
2
• Onofre: CVS Brazil´s operations.
• Pharmacy network 50 stores.
• 2100 employees
• 01 distribuition center
• 37% sales thru e-commerce
• 25% thru mobile/tablet
• CallCenter: 201 positions
• No omni-channel process.
IT perspective
3
• SAP/ECC IS Retail as a central component
• SAP/BObjects: Limited licences per users
• Just finantial team
• POS/System legacy: Cobol
• Okidata/Itautec
• Ecommerce legacy: Vanroy
• .NET customized solution
• 100% datacenter operation internal
• No outsourcing
• No Cloud Services
SAP/System landscape
4
Case: Sales Performance Info
5
• No mobile for sales report: Just
desktop access.
• No friendly & resumed dashboard
• +1 day delay: Todahy sales just from
yesterday.
• Slow performance: More than 1
minute per report
• E-commerce
• No sales result by region
• No compete conversion rate report
• Main Physical store needs
• No sales loss caused by stock-rupture
Project ‘WEB Pharma’
6
• Objectives
• Make user-fliendly dashboard with main business retail decision info.
• Be mobile!. Users must use dashboard remotly using internet devices.
• Ecommerce & Physical stores resume sales toghether
• All reports must be delivered in less than 10s
• Strategy
• Export legacy data for a external-cloud dataserver. (No use internal datacenter)
• Data-streaming must process data from last 1 hour sales.
• Premisses
• 100% secure connection (SOX complience)
• Low CAPEX & limited budget
• 03 months deadline.
Big Data Architecture
7
Brick&Mortar Store
E-commerce (WEB)
Vanroy
.NET
Cobol
Okidata
.csv
.csv
Data
Pipe
Data
Integrator
Apache
Flume
MapReduce
HDFS
User
Interface
Apache
Flume
Workflow
Scheduling
Apache
Oozie
CDH3
Hbase
HiveSQL
Tableau Connector
Sqoop
Tableau OnLine
D3 Visualization
SSH
SSH
MySQL/S3
BI x Big Data: Comparison
8
Business Intelligence Big Data
Volume Terabytes Petabytes
Velocity Batch, Real-Time, Near RT Streams
Data Source Internal ExternalValue One single font of true Statistical and hypothetical
Variety Single sources Probabilistic and multi-factor
Data sharpness Consistent and reliable
Better to be roughly right than precisely
wrong
Frequency Millions of records per minute Billions of documents per second
Master Data Important part of results Not necessary
Servers Sizing
Evolution planned. Could be done internally.
Elastic Cloud considered an alternative.
Storage/memory growing faster than ever.
Elastic Cloud is crucial.
BI x Big Data: Comparison
9
Business Intelligence Big Data
Main Business
Objective
Business Monitoring, internal insights and
process optimization
Data monetization, business metamorphosis
and new opportunities
Object of analysis Current business process Non existent business process
Data Source Internal ExternalApproach
Reactive. What happened and lets see what
we can do?
Predictive. What will happen tomorrow and
lets be prepared?
Mindset
Examine the data and find the problem root
causes, proposing process optimization
How we can make some REAL money with
this data?
Data sharpness Consistent and reliable
Better to be roughly right than precisely
wrong
Scope 02 or 03 departments Intire company cross departments
Business Model Benchmark pre-existent No benchmark
View Modeling
Pre concepted KPI already
pre-formatted
No idea what exactly the objective and
business needs
Why AWS?
10
• Ready to GO cloud services;
• Scalable;
• Cost-Effective;
In this project
• Ready Secure Internet connection (SSH)
• S3: Simple web services interface
• EC2: Linux CentOS ready to go template.
• Cloudera Partner
• Pipeline: Reliably process and move data between different AWS
compute and storage services
Server Highlights
11
• 21.5 TB historic data (03 years)
• Risk: Poor data-transfer network
• AWS Import/Export Snowball
Data
• Data transfer Estimate> 140MB per
data-package
• 200 package/day: 28GB/DAY
PRD Server config
• RedHat 6.4, 256GB of RAM,
• Processor: 4 x 12 Cores – 5Ghz
• 2x420 storage (10G)
Users
• 350 users
• 50 stores
• 40MB/day each
Network Bandwidth
• Inbound:
• 5Gb
• Outbound:
• 10Gb
Hadoop Highlights
12
• Objective: Fast response for final users
• Masternodes> 01 (*)
• SlaveNodes > 07
• Sqoop: Hadoop native connector >
MySQL
• Hue: SQLlike soft UI for DBA for data-
validation.
• Oozie: Scheduler system to manage
Hadoop jobs.
• triggered by time (frequency) and data
availability.
• Hive: Querying large datasets.
• SQL-like language: HiveQL.
(*) Modified after go-live
Why Cloudera?
13
• Stable Hadoop distribuition
• Simple admin: Cloudera Manager
• Integraded
In this project
• Tableau ready-to-go connector
• CDH3: Open source (cost-effective)
• Fast installation
• Fast Tunning
Why Tableau?
14
• User friendly with high user satisfaction impact
• Mobile ready-to-go application
• Easy to install in Androi Apps.
In this project
• Cost-effective solution
• Lowest price by final user.
• Retail ready-to-go template.
• Brazilian localization done.
• BC in Retail
Why Not SAP?
15
• High cost in user-licence (Project demands 350 new users)
• SAP/Business objects retail template with Low adherence
• Huge investiment in customized reporting
• Hardware processing concorrence with financial users
• Impact in results monthly closing reporting.
• High investment in hardware instance to get expected performance
• 2013: No AWS instance ready for SAP/BOBJ
• SAP/HANA not mature yet.
• Lack of consultants
• No business case (Retail) running in Brazil
Project Methodology
16
• BI projects: Intensive REAL data validation
• Key-Users must really believe in new indicators (expectations).
• Intense deliverable schudule: Antecipation for Validation
• Minimum project Scope: 10 reports
• 07 standards: Tableau
• 03 Customized: D3 visualization
• 01 Dashboard
• Tableau
• Project implementation Strategy: PoC
• Consistent validation: 02 Stores & 10 users
• Testin with real environment: Consistent Issues Log (performance)
Project Schedule
17
AWS
S3, EC2 & Data Pipes Instalation
Cloudera (Hadoop)
CDH3 Installation
Flume & Hive Set-up
Integrations
CSV data entry
Tableau conector
Sqoop set-up
Visualization
Indicators Design
Tableau configuration
D3 configuration
Testing & QA
Load historic Data
Final Devs Validation
PoC (02 stores)
Adjustments & Tunning
GO
Final PRD Delivery
Assisted Operation
01 02 03
Go-LiveDuration (in months)
Activities
PoC
Project Results
18
• Reponse time: 0,4s
• High adherence from users.
• Data visualization triggers
several bisiness iniciatives
• 2ª wave aproveed with 02
additional dashboards and 32
new reports.
• WEB reports demonstrate
OMNI channel process
struturation & new Business
needs
douglas.bernardini@d2-data.com
Questions?
19

Hadoop on retail

  • 1.
    Hadoop running onRetail Business 1 Author: Douglas Bernardini
  • 2.
    Onofre Profile 2 • Onofre:CVS Brazil´s operations. • Pharmacy network 50 stores. • 2100 employees • 01 distribuition center • 37% sales thru e-commerce • 25% thru mobile/tablet • CallCenter: 201 positions • No omni-channel process.
  • 3.
    IT perspective 3 • SAP/ECCIS Retail as a central component • SAP/BObjects: Limited licences per users • Just finantial team • POS/System legacy: Cobol • Okidata/Itautec • Ecommerce legacy: Vanroy • .NET customized solution • 100% datacenter operation internal • No outsourcing • No Cloud Services
  • 4.
  • 5.
    Case: Sales PerformanceInfo 5 • No mobile for sales report: Just desktop access. • No friendly & resumed dashboard • +1 day delay: Todahy sales just from yesterday. • Slow performance: More than 1 minute per report • E-commerce • No sales result by region • No compete conversion rate report • Main Physical store needs • No sales loss caused by stock-rupture
  • 6.
    Project ‘WEB Pharma’ 6 •Objectives • Make user-fliendly dashboard with main business retail decision info. • Be mobile!. Users must use dashboard remotly using internet devices. • Ecommerce & Physical stores resume sales toghether • All reports must be delivered in less than 10s • Strategy • Export legacy data for a external-cloud dataserver. (No use internal datacenter) • Data-streaming must process data from last 1 hour sales. • Premisses • 100% secure connection (SOX complience) • Low CAPEX & limited budget • 03 months deadline.
  • 7.
    Big Data Architecture 7 Brick&MortarStore E-commerce (WEB) Vanroy .NET Cobol Okidata .csv .csv Data Pipe Data Integrator Apache Flume MapReduce HDFS User Interface Apache Flume Workflow Scheduling Apache Oozie CDH3 Hbase HiveSQL Tableau Connector Sqoop Tableau OnLine D3 Visualization SSH SSH MySQL/S3
  • 8.
    BI x BigData: Comparison 8 Business Intelligence Big Data Volume Terabytes Petabytes Velocity Batch, Real-Time, Near RT Streams Data Source Internal ExternalValue One single font of true Statistical and hypothetical Variety Single sources Probabilistic and multi-factor Data sharpness Consistent and reliable Better to be roughly right than precisely wrong Frequency Millions of records per minute Billions of documents per second Master Data Important part of results Not necessary Servers Sizing Evolution planned. Could be done internally. Elastic Cloud considered an alternative. Storage/memory growing faster than ever. Elastic Cloud is crucial.
  • 9.
    BI x BigData: Comparison 9 Business Intelligence Big Data Main Business Objective Business Monitoring, internal insights and process optimization Data monetization, business metamorphosis and new opportunities Object of analysis Current business process Non existent business process Data Source Internal ExternalApproach Reactive. What happened and lets see what we can do? Predictive. What will happen tomorrow and lets be prepared? Mindset Examine the data and find the problem root causes, proposing process optimization How we can make some REAL money with this data? Data sharpness Consistent and reliable Better to be roughly right than precisely wrong Scope 02 or 03 departments Intire company cross departments Business Model Benchmark pre-existent No benchmark View Modeling Pre concepted KPI already pre-formatted No idea what exactly the objective and business needs
  • 10.
    Why AWS? 10 • Readyto GO cloud services; • Scalable; • Cost-Effective; In this project • Ready Secure Internet connection (SSH) • S3: Simple web services interface • EC2: Linux CentOS ready to go template. • Cloudera Partner • Pipeline: Reliably process and move data between different AWS compute and storage services
  • 11.
    Server Highlights 11 • 21.5TB historic data (03 years) • Risk: Poor data-transfer network • AWS Import/Export Snowball Data • Data transfer Estimate> 140MB per data-package • 200 package/day: 28GB/DAY PRD Server config • RedHat 6.4, 256GB of RAM, • Processor: 4 x 12 Cores – 5Ghz • 2x420 storage (10G) Users • 350 users • 50 stores • 40MB/day each Network Bandwidth • Inbound: • 5Gb • Outbound: • 10Gb
  • 12.
    Hadoop Highlights 12 • Objective:Fast response for final users • Masternodes> 01 (*) • SlaveNodes > 07 • Sqoop: Hadoop native connector > MySQL • Hue: SQLlike soft UI for DBA for data- validation. • Oozie: Scheduler system to manage Hadoop jobs. • triggered by time (frequency) and data availability. • Hive: Querying large datasets. • SQL-like language: HiveQL. (*) Modified after go-live
  • 13.
    Why Cloudera? 13 • StableHadoop distribuition • Simple admin: Cloudera Manager • Integraded In this project • Tableau ready-to-go connector • CDH3: Open source (cost-effective) • Fast installation • Fast Tunning
  • 14.
    Why Tableau? 14 • Userfriendly with high user satisfaction impact • Mobile ready-to-go application • Easy to install in Androi Apps. In this project • Cost-effective solution • Lowest price by final user. • Retail ready-to-go template. • Brazilian localization done. • BC in Retail
  • 15.
    Why Not SAP? 15 •High cost in user-licence (Project demands 350 new users) • SAP/Business objects retail template with Low adherence • Huge investiment in customized reporting • Hardware processing concorrence with financial users • Impact in results monthly closing reporting. • High investment in hardware instance to get expected performance • 2013: No AWS instance ready for SAP/BOBJ • SAP/HANA not mature yet. • Lack of consultants • No business case (Retail) running in Brazil
  • 16.
    Project Methodology 16 • BIprojects: Intensive REAL data validation • Key-Users must really believe in new indicators (expectations). • Intense deliverable schudule: Antecipation for Validation • Minimum project Scope: 10 reports • 07 standards: Tableau • 03 Customized: D3 visualization • 01 Dashboard • Tableau • Project implementation Strategy: PoC • Consistent validation: 02 Stores & 10 users • Testin with real environment: Consistent Issues Log (performance)
  • 17.
    Project Schedule 17 AWS S3, EC2& Data Pipes Instalation Cloudera (Hadoop) CDH3 Installation Flume & Hive Set-up Integrations CSV data entry Tableau conector Sqoop set-up Visualization Indicators Design Tableau configuration D3 configuration Testing & QA Load historic Data Final Devs Validation PoC (02 stores) Adjustments & Tunning GO Final PRD Delivery Assisted Operation 01 02 03 Go-LiveDuration (in months) Activities PoC
  • 18.
    Project Results 18 • Reponsetime: 0,4s • High adherence from users. • Data visualization triggers several bisiness iniciatives • 2ª wave aproveed with 02 additional dashboards and 32 new reports. • WEB reports demonstrate OMNI channel process struturation & new Business needs
  • 19.