Downloaded 37 times


![Event: is a single piece of data, similar to a record in a log file or other data input.
172.26.34.223 - - [01/Jul/2005:12:05:27 -0700] "GET /trade/app?action=logout HTTP/1.1" 200 2953
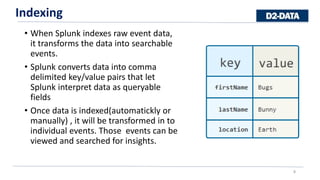
When Splunk indexes data, it breaks up the data into individual pieces and gives each piece:
• Timestamp
• uses to correlate events by time, to create the timeline histogram and to set time ranges for searches
• Host
• hostname, IP address, or domain name of the network host on which the event originated
• Source
• source of an event - where the event originated
• Path of files and directories or network-based
• Source type
• tells Splunk what kind of data it is, so that Splunk can format the data intelligently during indexing (Ex.
access_combined,apache_error)
9
Events
9](https://image.slidesharecdn.com/splunk-151022002752-lva1-app6892/85/Splunk-9-320.jpg)

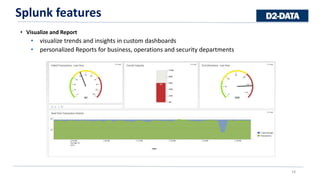
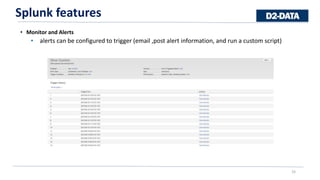


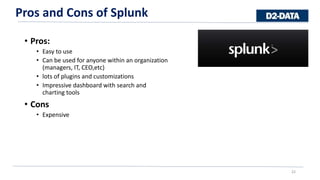


Splunk is a software that captures, indexes, and analyzes machine-generated data in real-time to generate operational intelligence across an organization. It transforms raw data into searchable events that can then be searched, visualized, and used to create reports, alerts, and dashboards. Splunk offers features like searching and investigating data, data modeling and pivoting, visualization and reporting, and monitoring and alerts. It is easy to deploy, load data into, and search and visualize data to gain insights. However, Splunk can be expensive for some organizations.


![[DSC Europe 25] Stefan Brankovic - #ResumeIsDead. AI-Powered Interviews and C...](https://cdn.slidesharecdn.com/ss_thumbnails/qnmbsv0xq3uysdrq3sev-2-stefan-brankovic-job-bolt-260114111931-a065aa3d-thumbnail.jpg?width=640&height=640&fit=bounds)


![[DSC Europe 25] Slobodan Dolinic - Smart and Intelligent Green Region.pptx](https://cdn.slidesharecdn.com/ss_thumbnails/0bribinjsp6ghwtvsvor-2-sigre-slobodan-dolinic-260115093812-c9c10e90-thumbnail.jpg?width=640&height=640&fit=bounds)
![[DSC Europe 25] Dragan Jerosimovic - The Anatomy of a Narrative Simulation.pdf](https://cdn.slidesharecdn.com/ss_thumbnails/vzputuprdqr6zwbrwdcw-1-dragan-jerosimovic-the-anatomy-of-a-narrative-simulation-260114111931-9d04fba2-thumbnail.jpg?width=640&height=640&fit=bounds)
![[DSC Europe 25] Ivica Milaric - The Future of Gaming and AI Tools.pptx](https://cdn.slidesharecdn.com/ss_thumbnails/tijgzsmgse2kj2y5pzzp-5-ivica-milaric-the-future-of-gaming-x-ai-tools-260114111931-87c2b3ac-thumbnail.jpg?width=640&height=640&fit=bounds)
![[DSC Europe 25] Srba Markovic - From Pilot to Production: Overcoming AI Deplo...](https://cdn.slidesharecdn.com/ss_thumbnails/yjjmrtytmwbalxlba7px-4-srba-markovic-from-pilot-to-production-overcoming-ai-deployment-blockers-with-260114111931-4a892d44-thumbnail.jpg?width=640&height=640&fit=bounds)