Download as PDF, PPTX
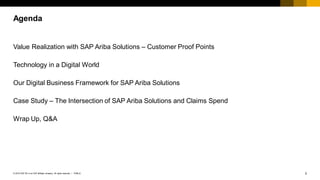


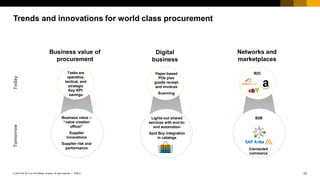
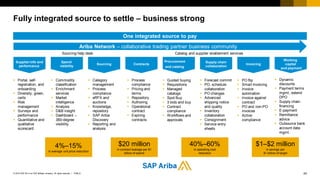


The document discusses value realization with SAP Ariba solutions in financial services, highlighting trends and insights from procurement practices for 2017-2018. Key findings indicate that value trumps sourcing savings, projects are becoming more complex, and automation enhances compliance and operational excellence. It emphasizes the importance of agility and predictive models in enhancing procurement performance while addressing compliance concerns in third-party procurement processes.


![Master Source-to-Pay with Cloud and Business Networks [Stockholm]](https://cdn.slidesharecdn.com/ss_thumbnails/mastersource-to-paywithcloudandbusinessnetworks-151117134630-lva1-app6891-thumbnail.jpg?width=640&height=640&fit=bounds)


