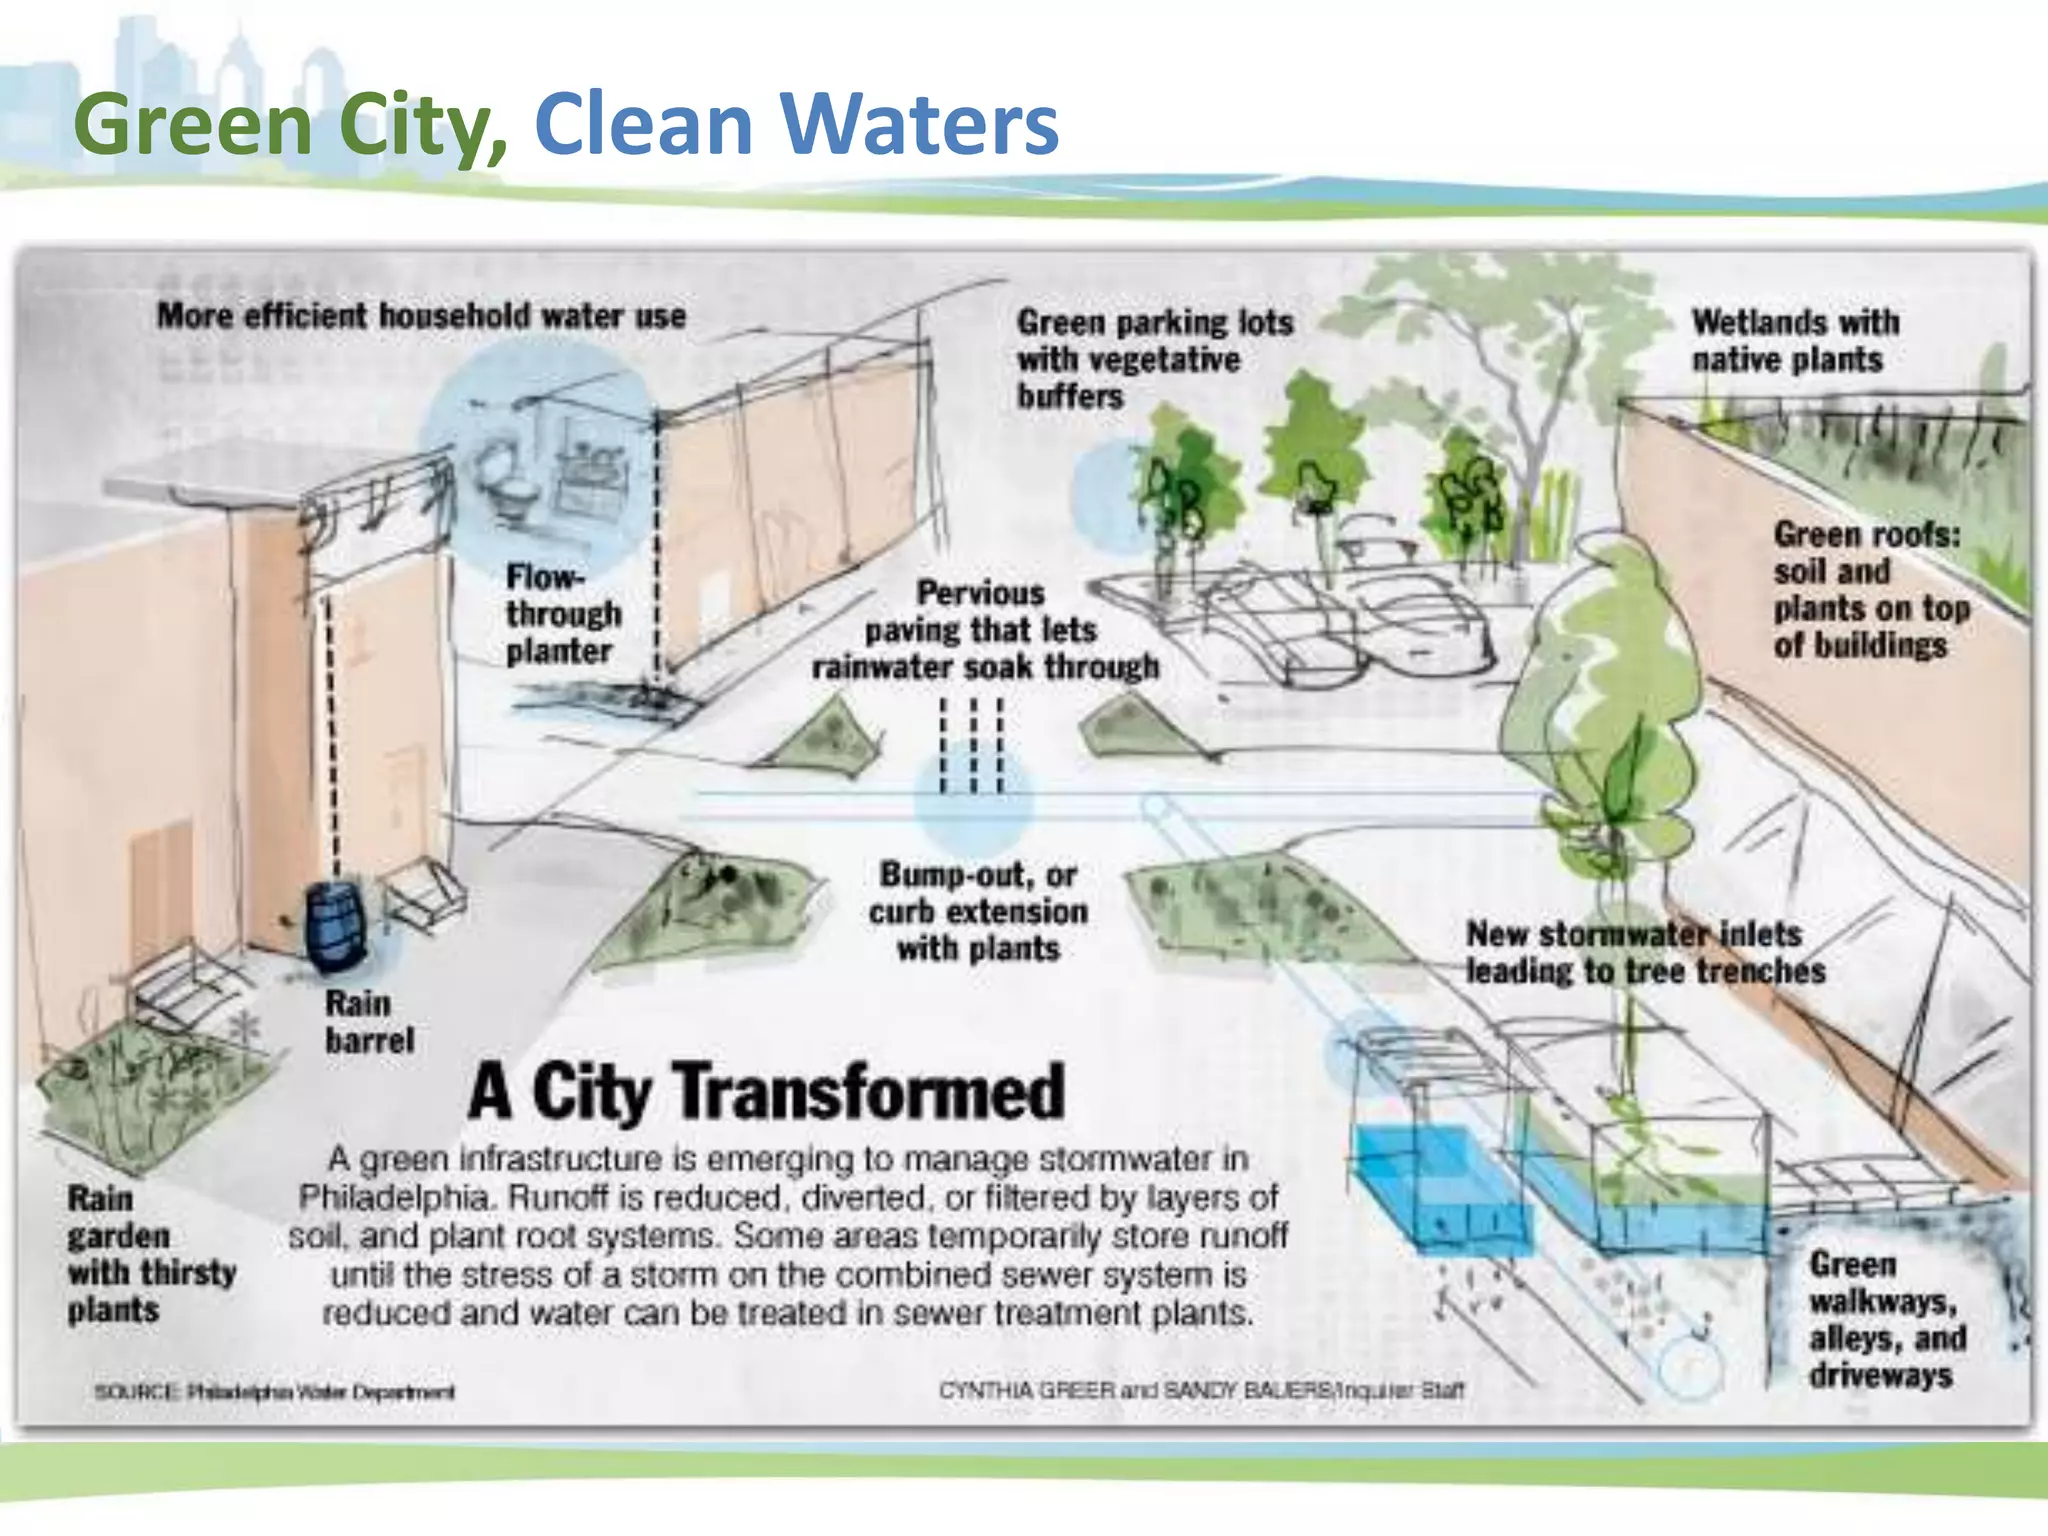
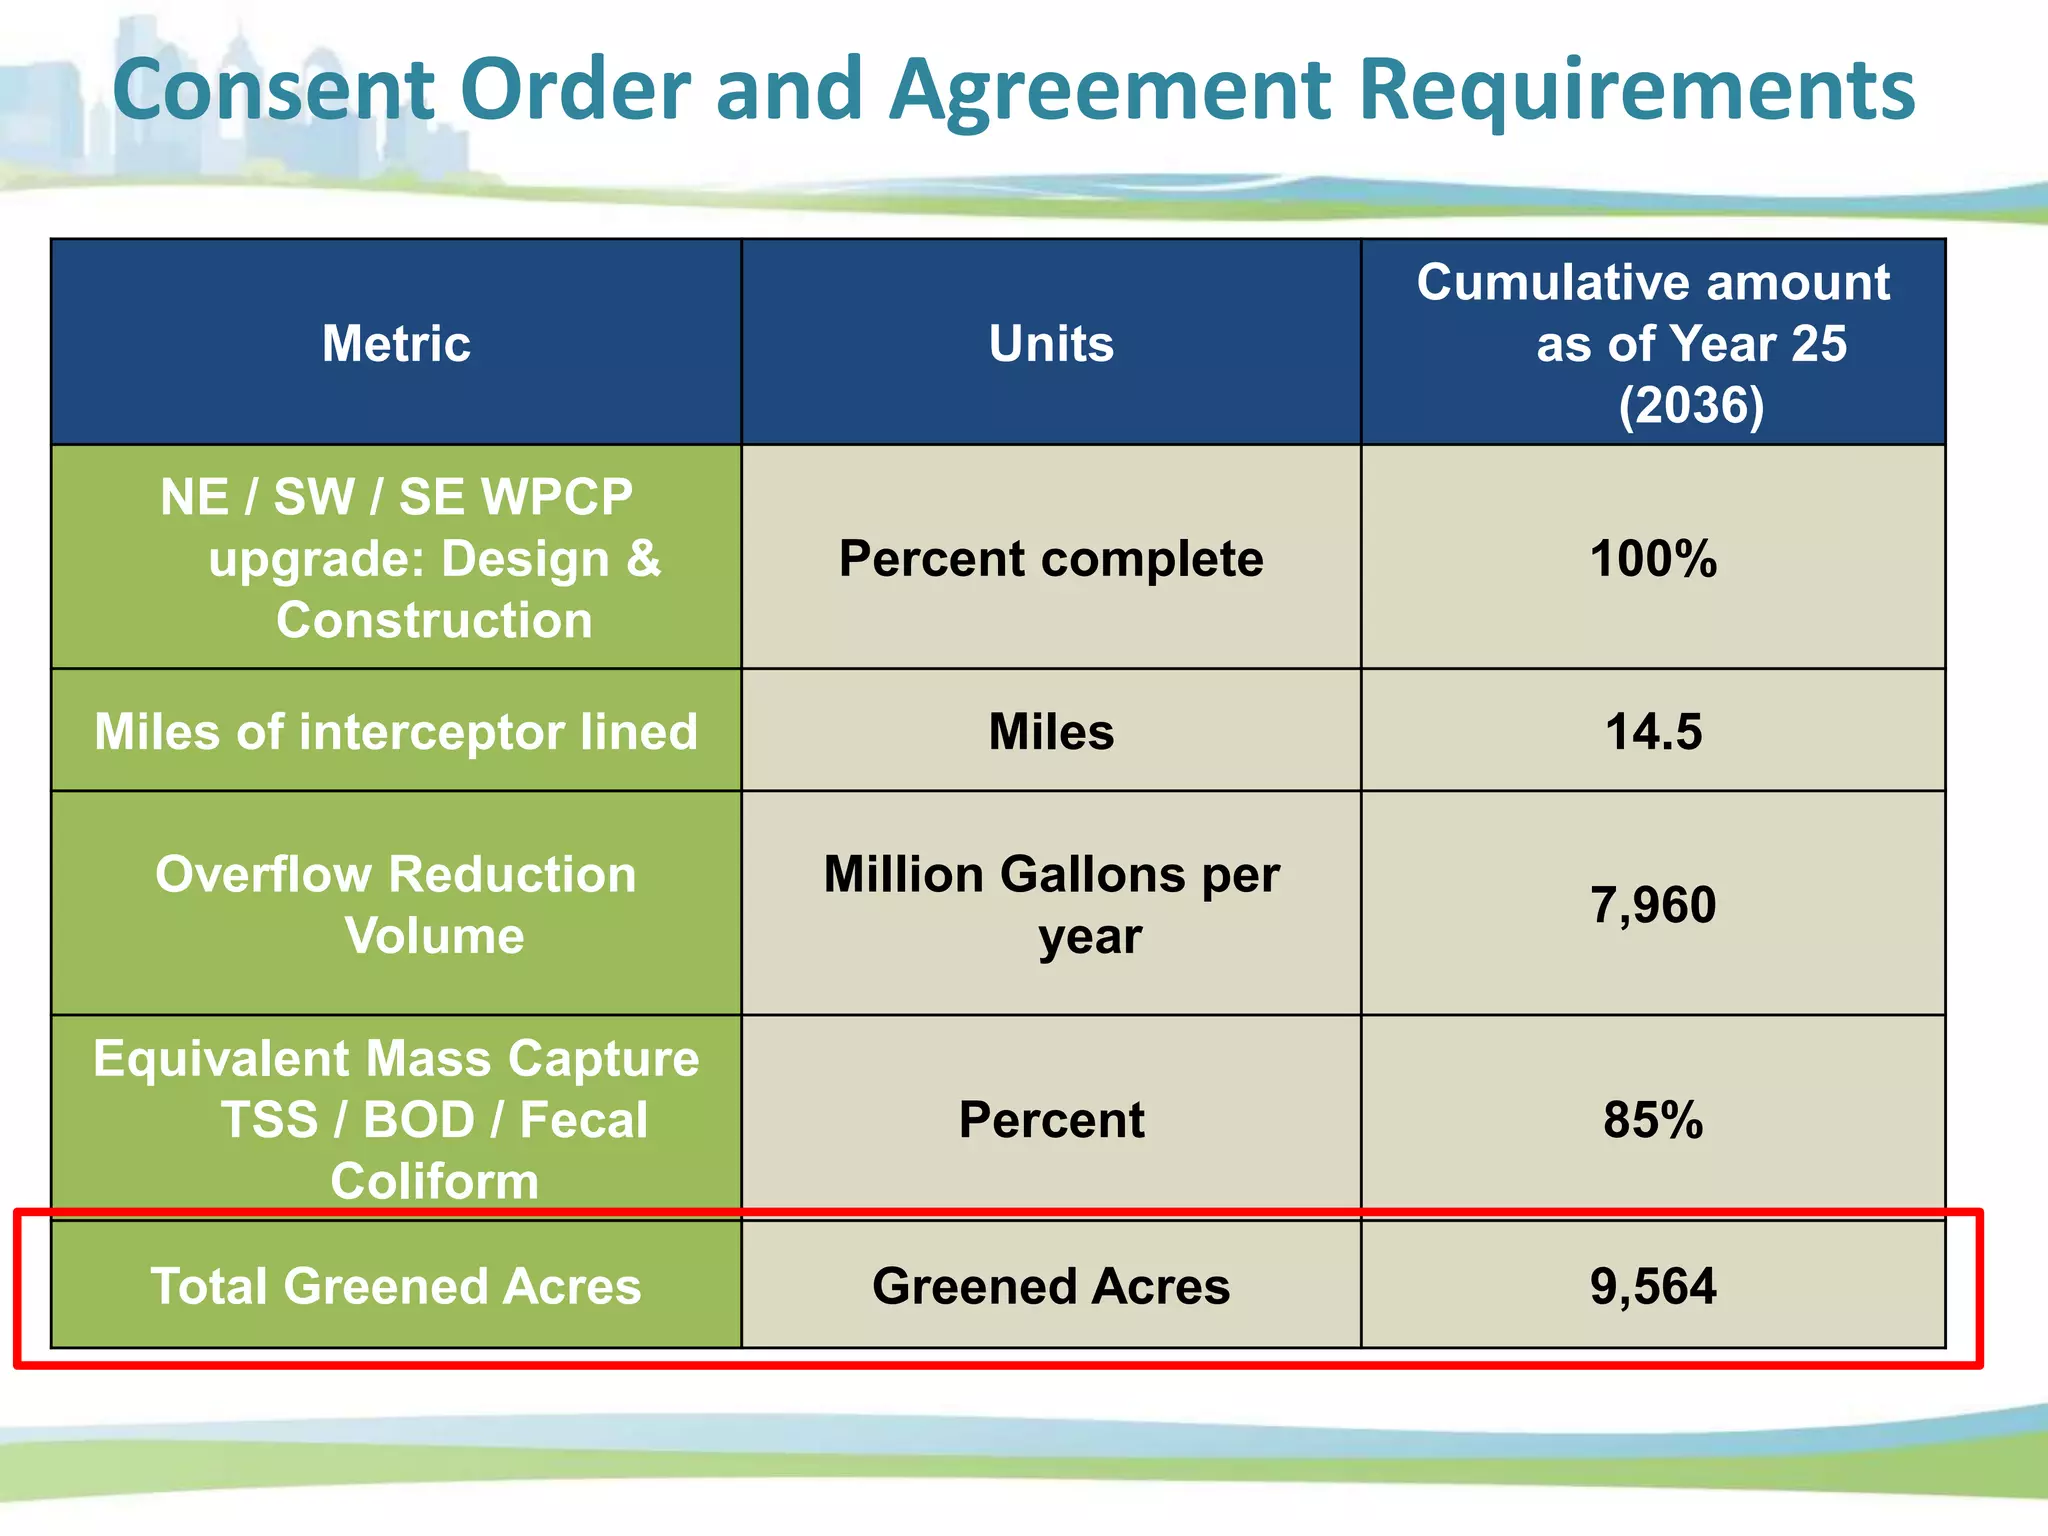
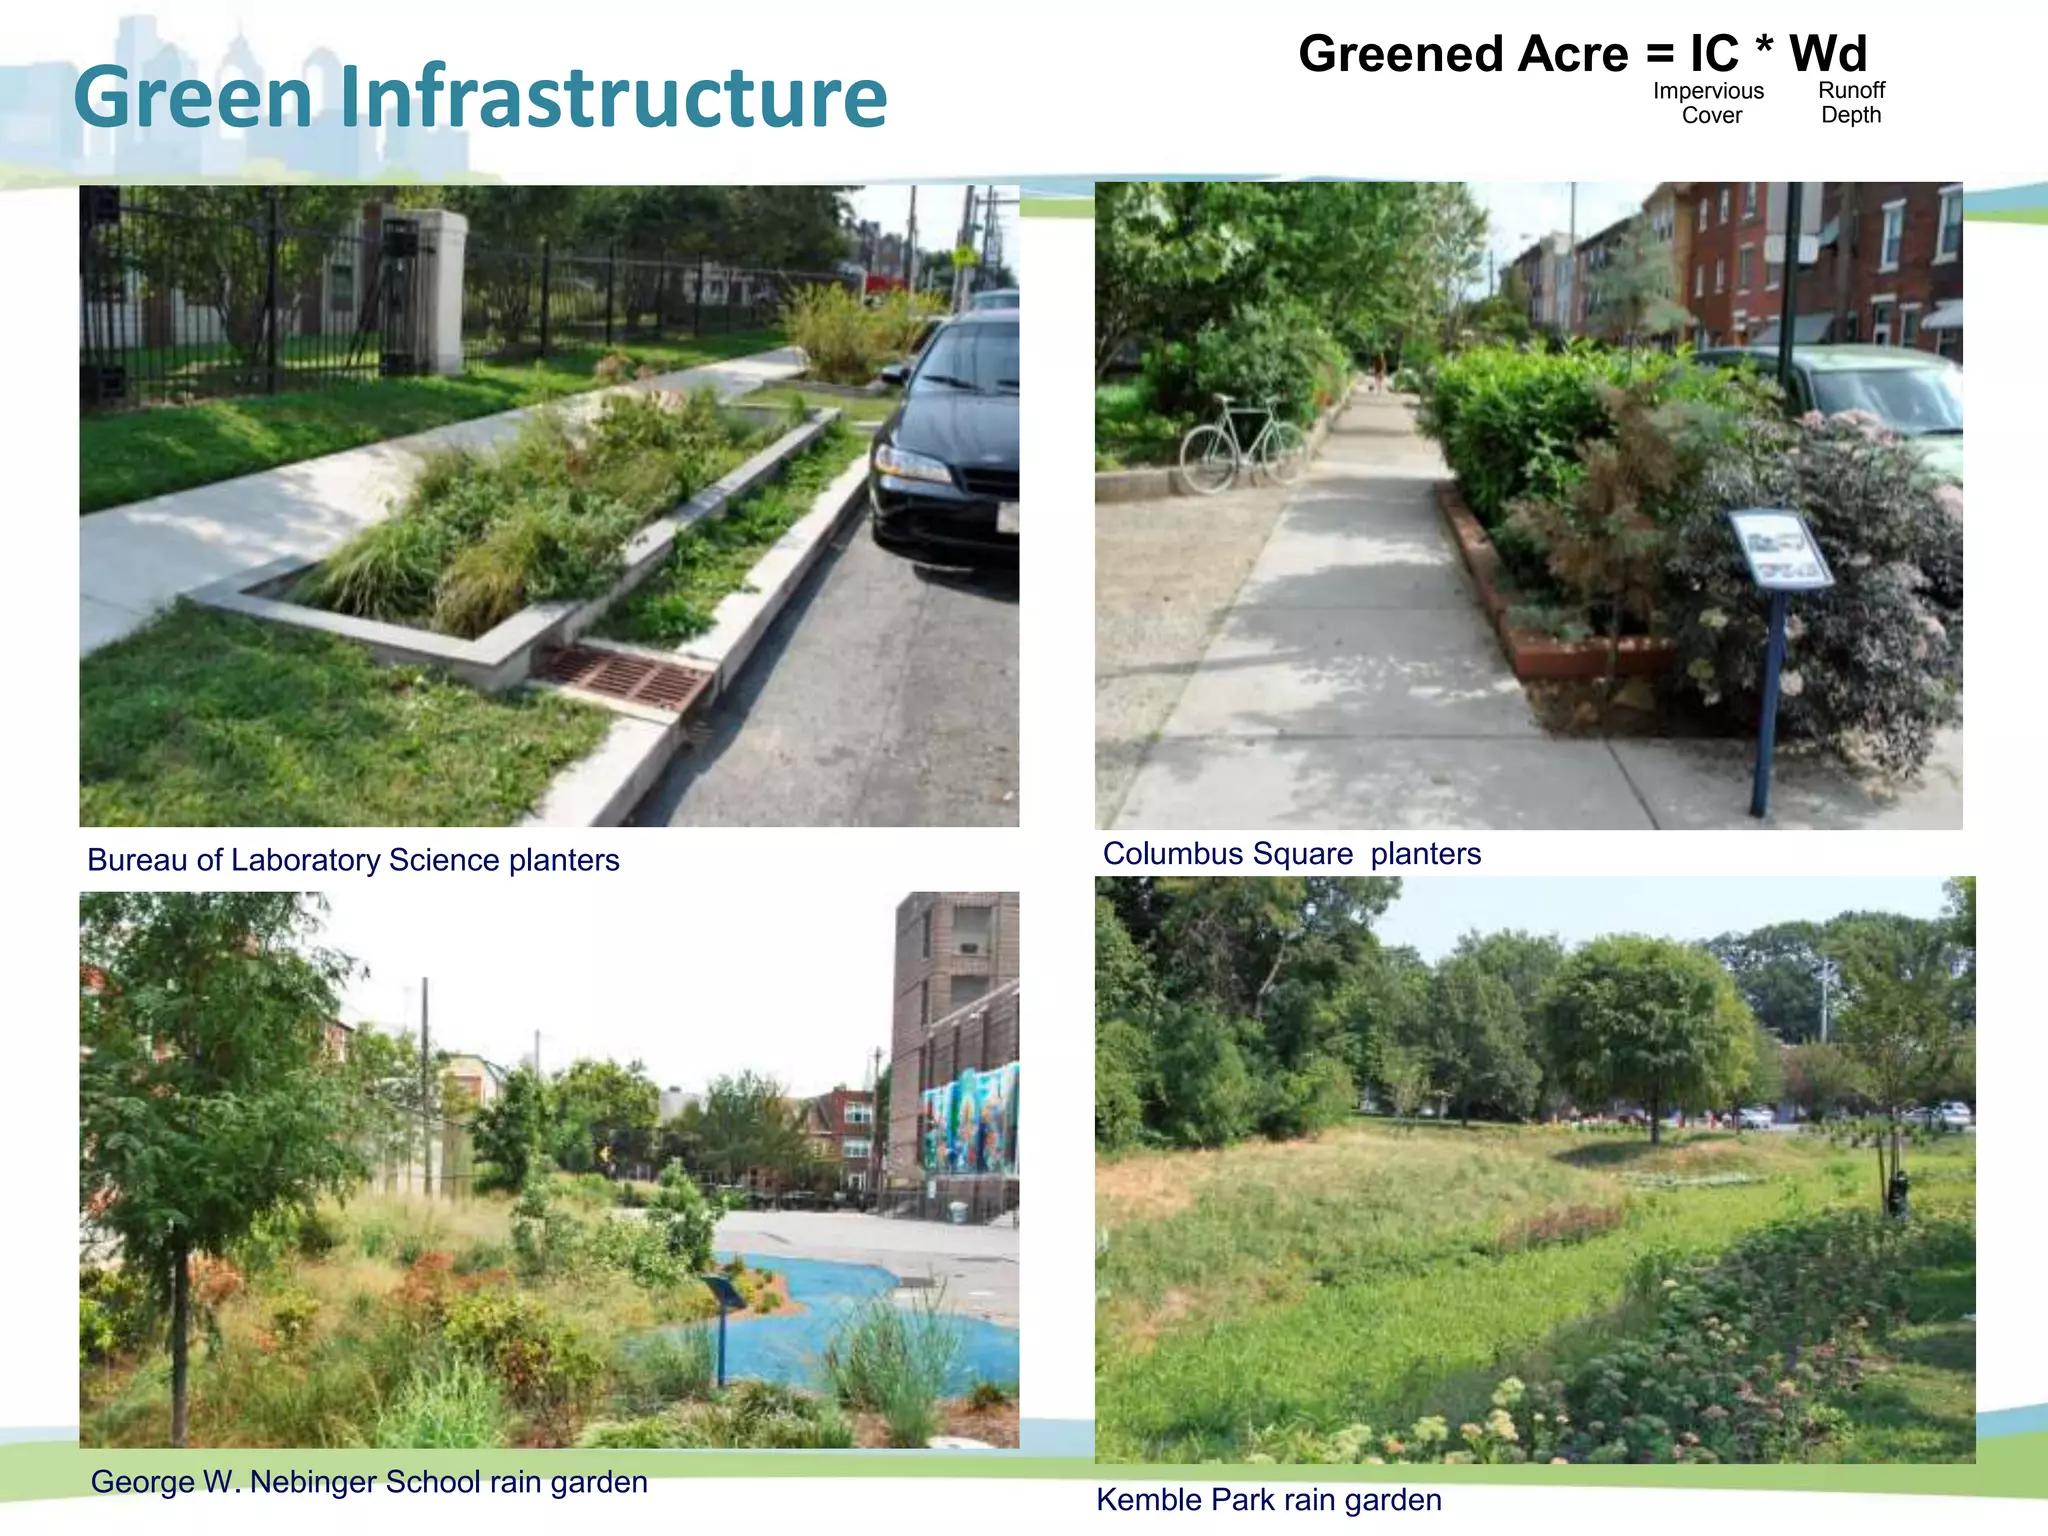
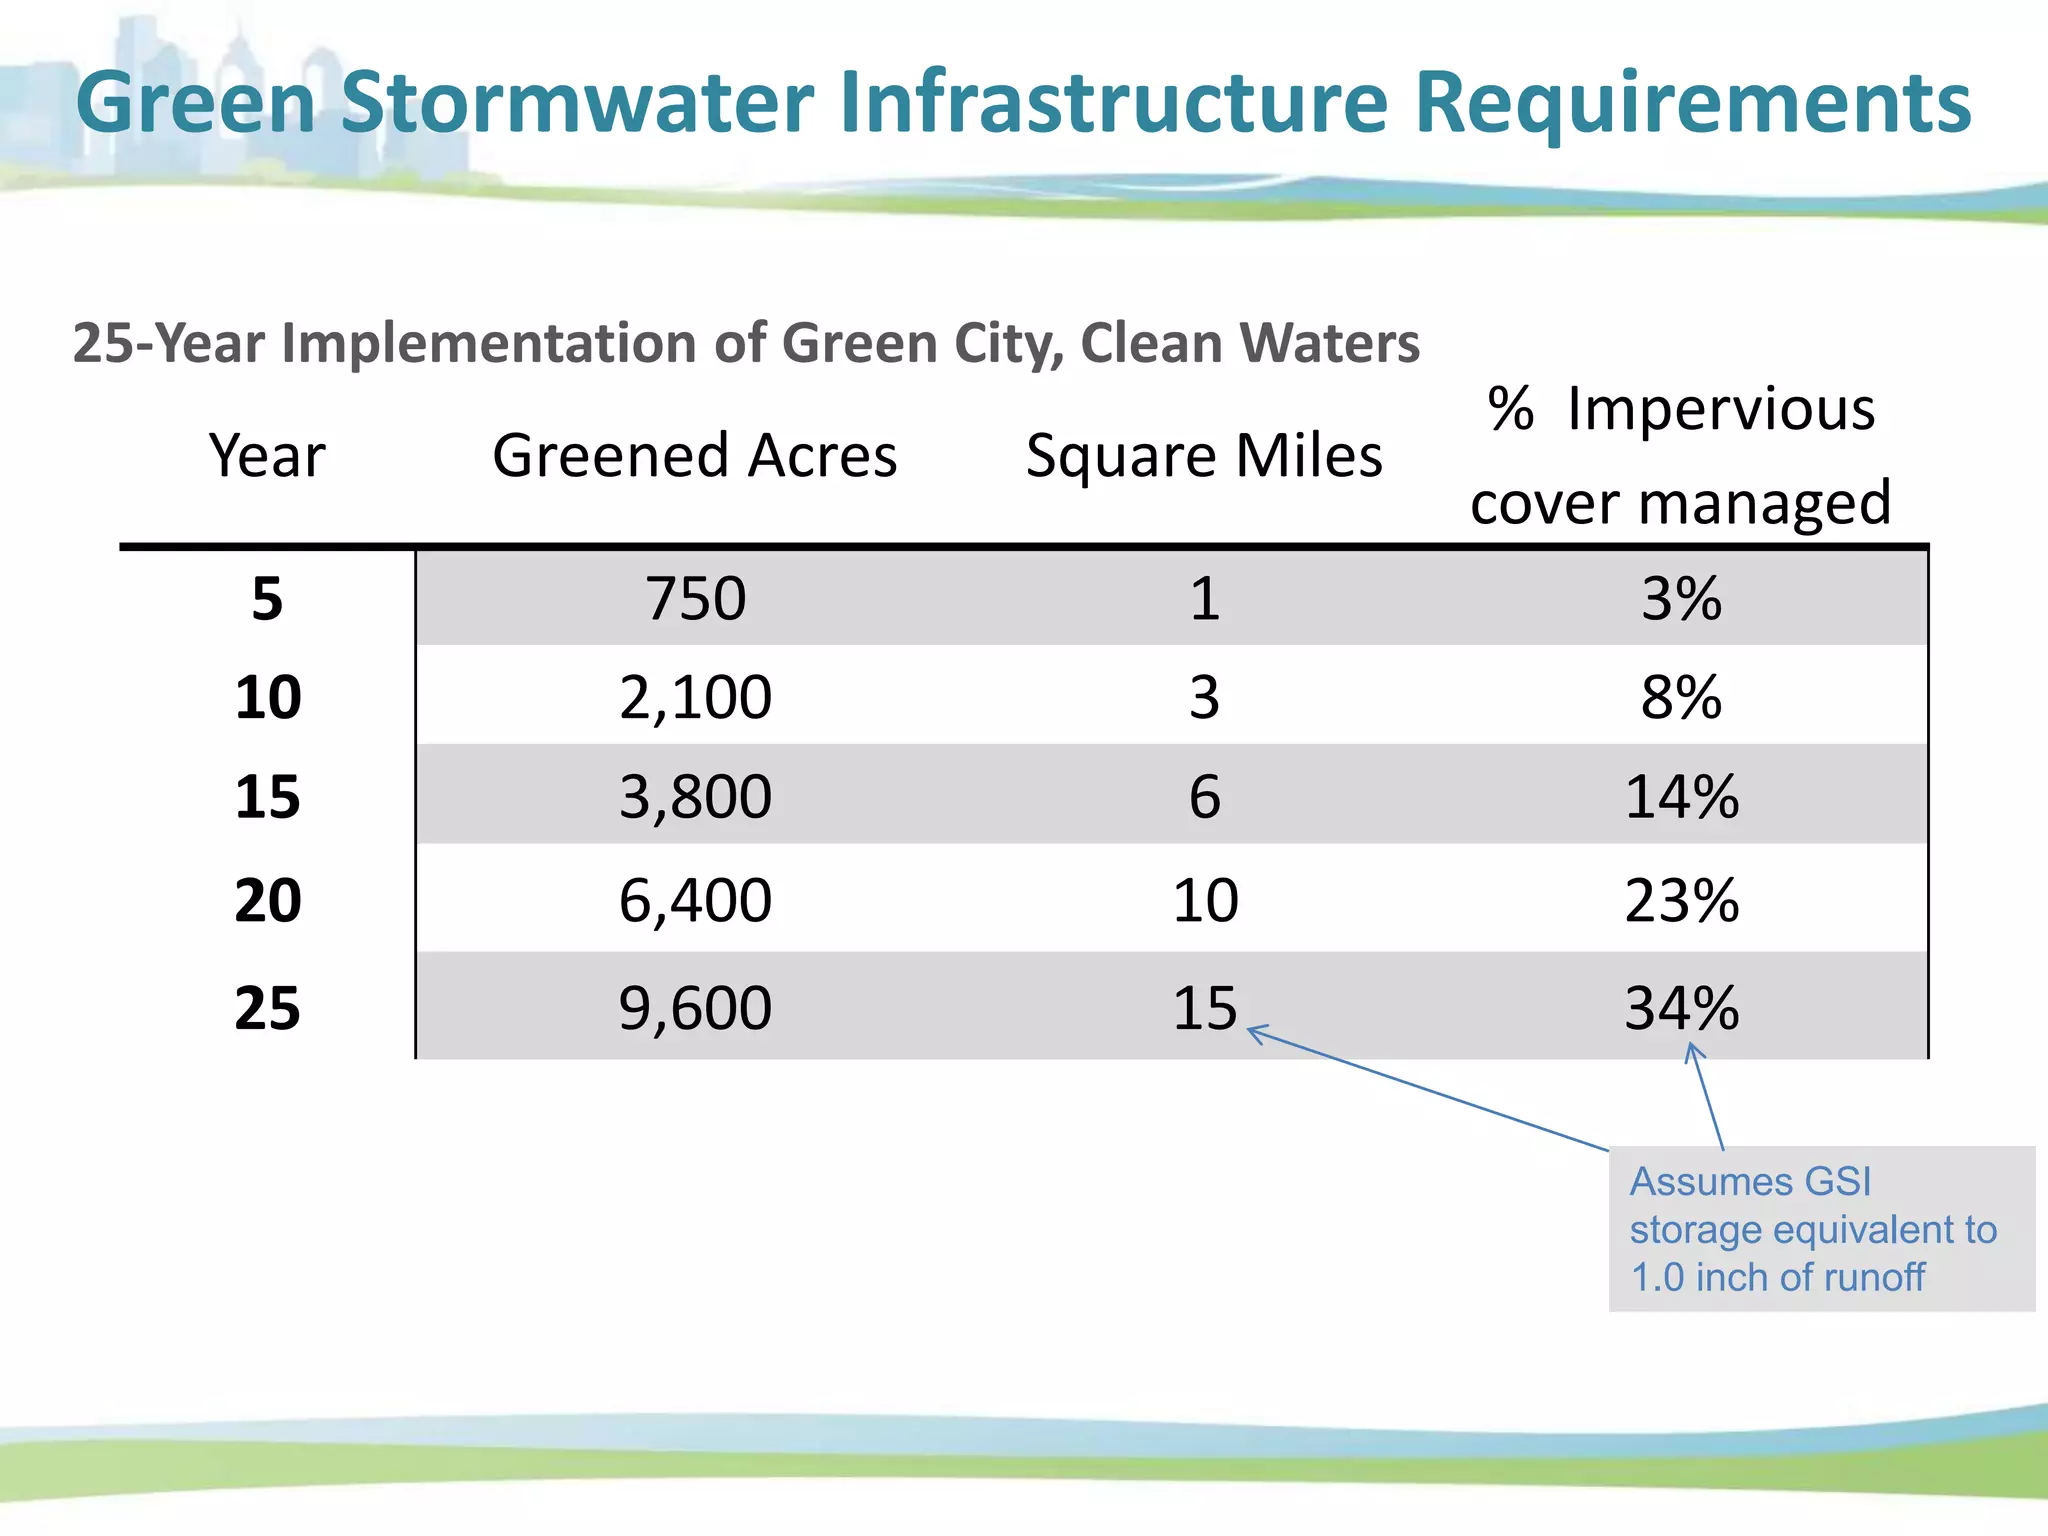
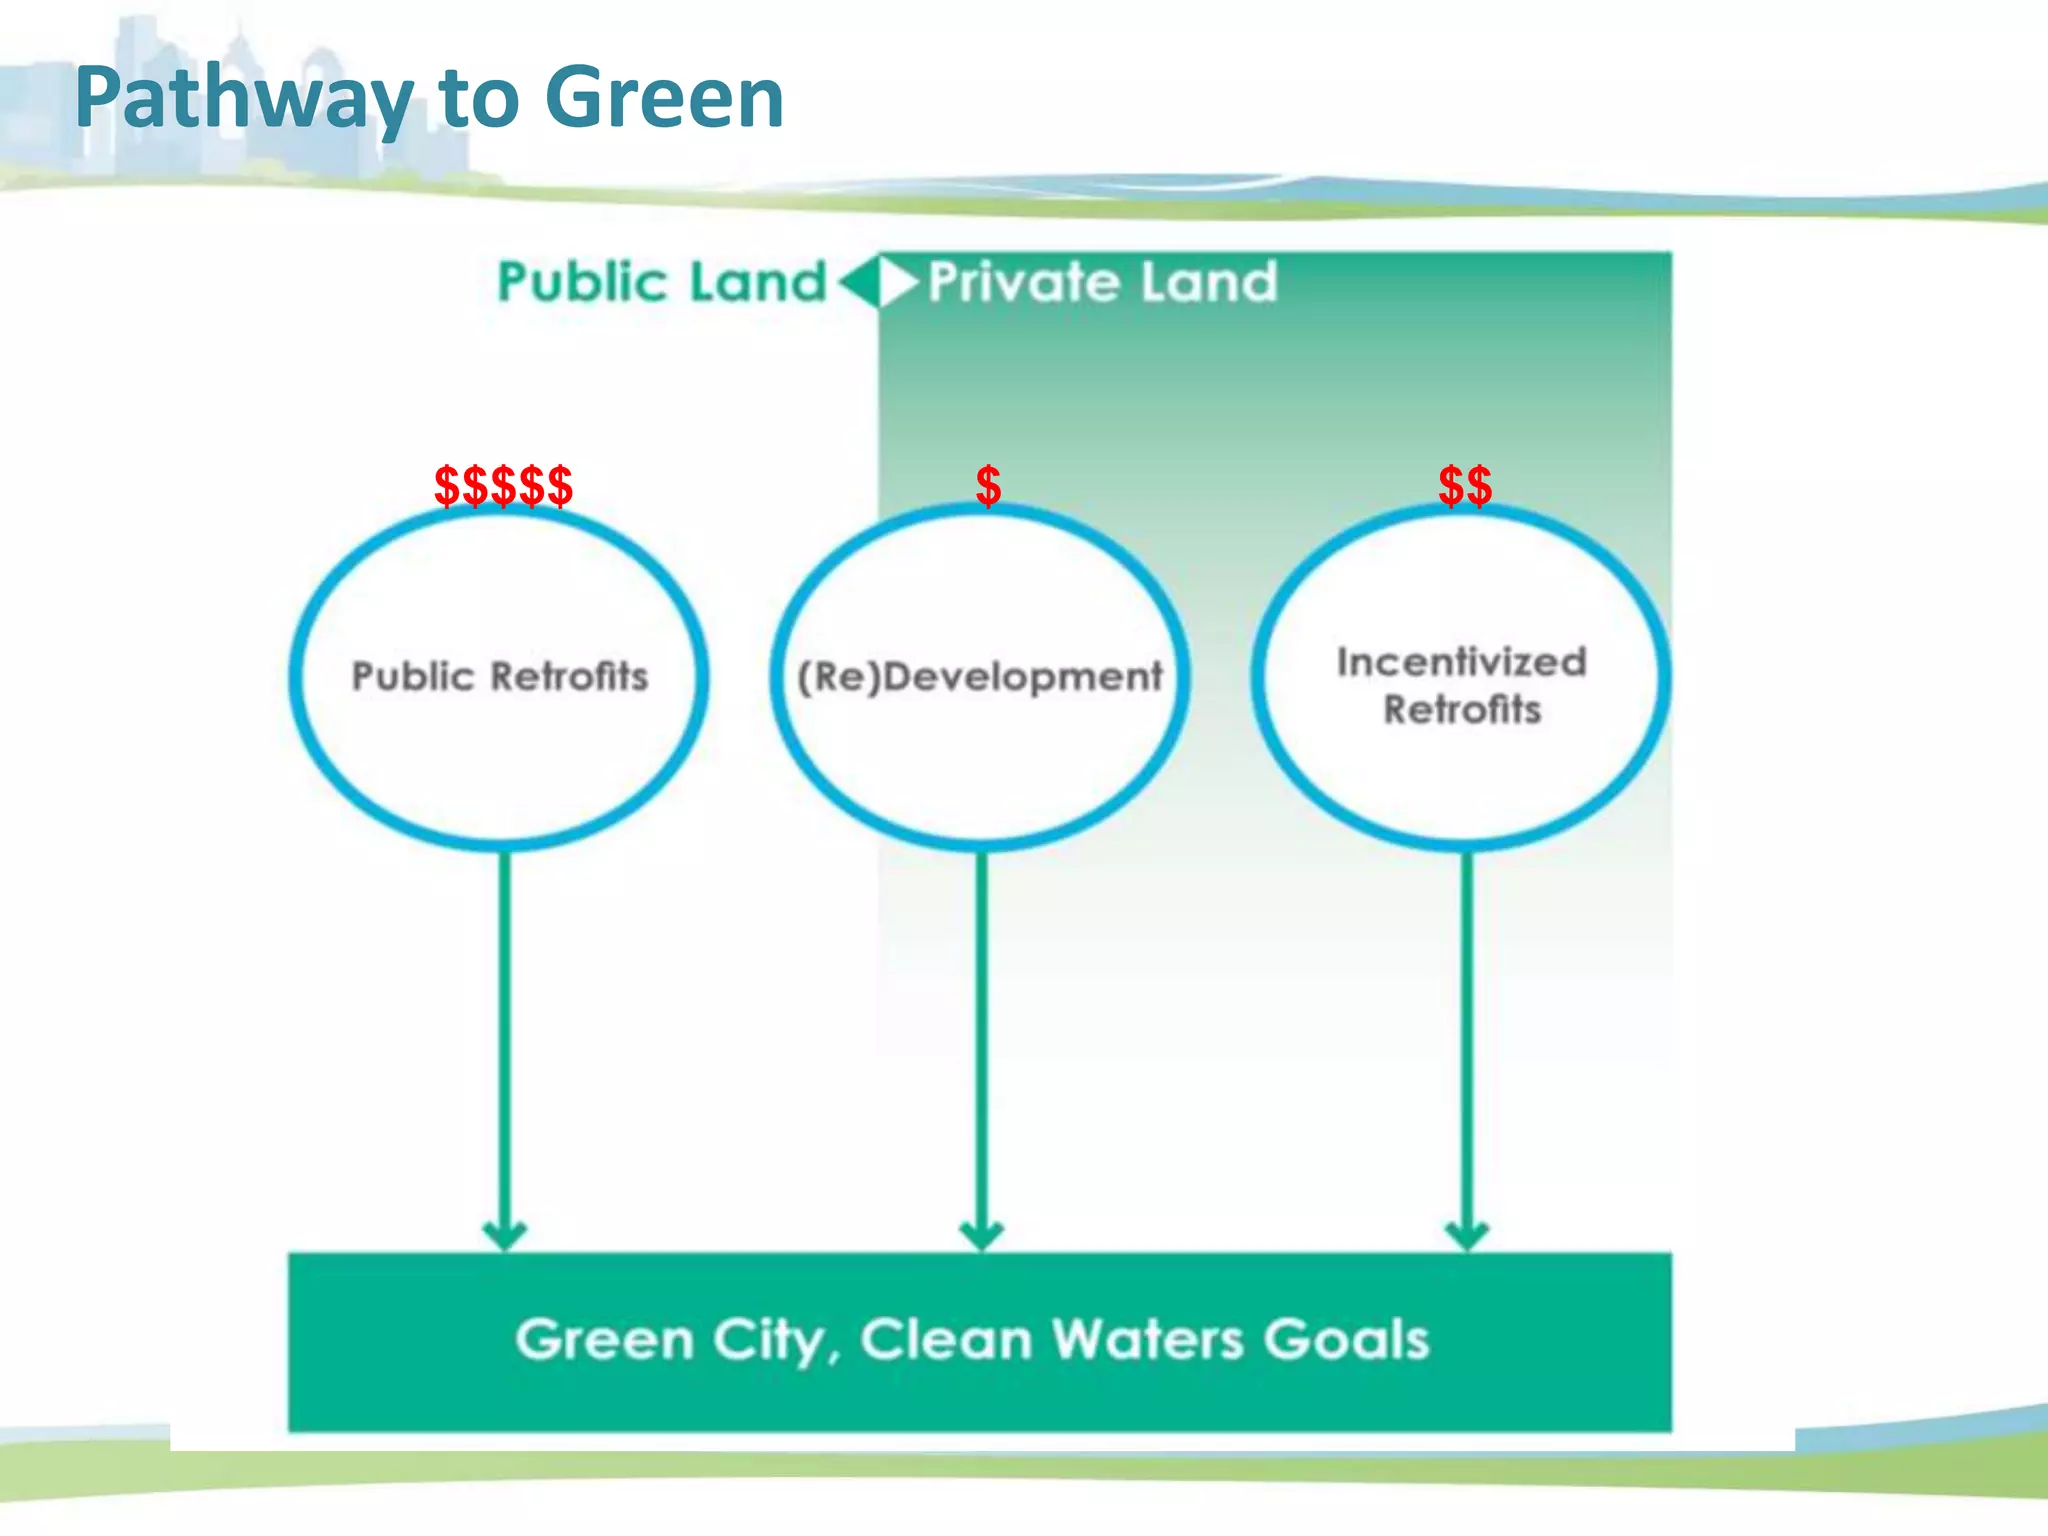
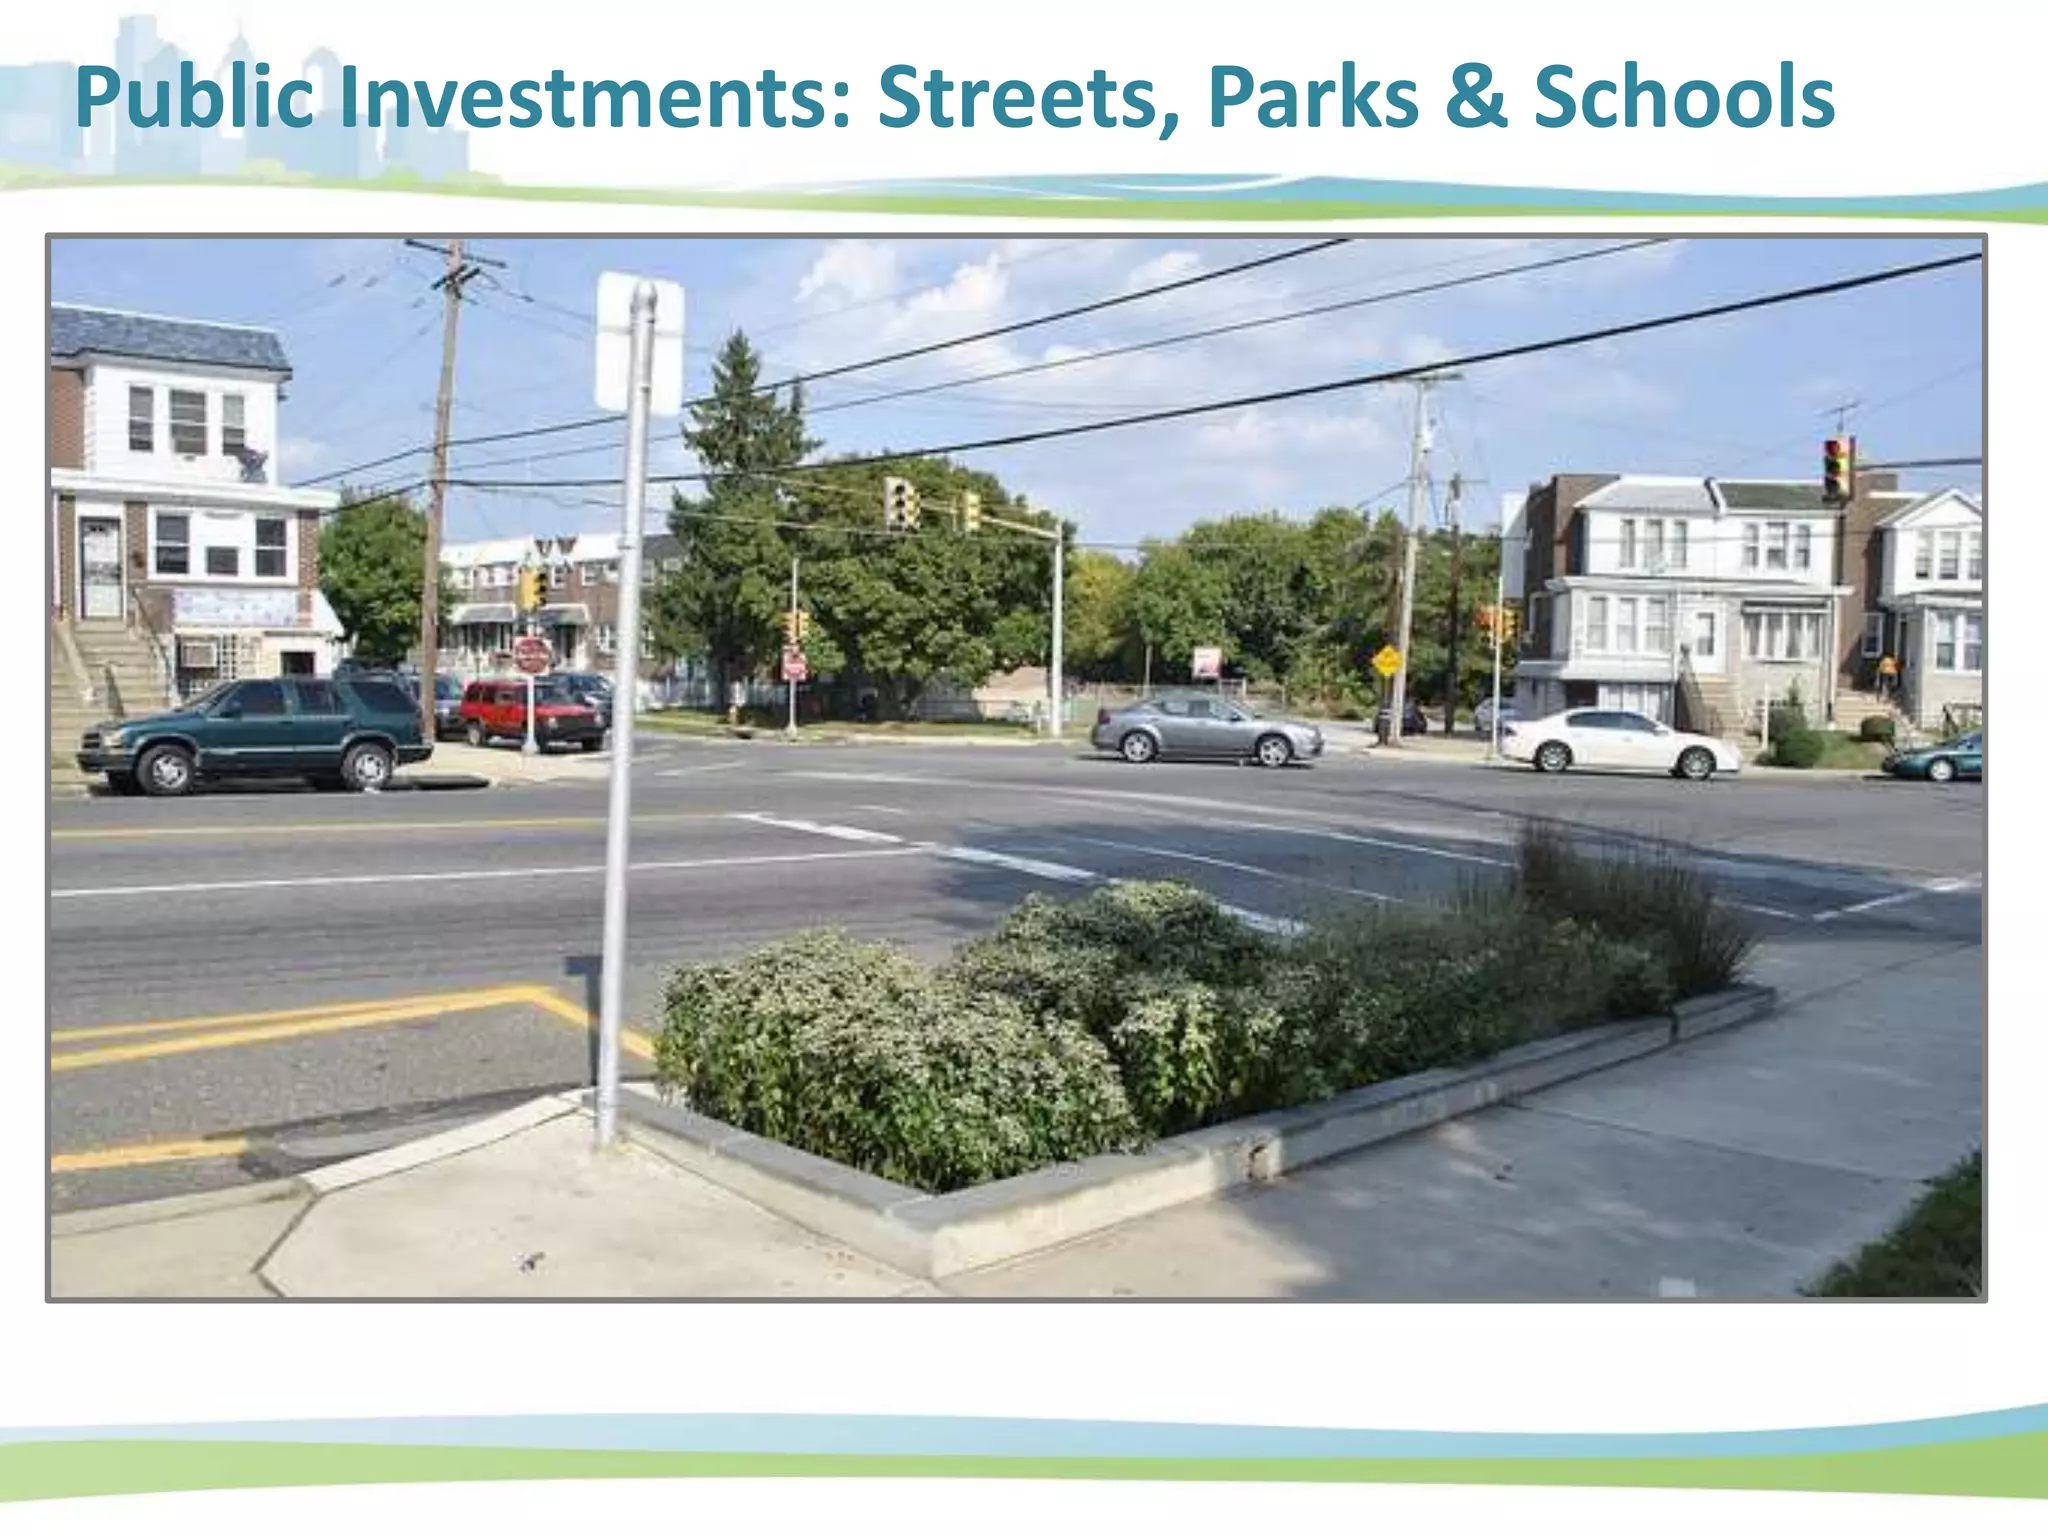
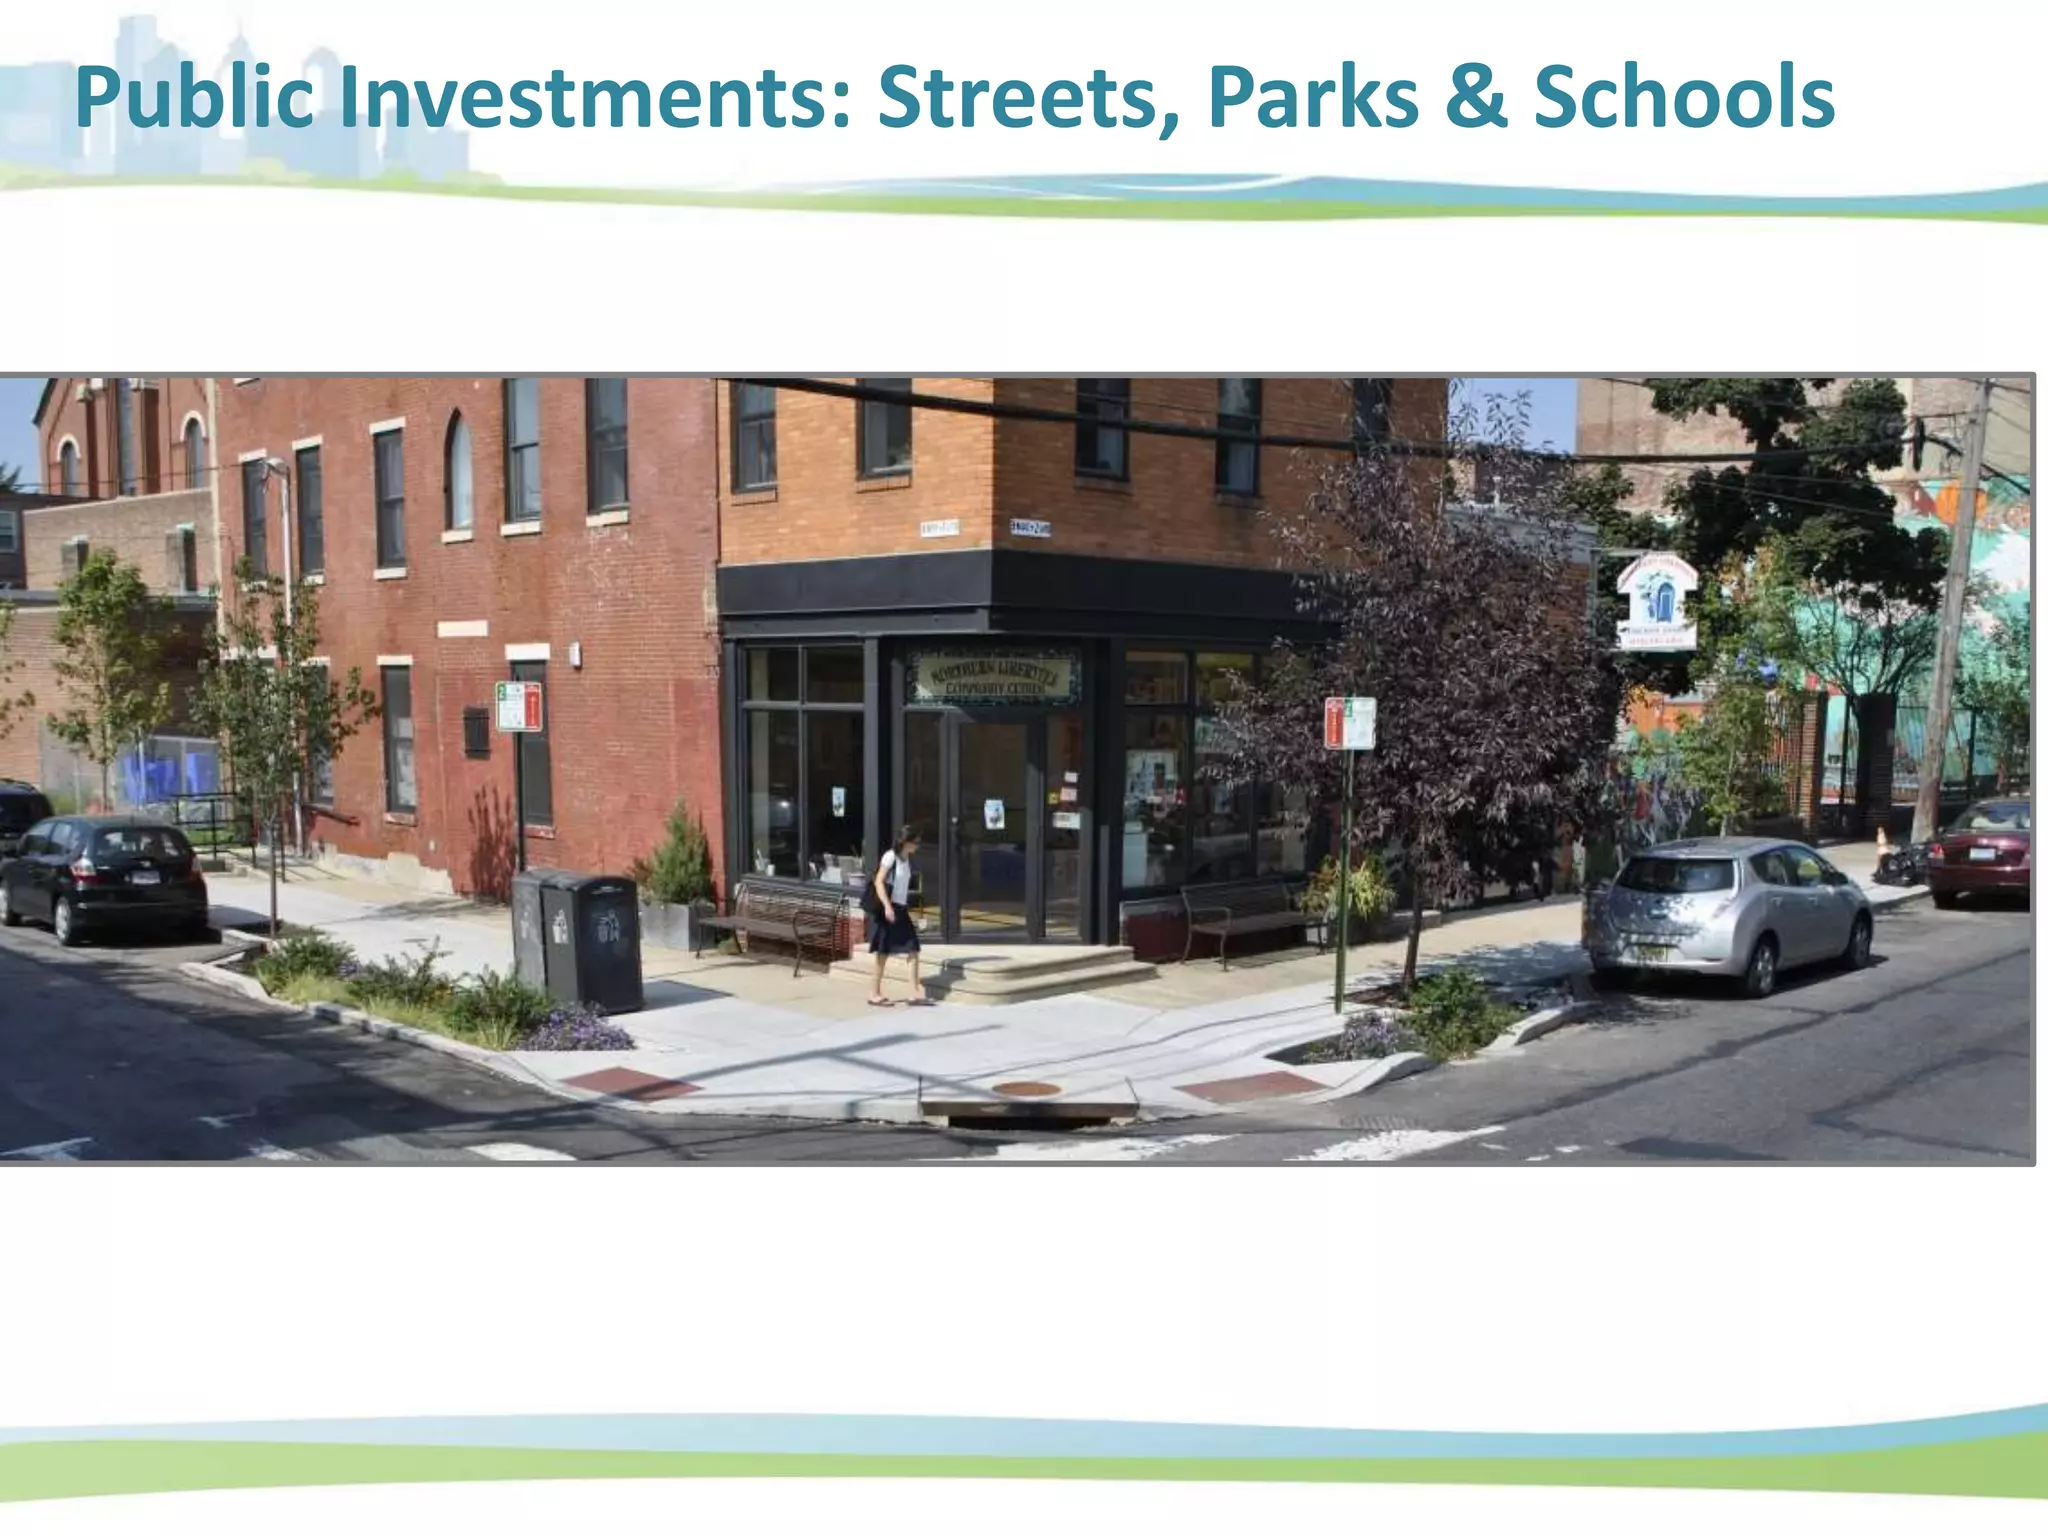
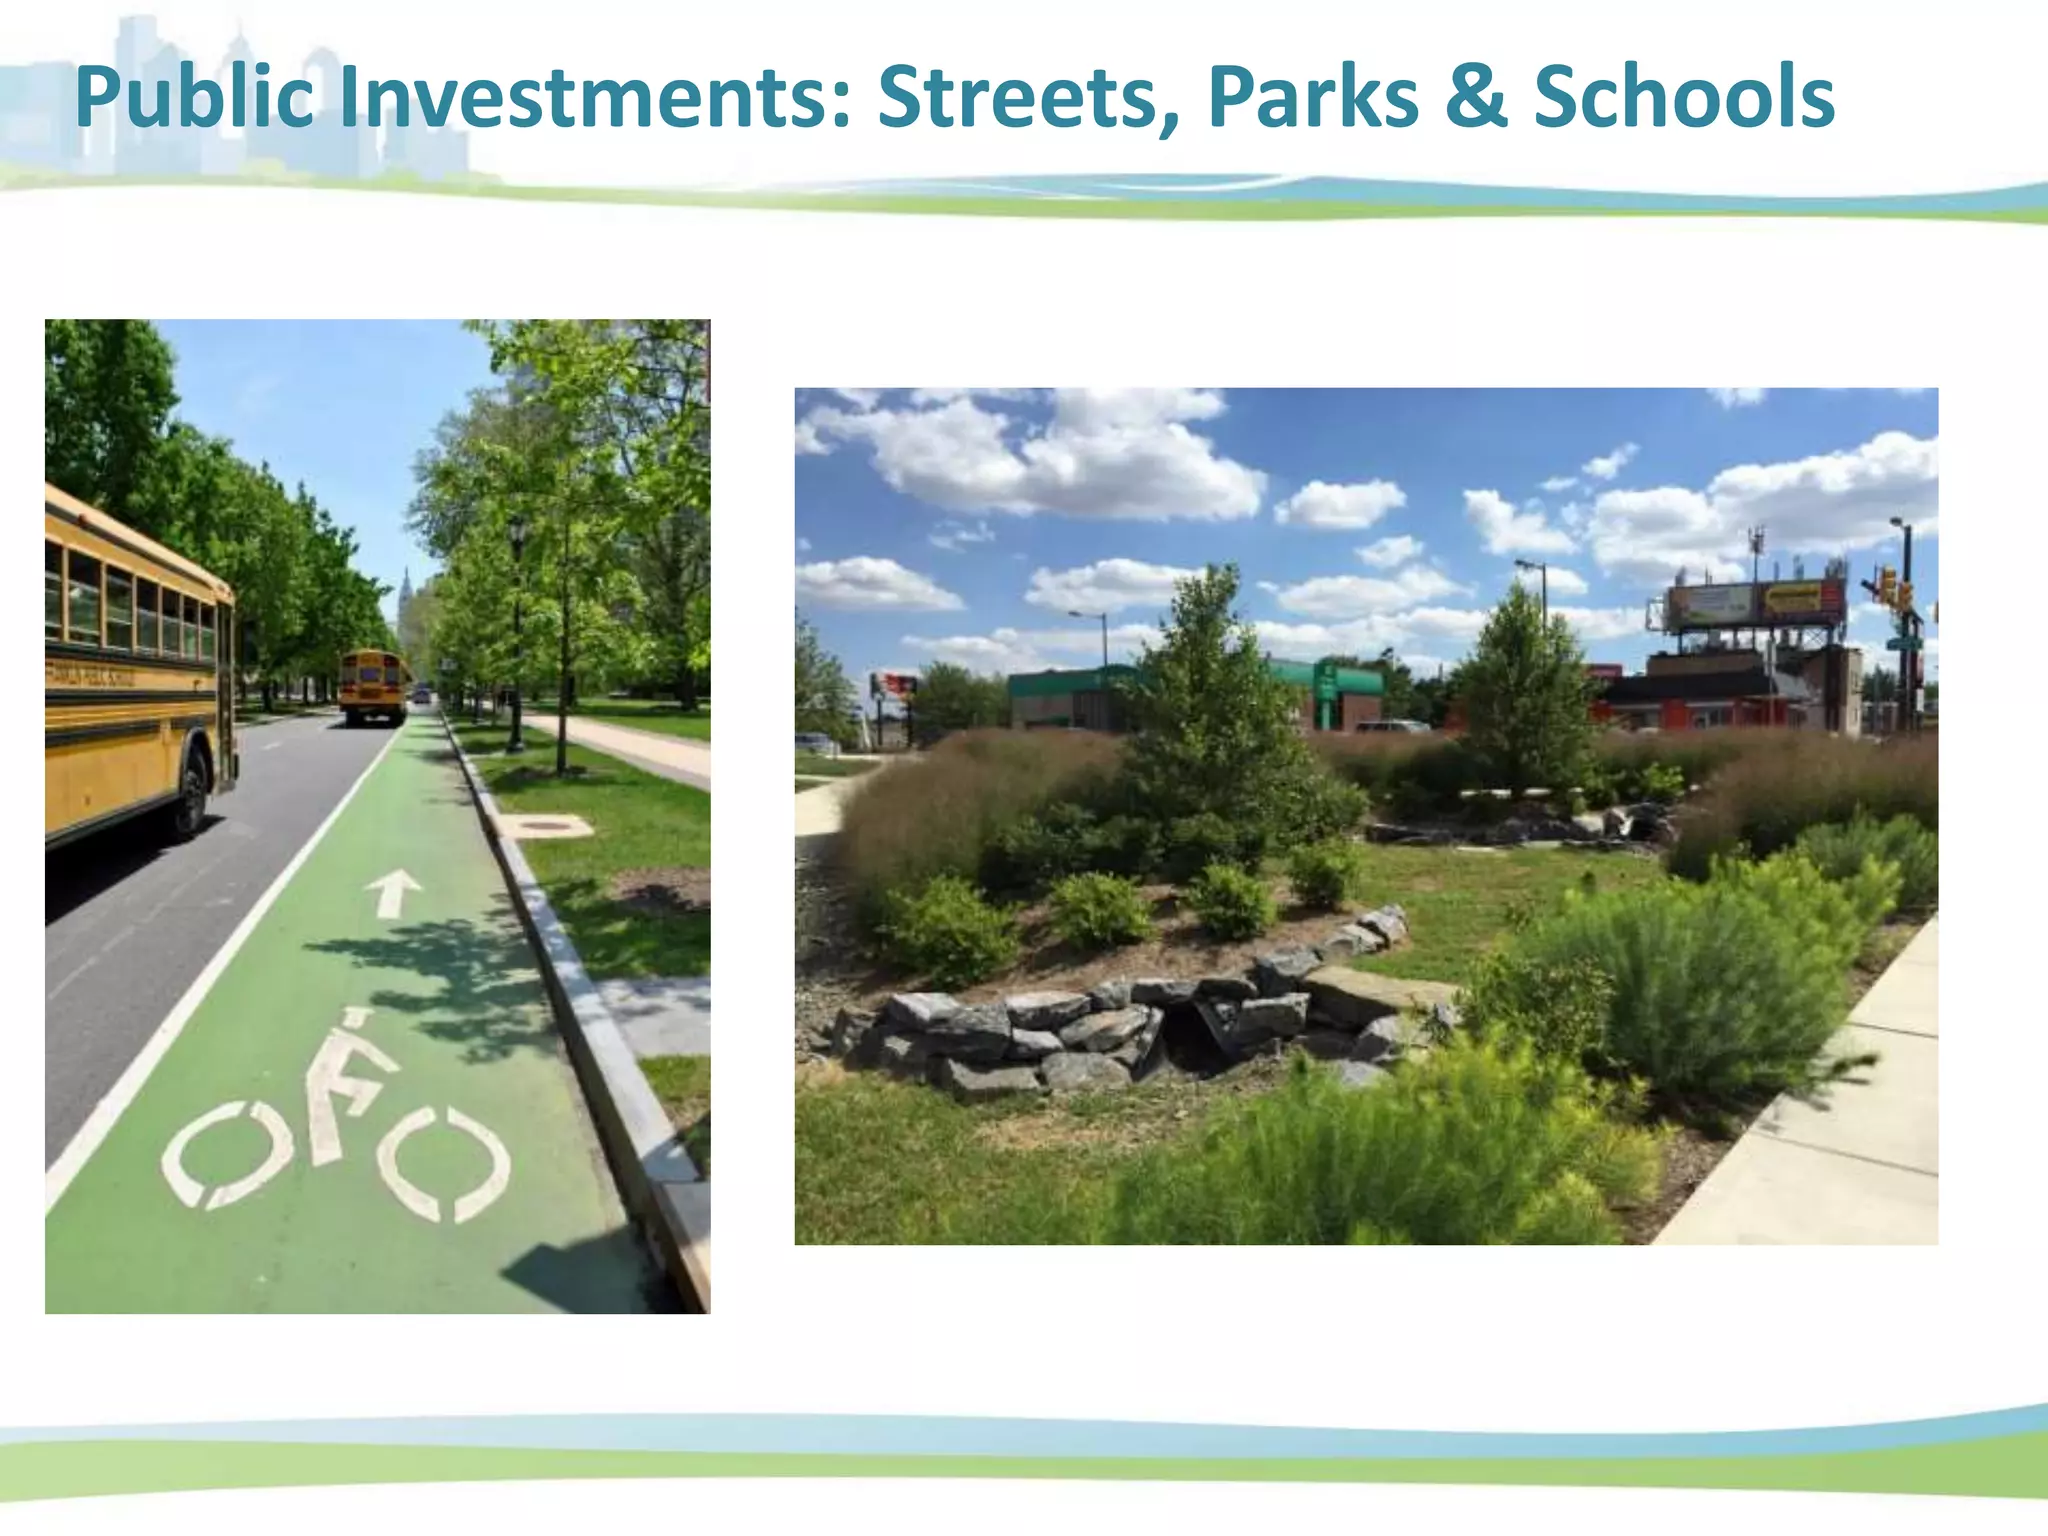
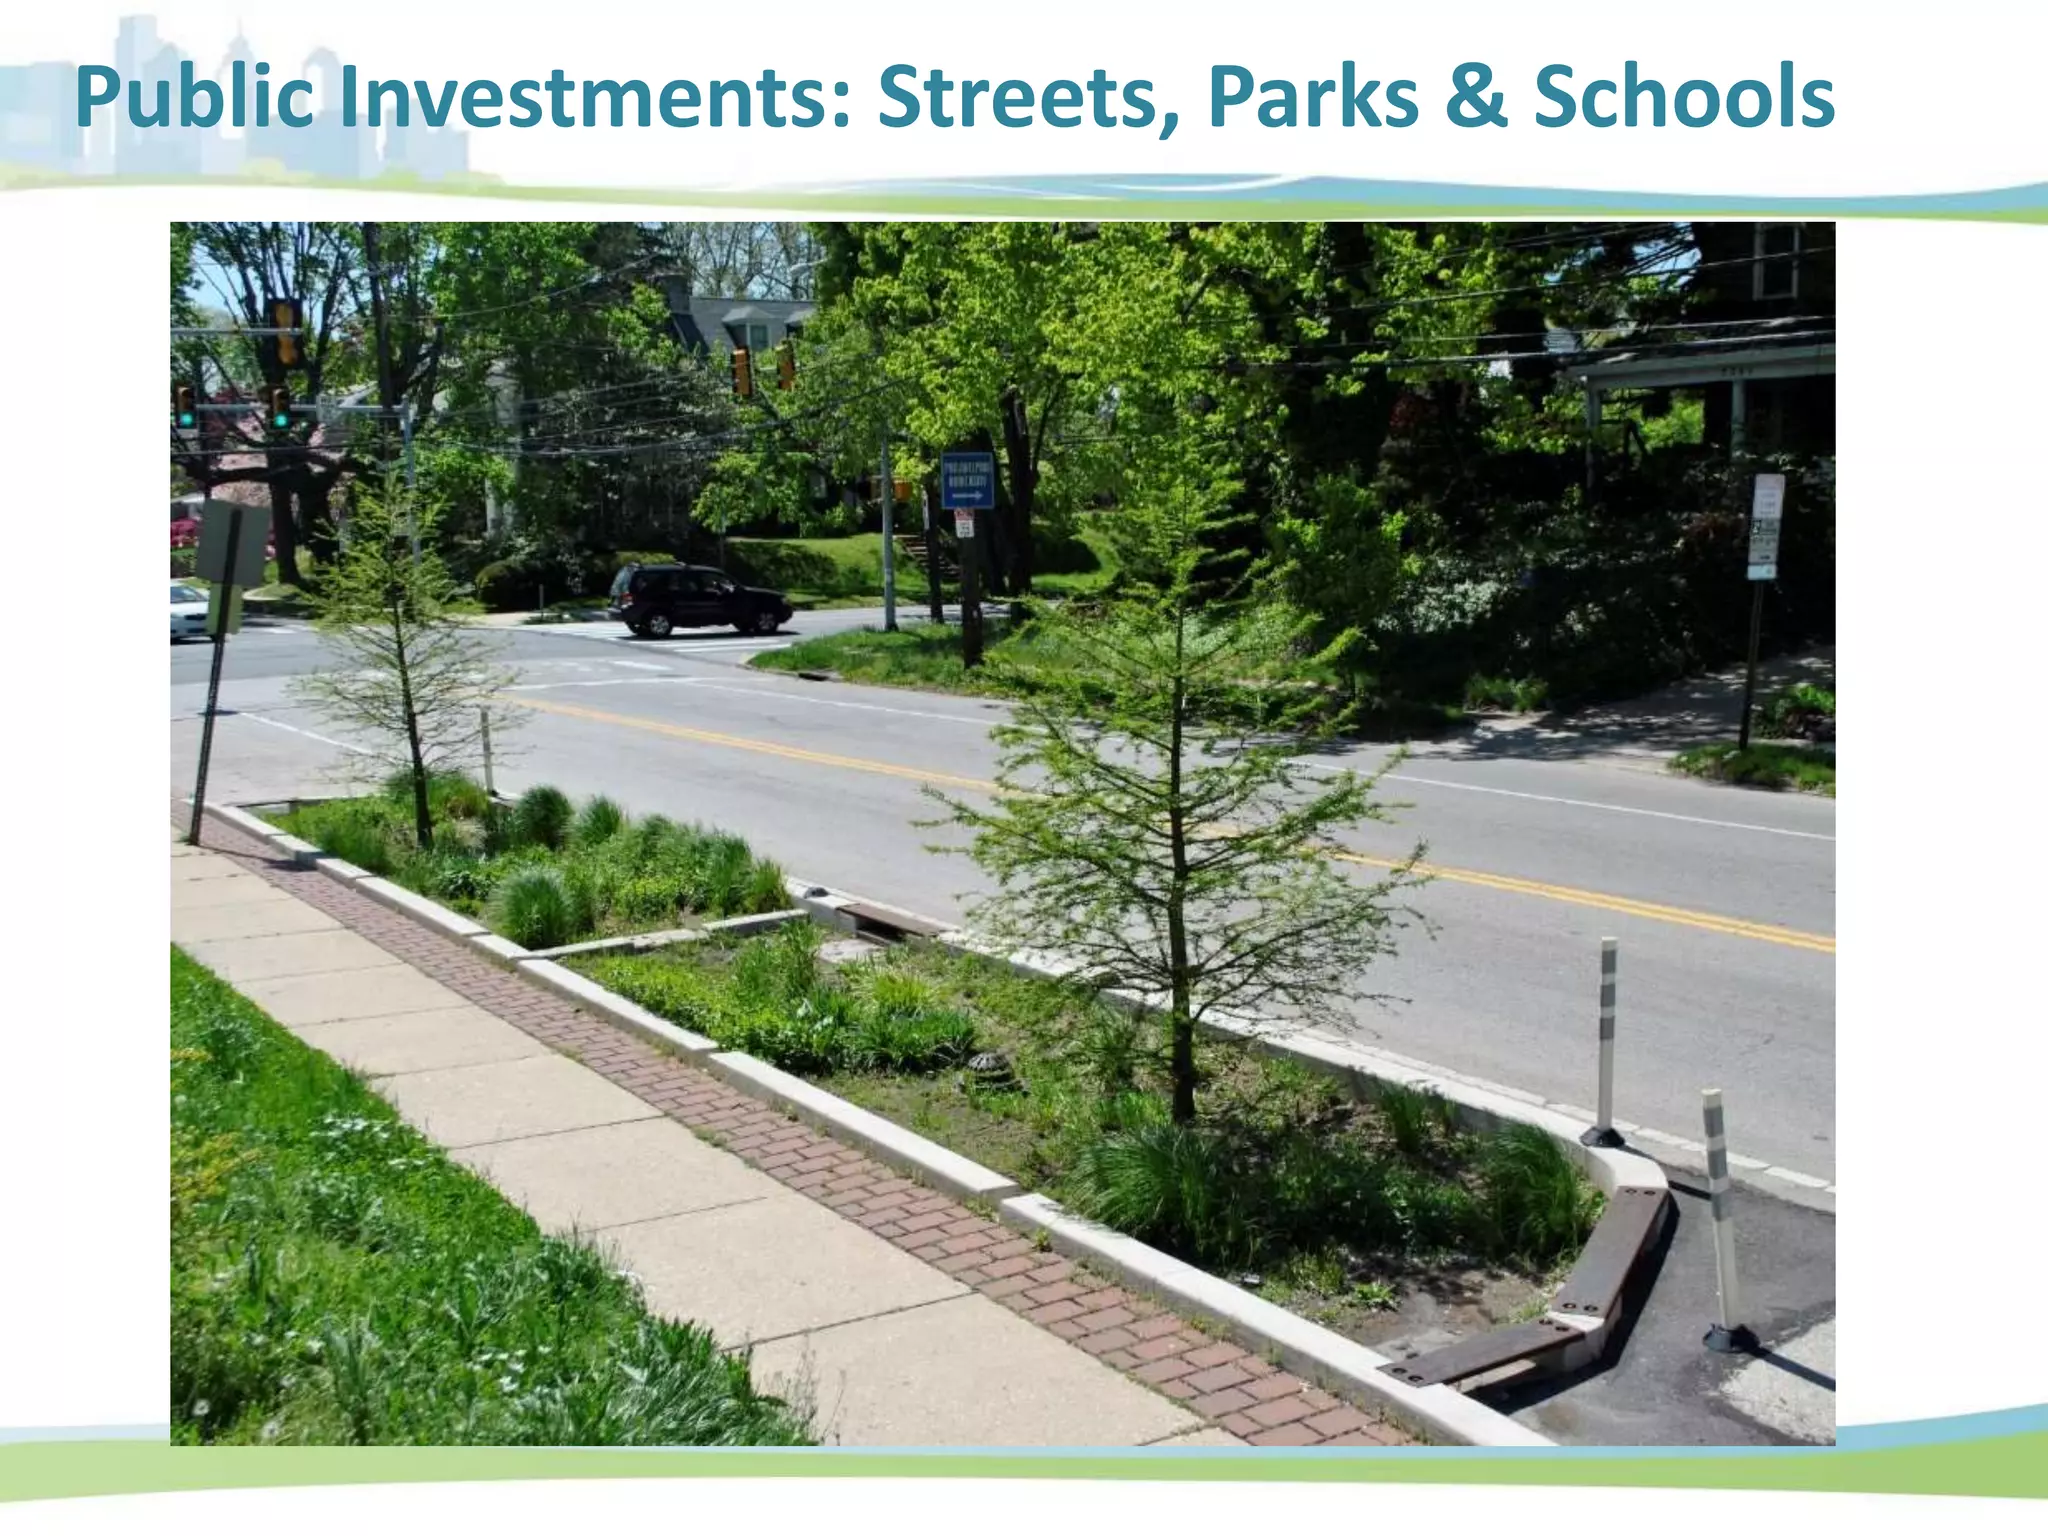
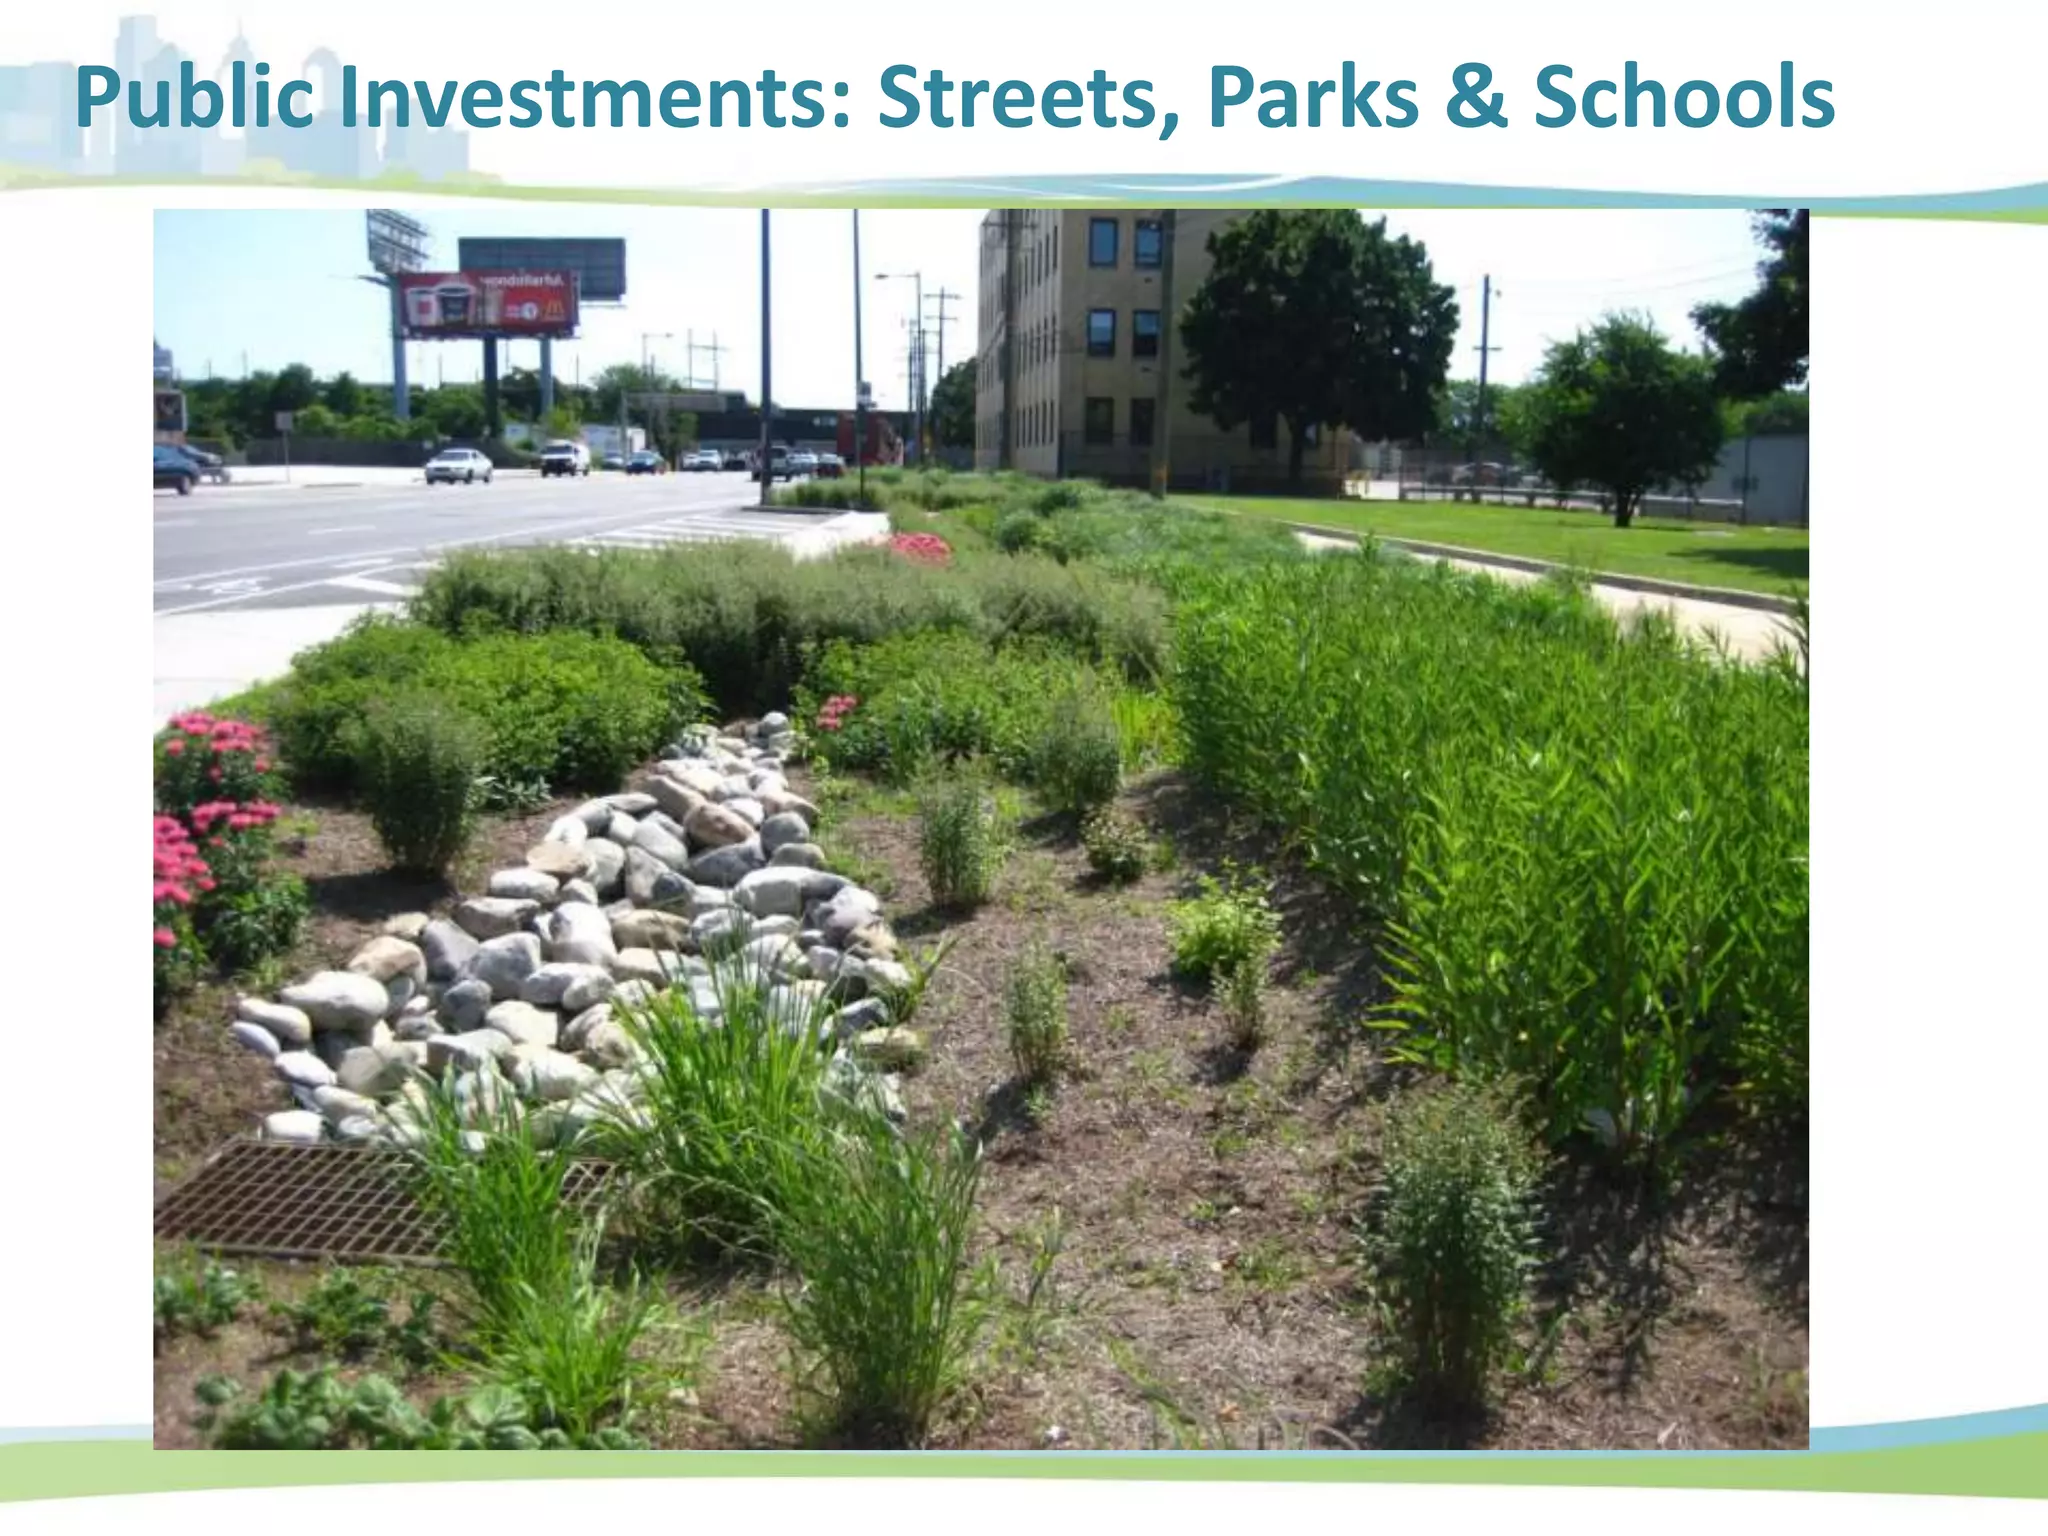
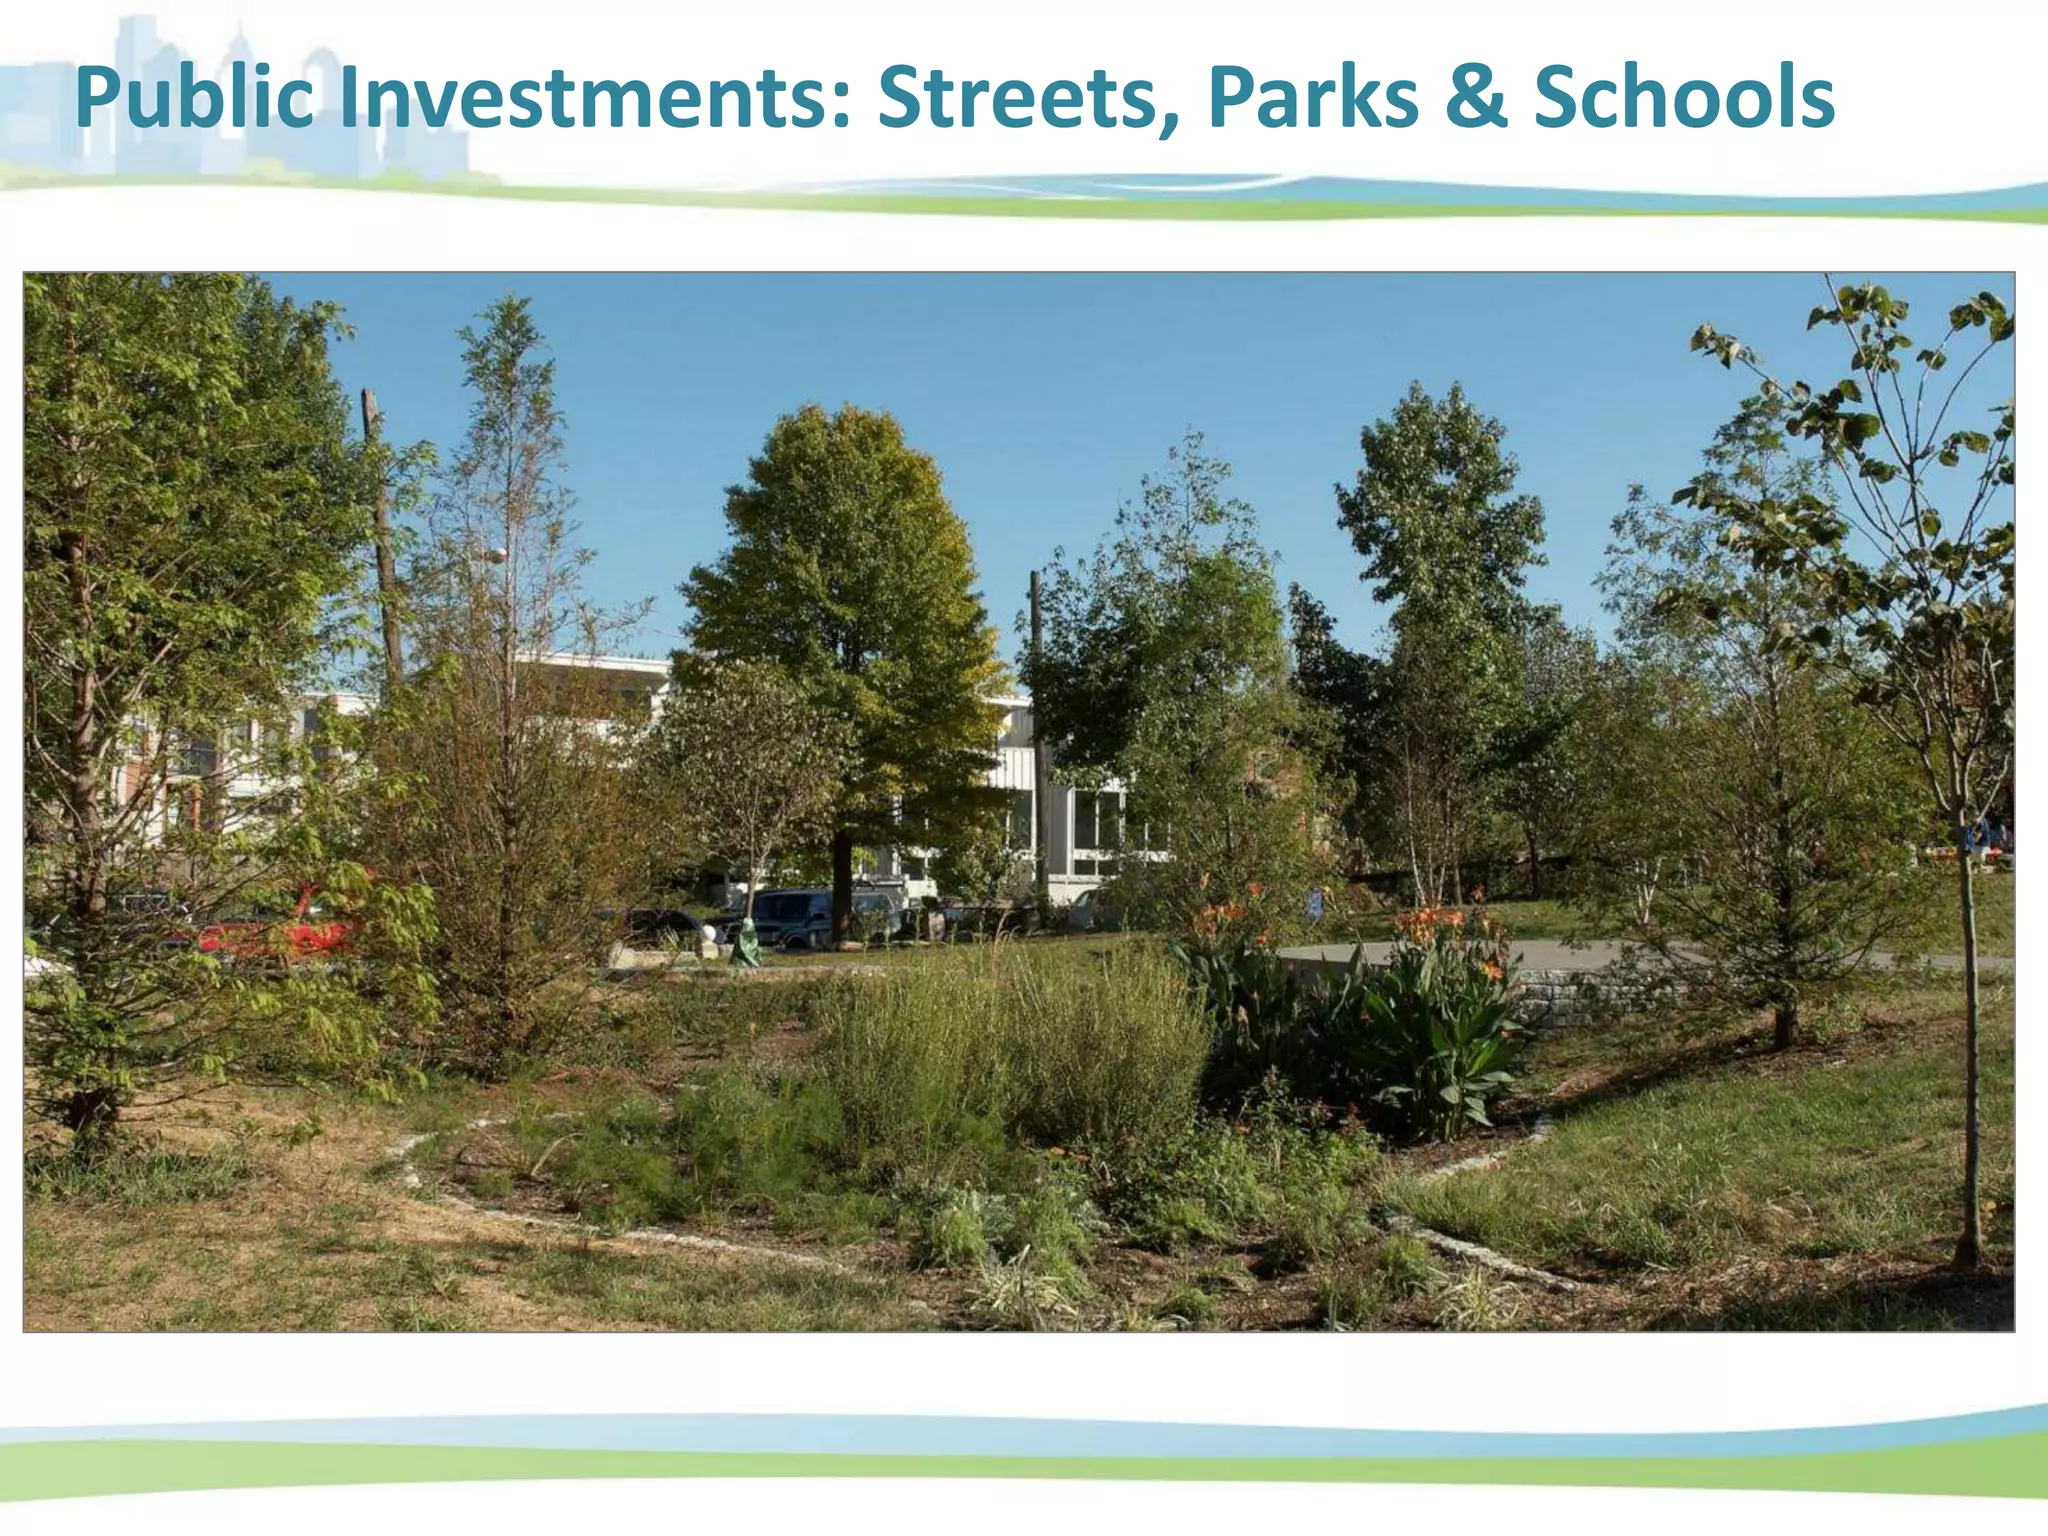
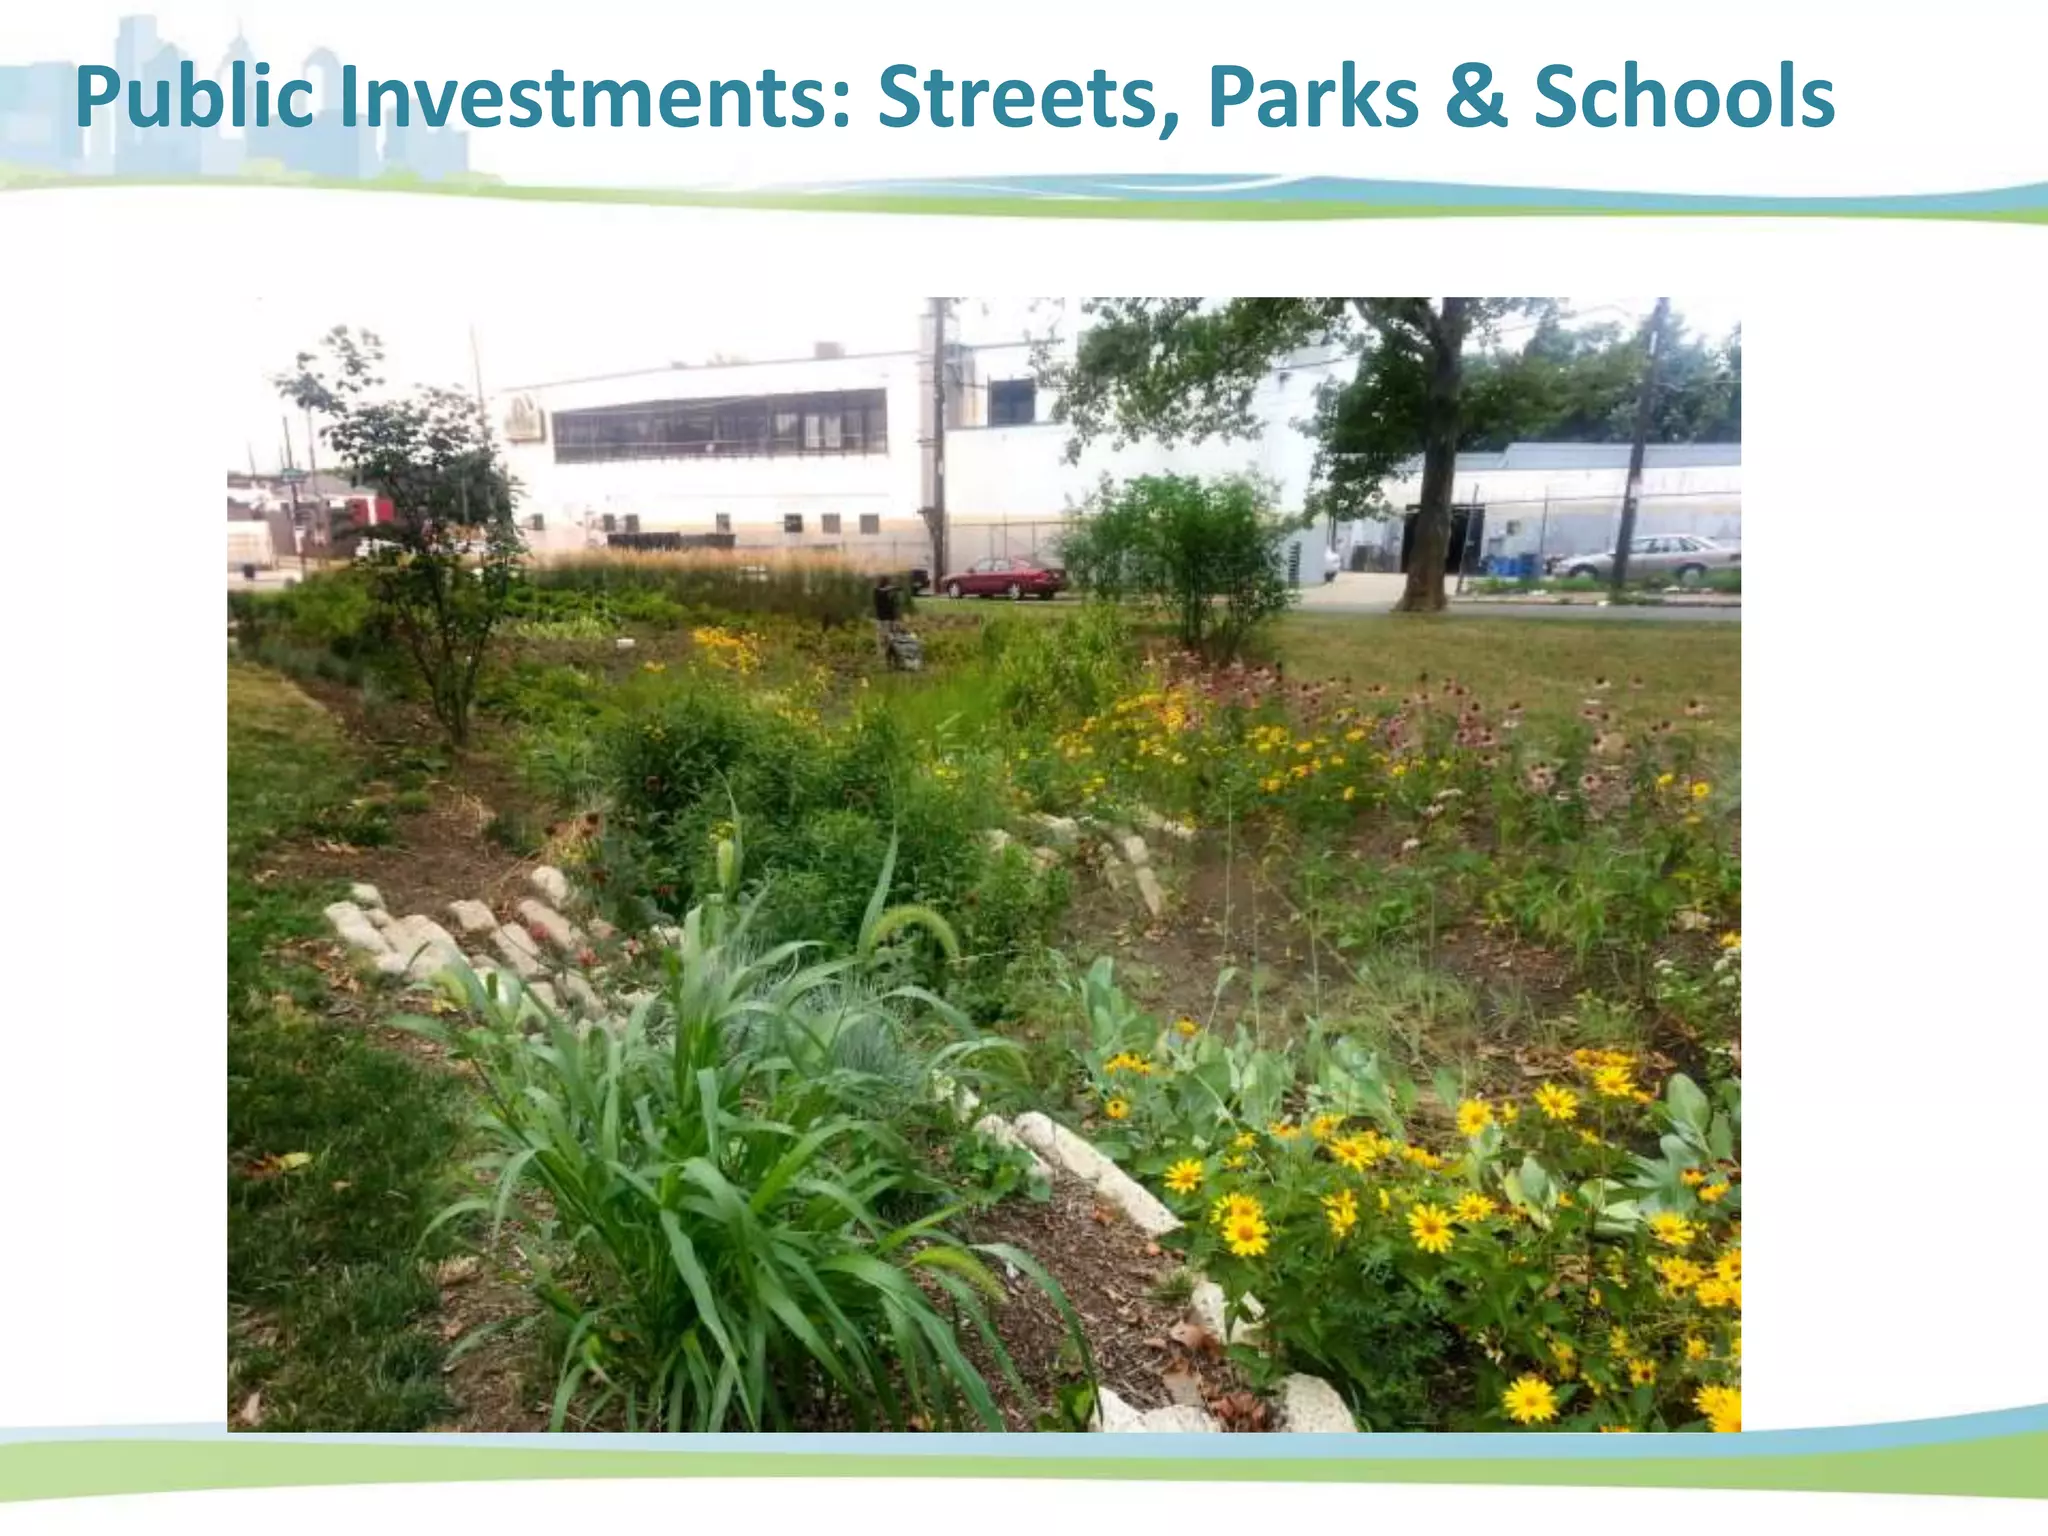
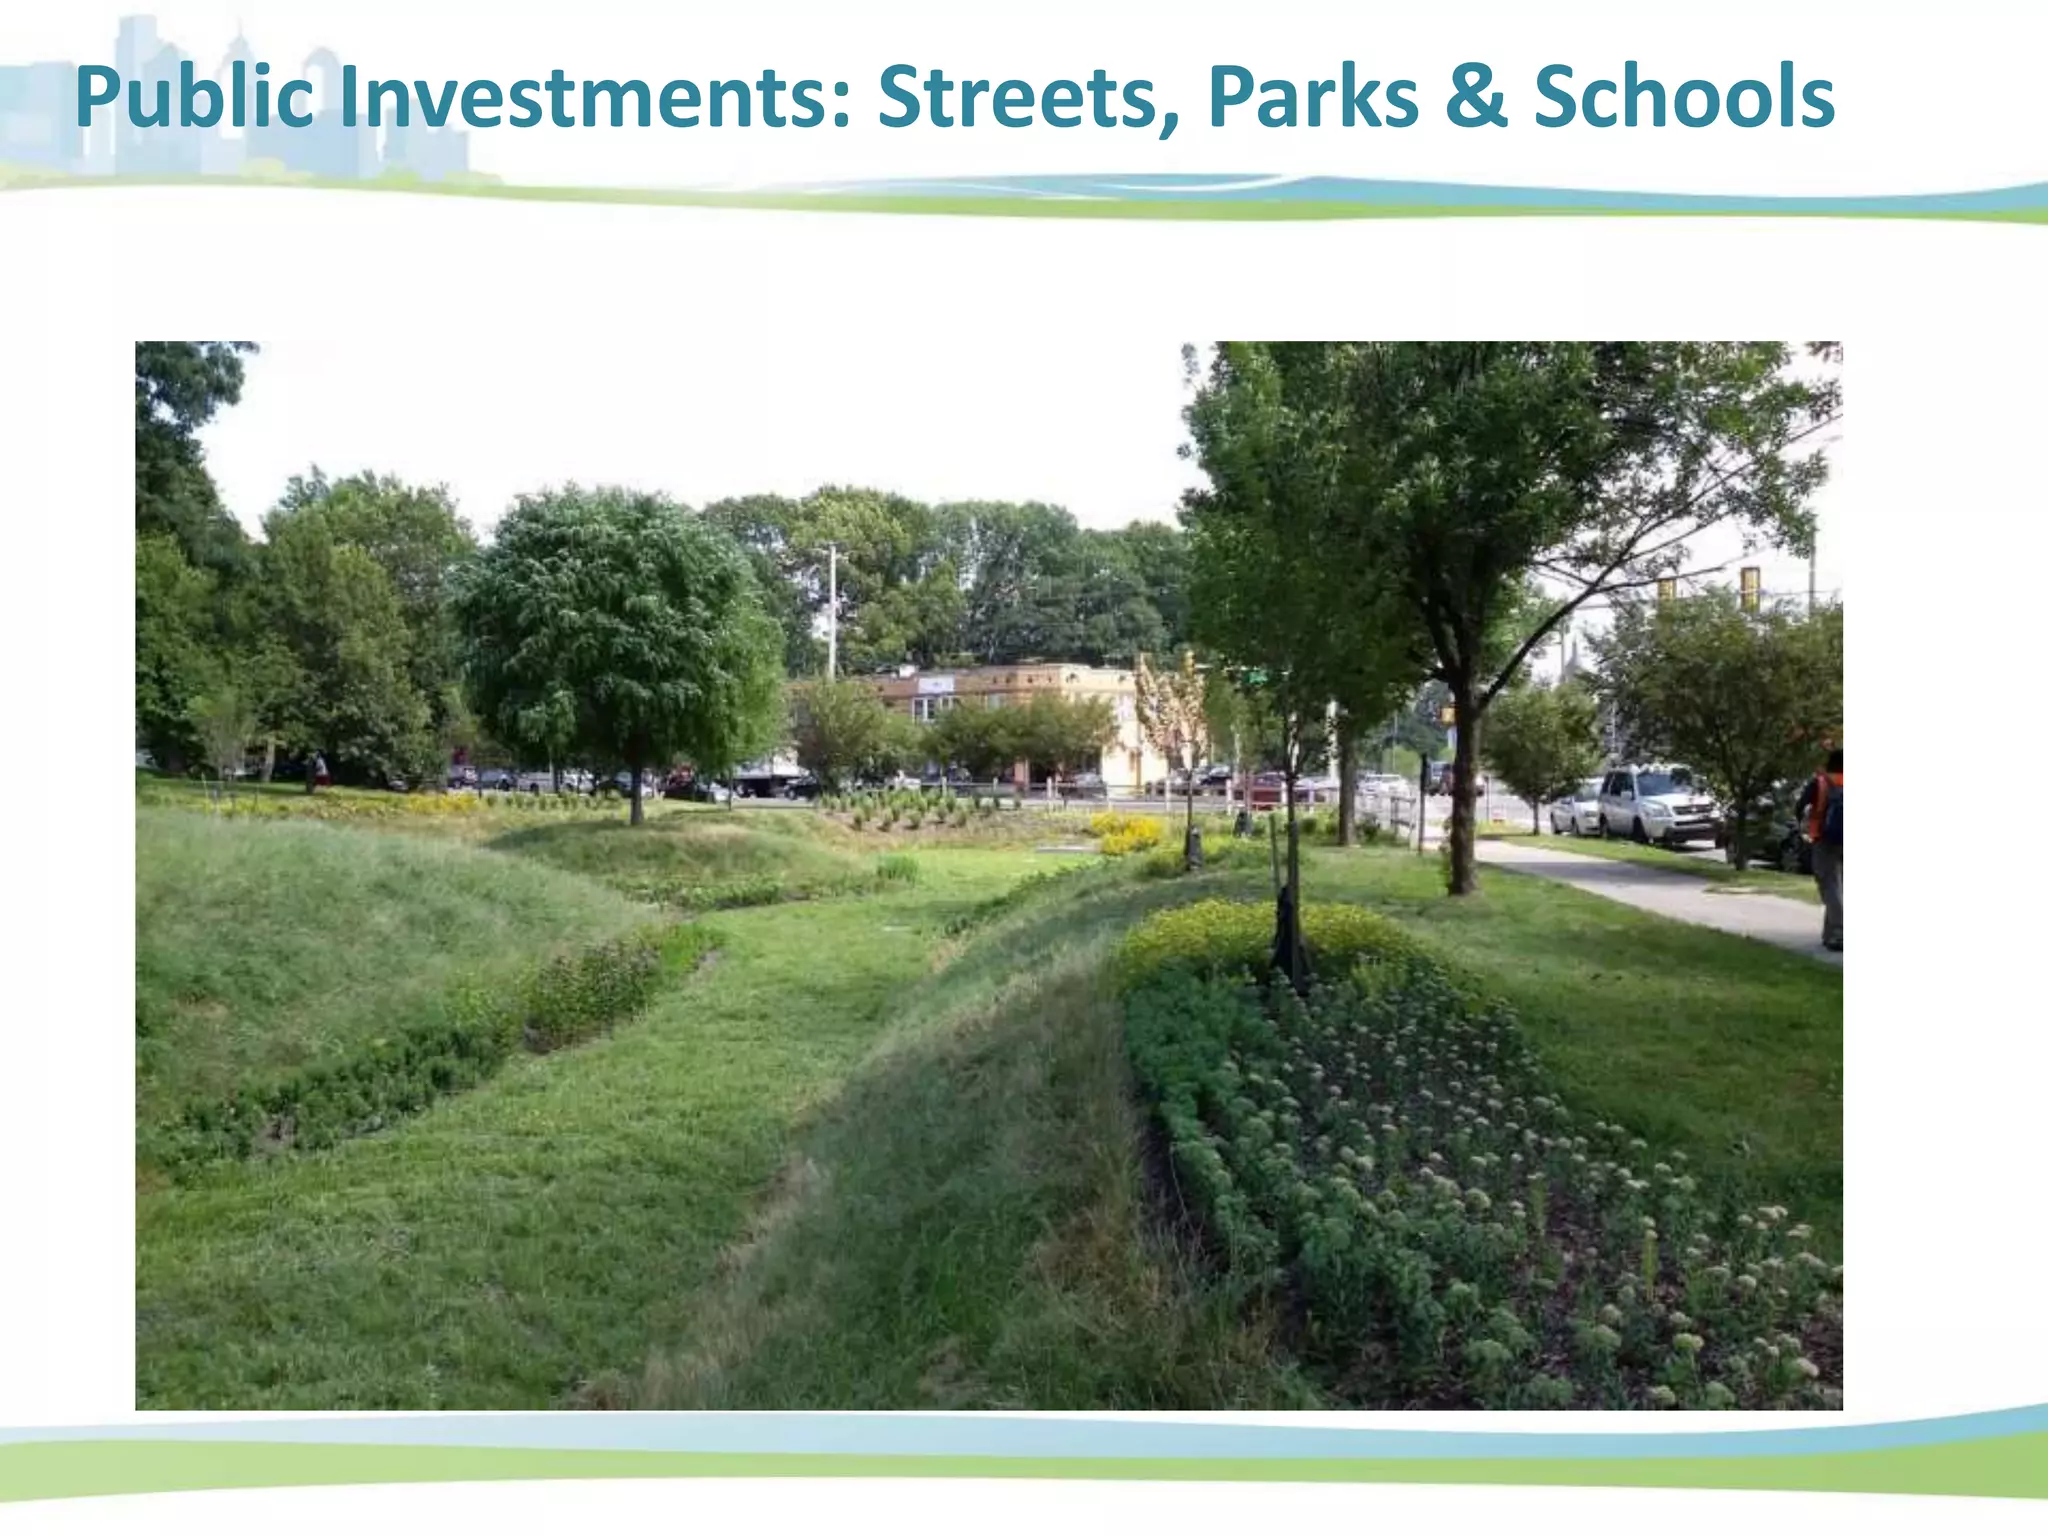
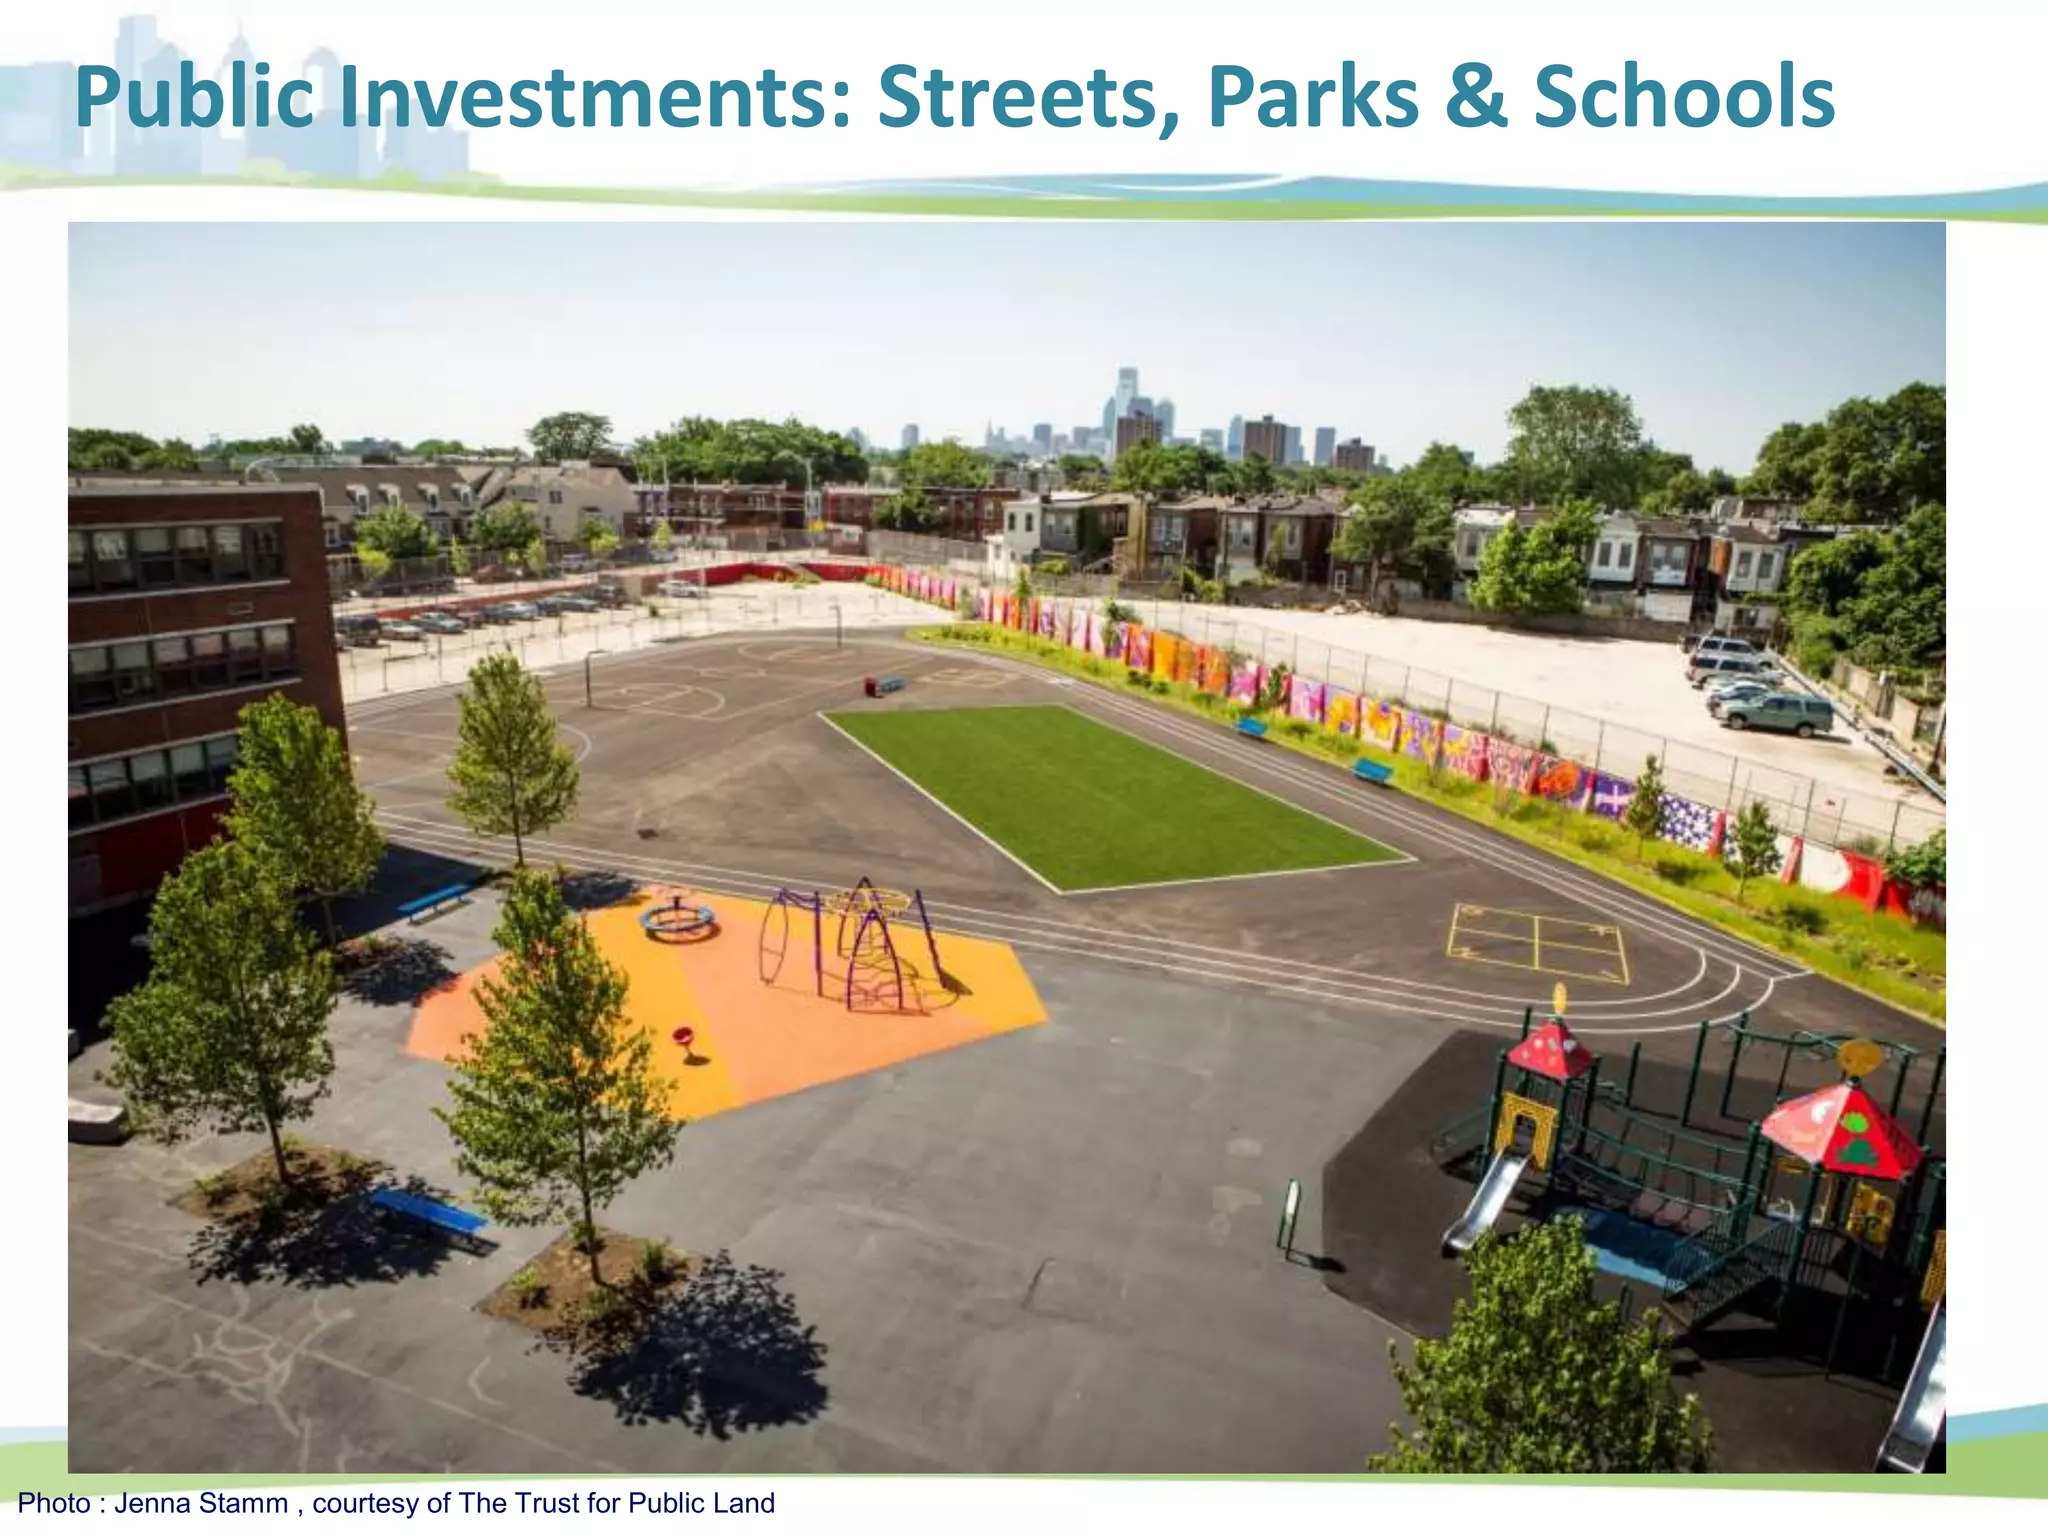
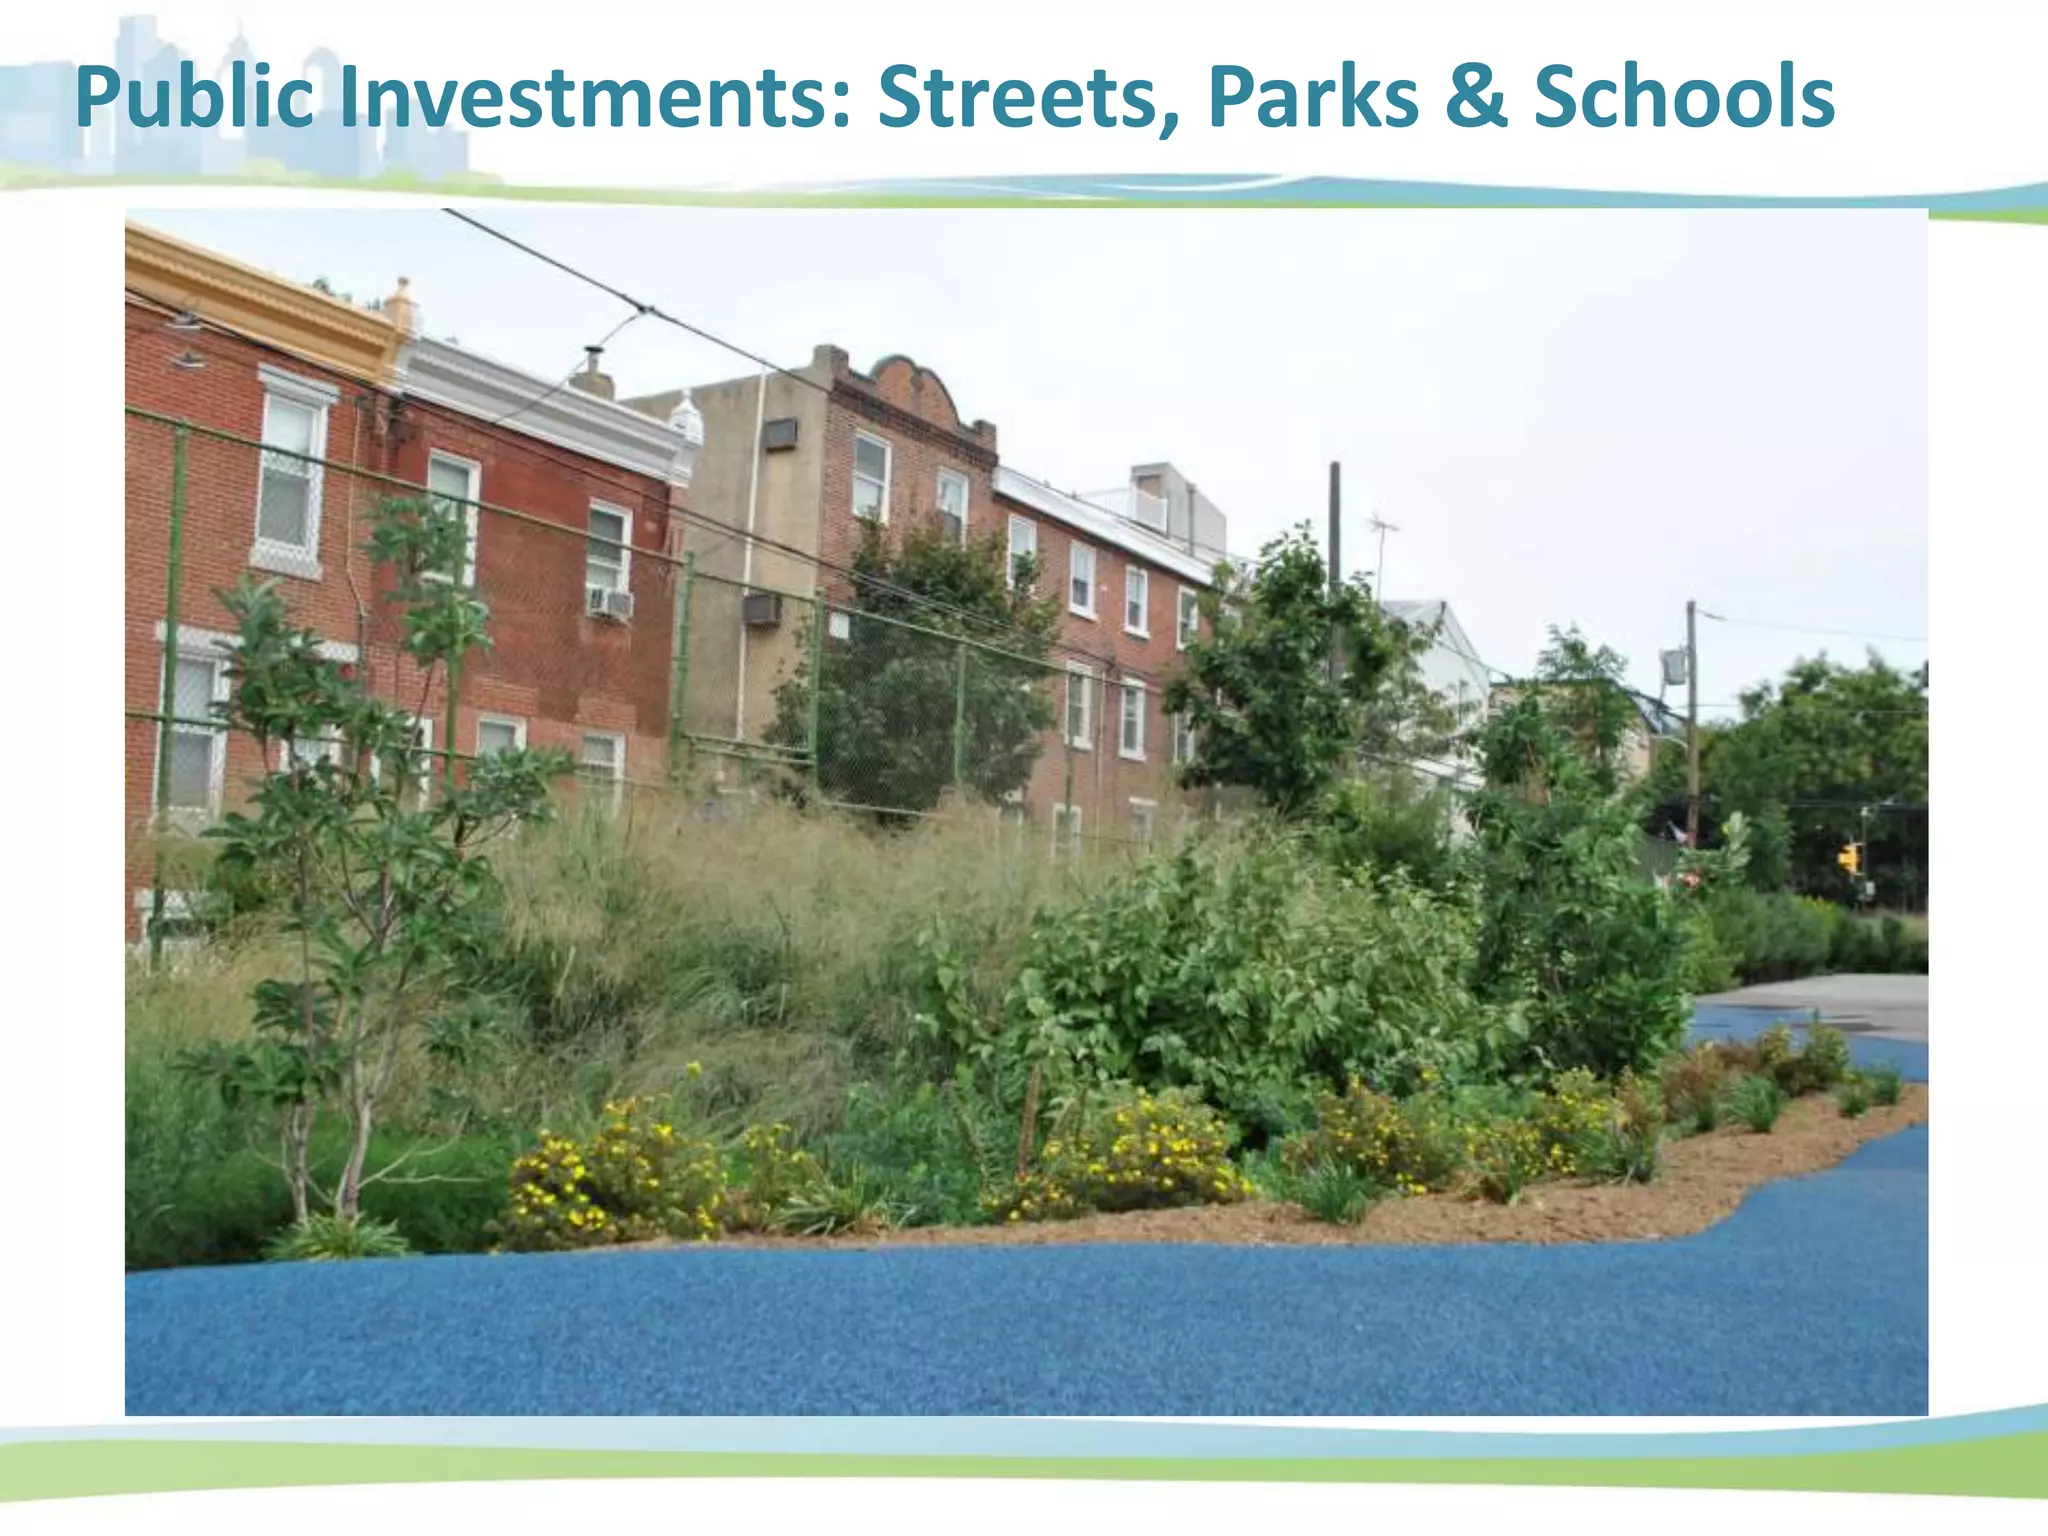
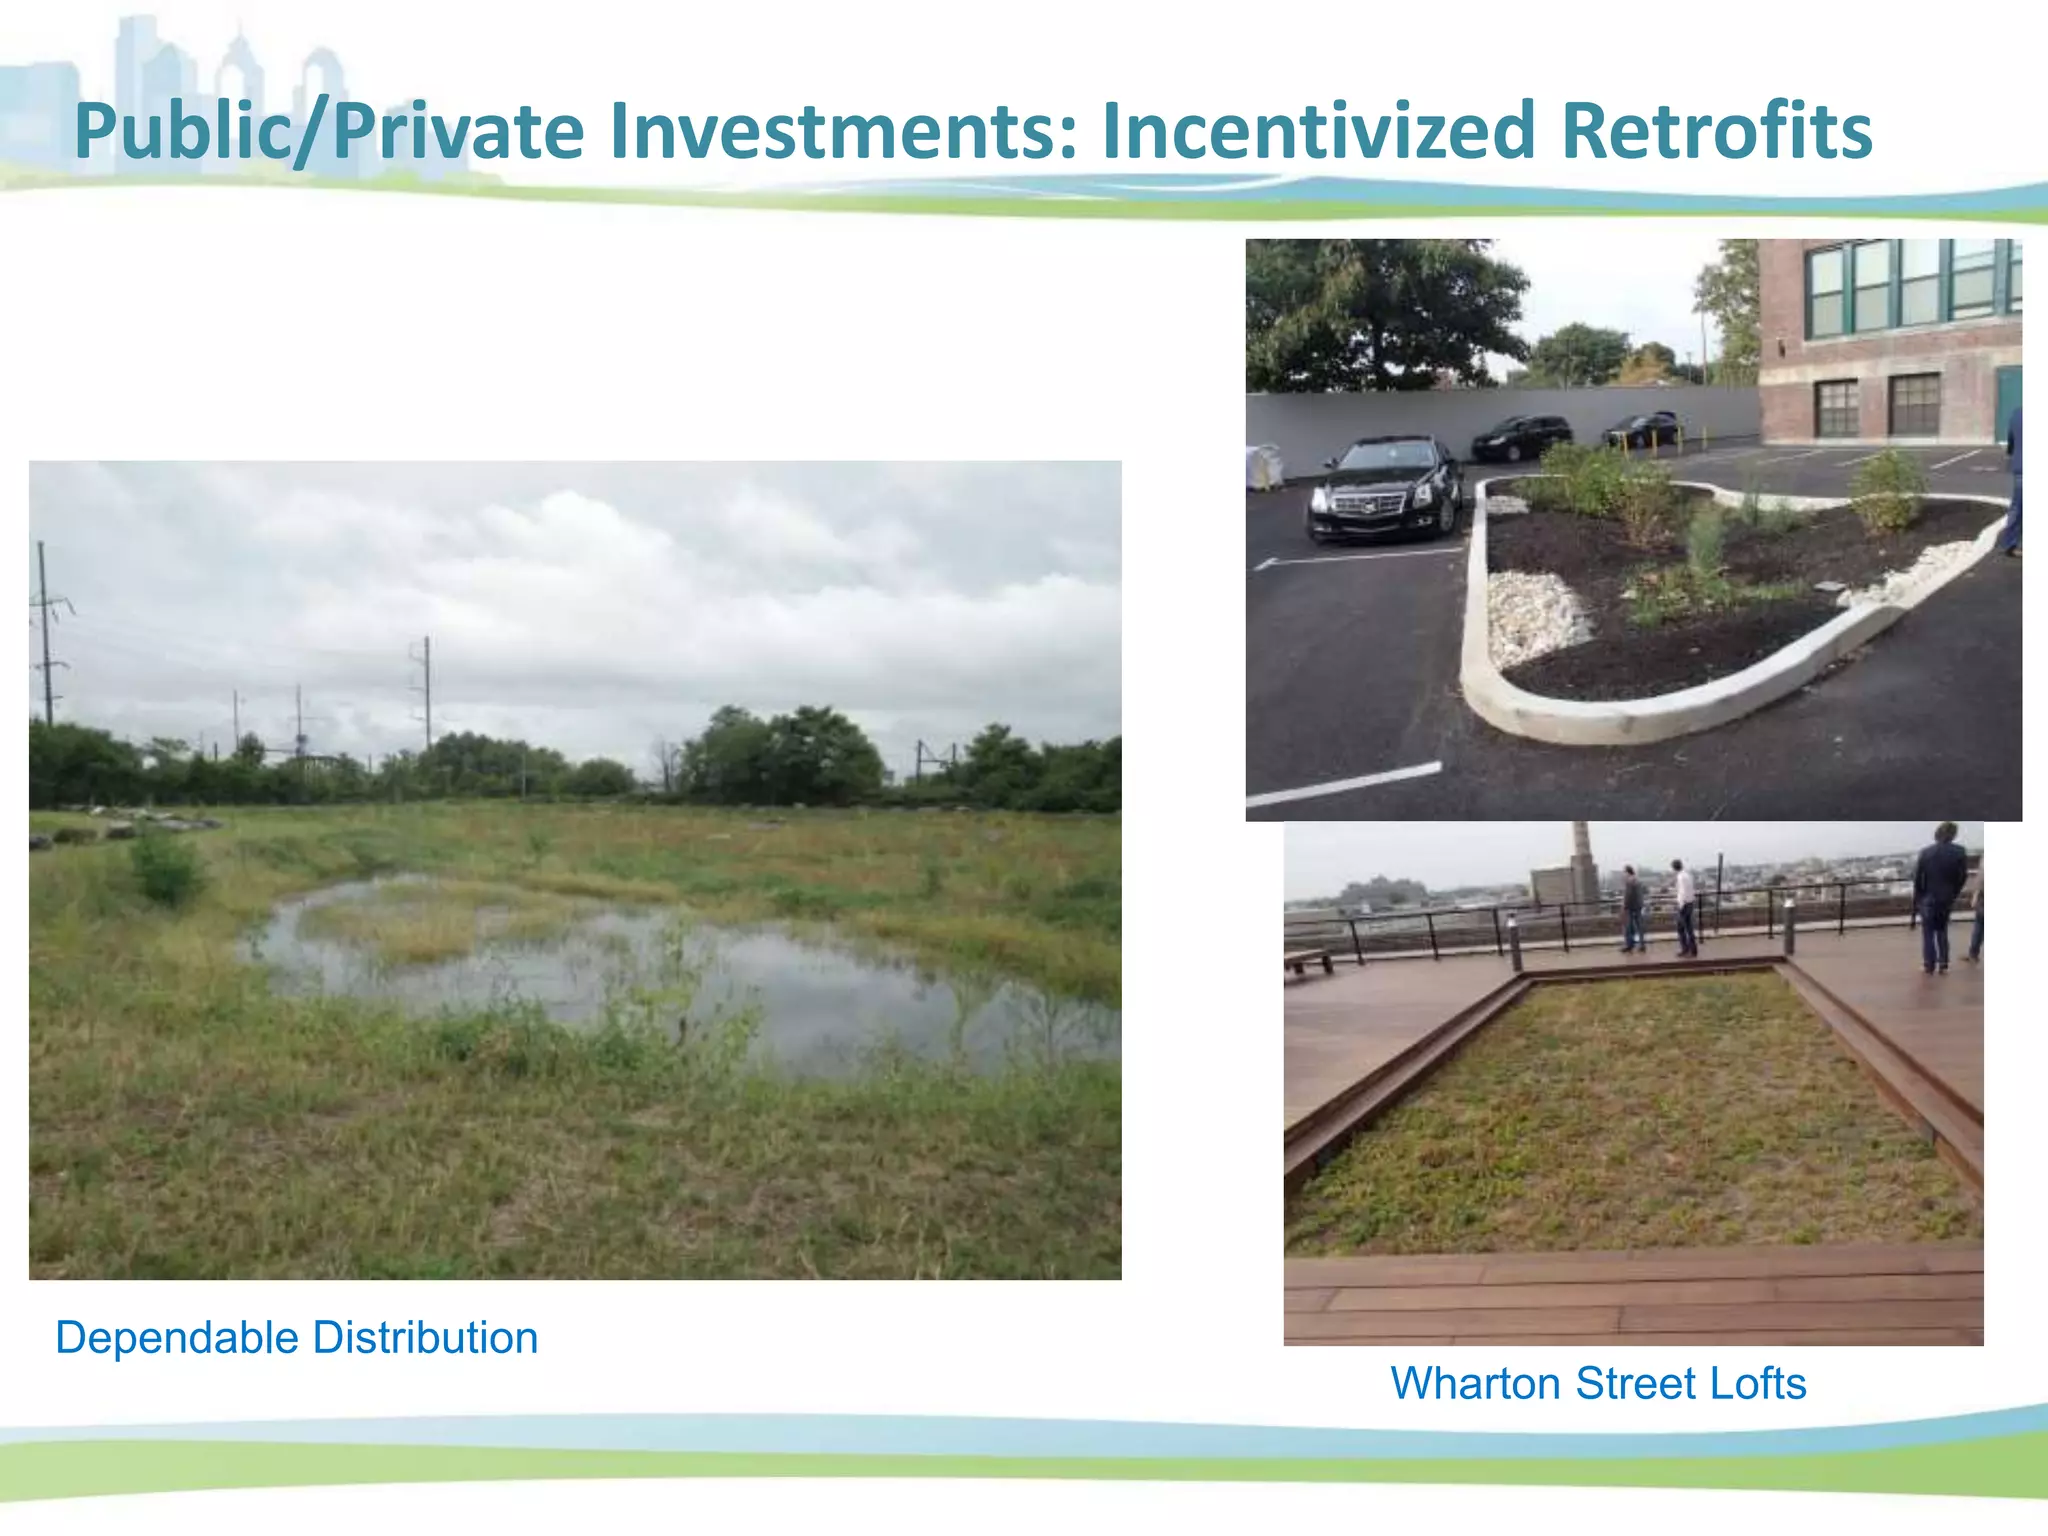
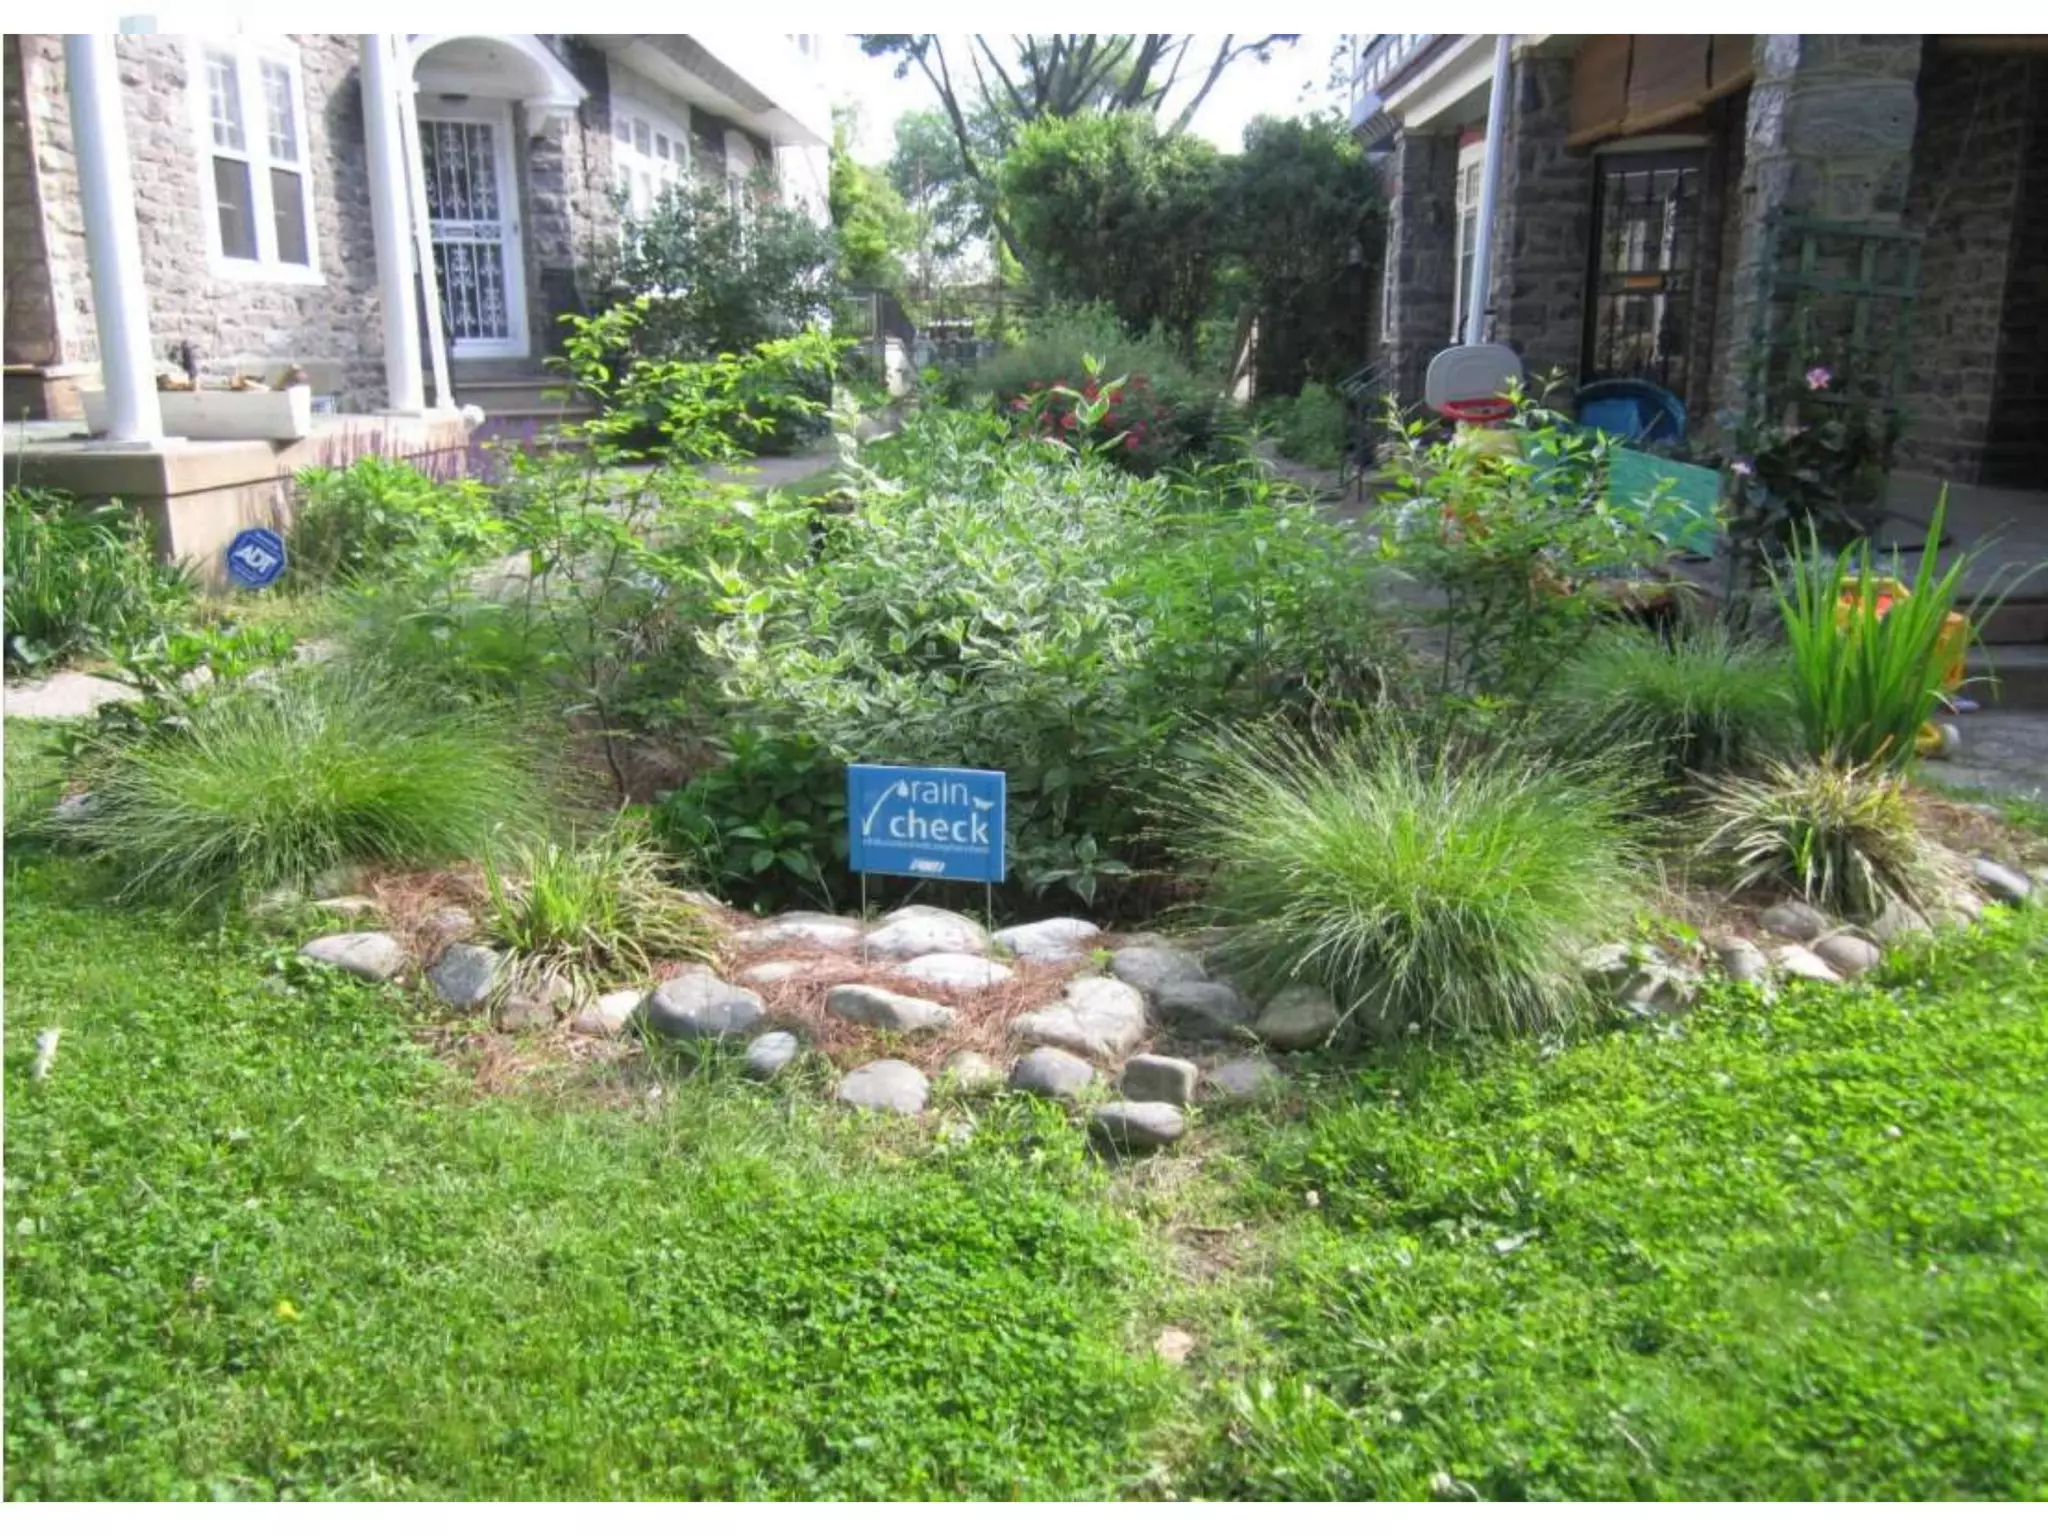
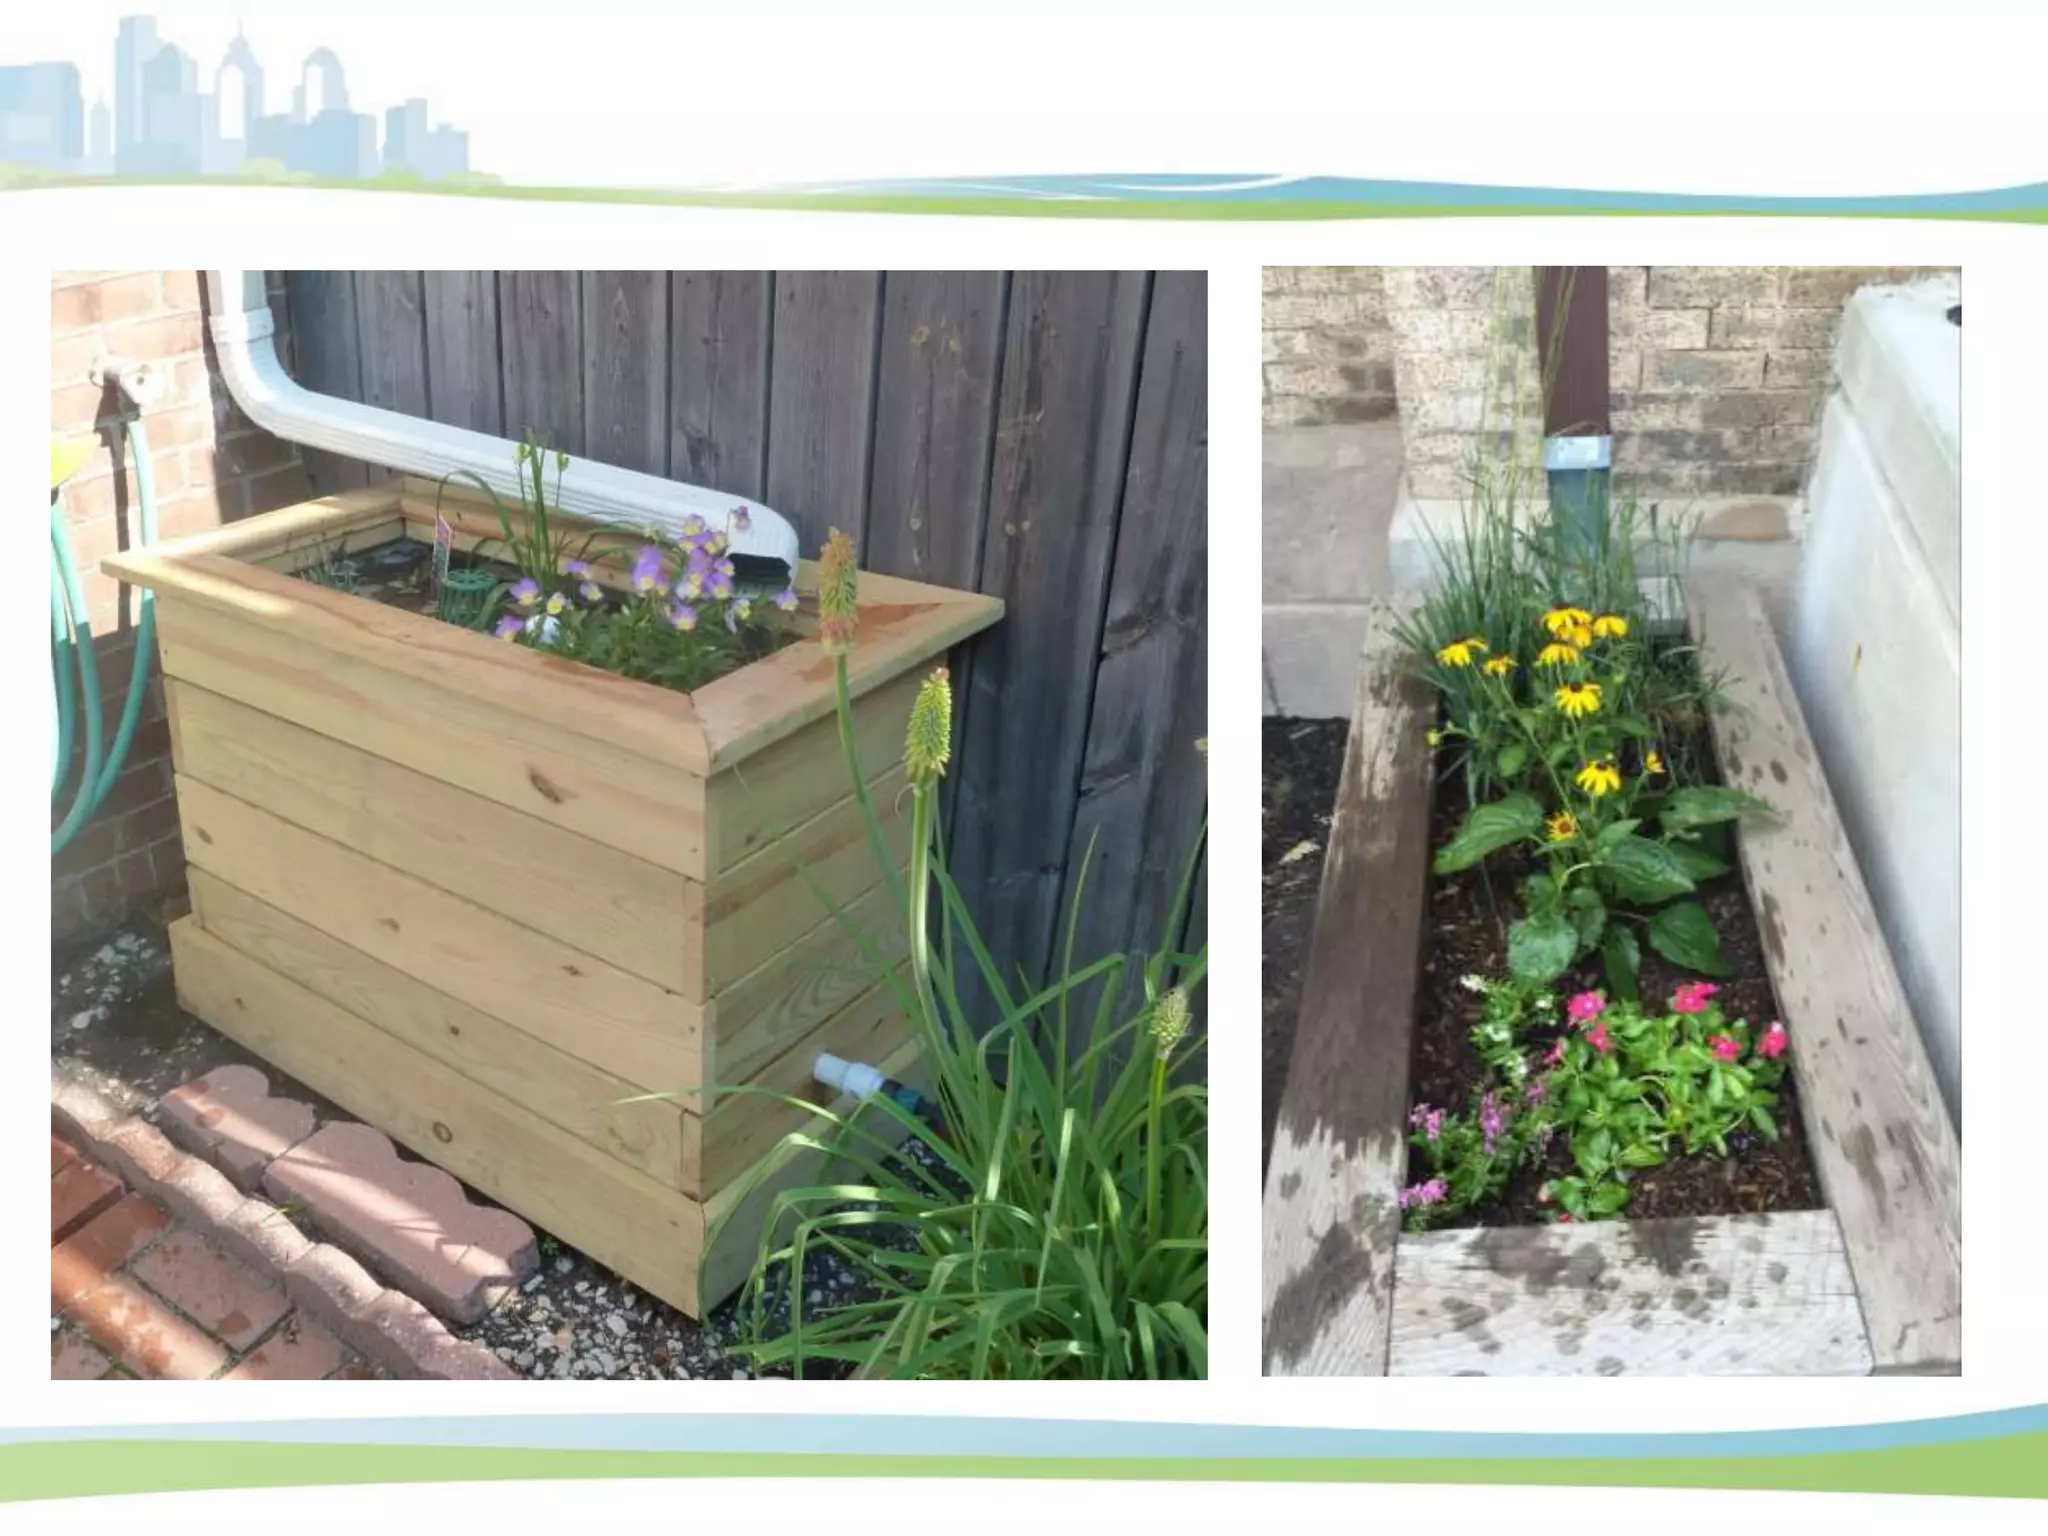
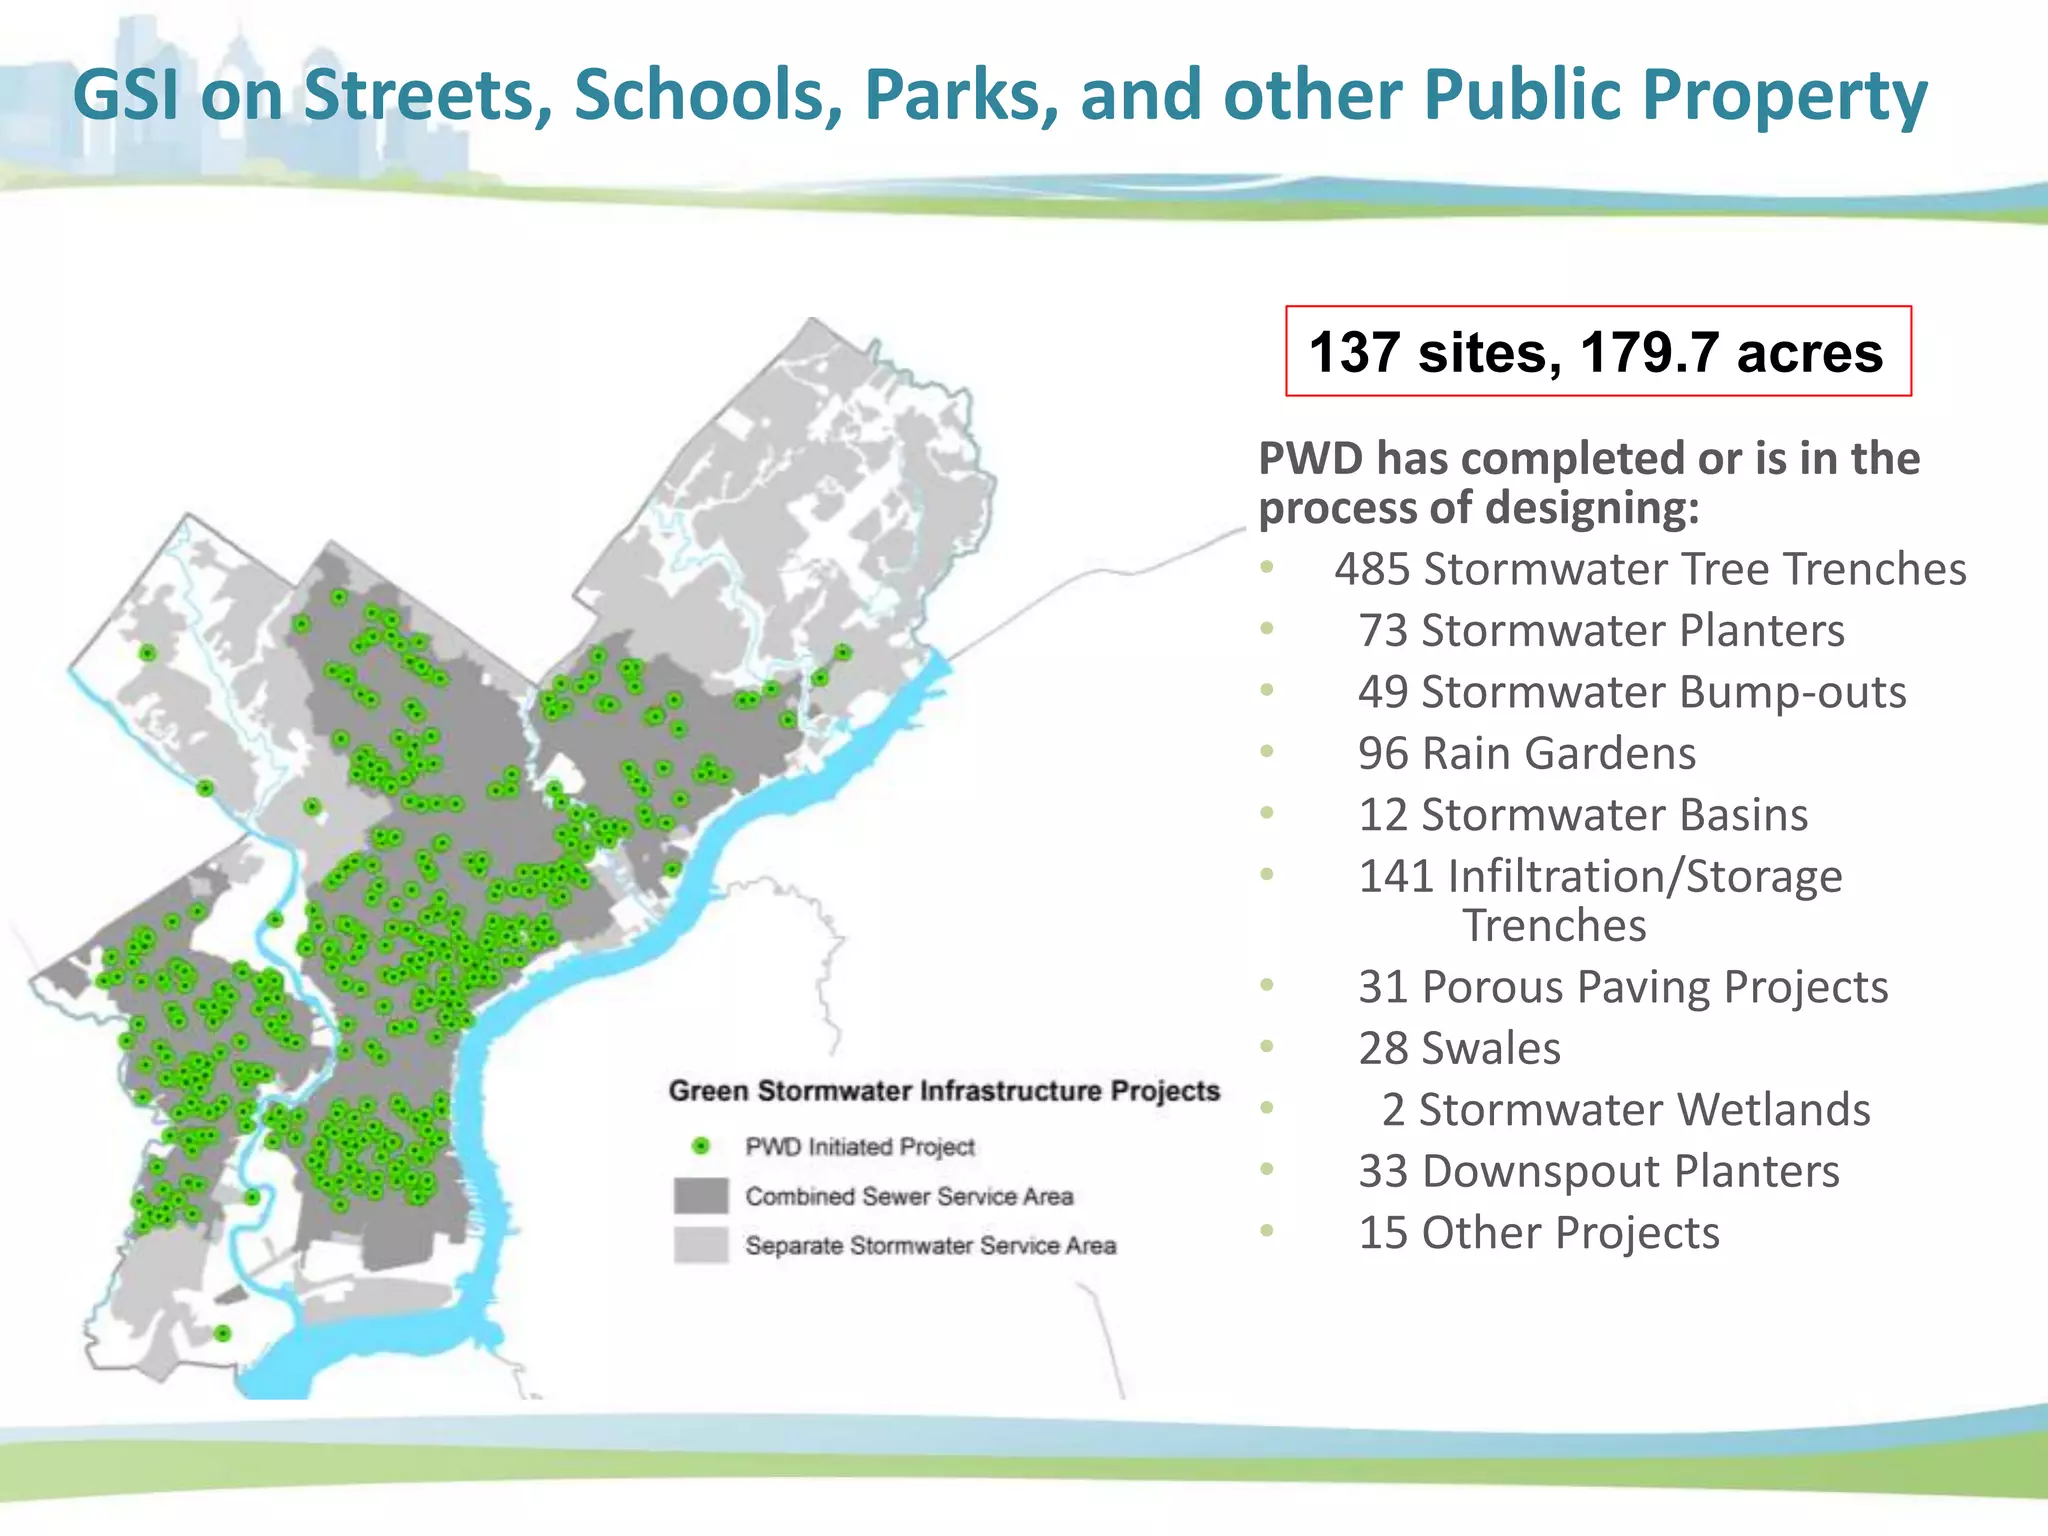
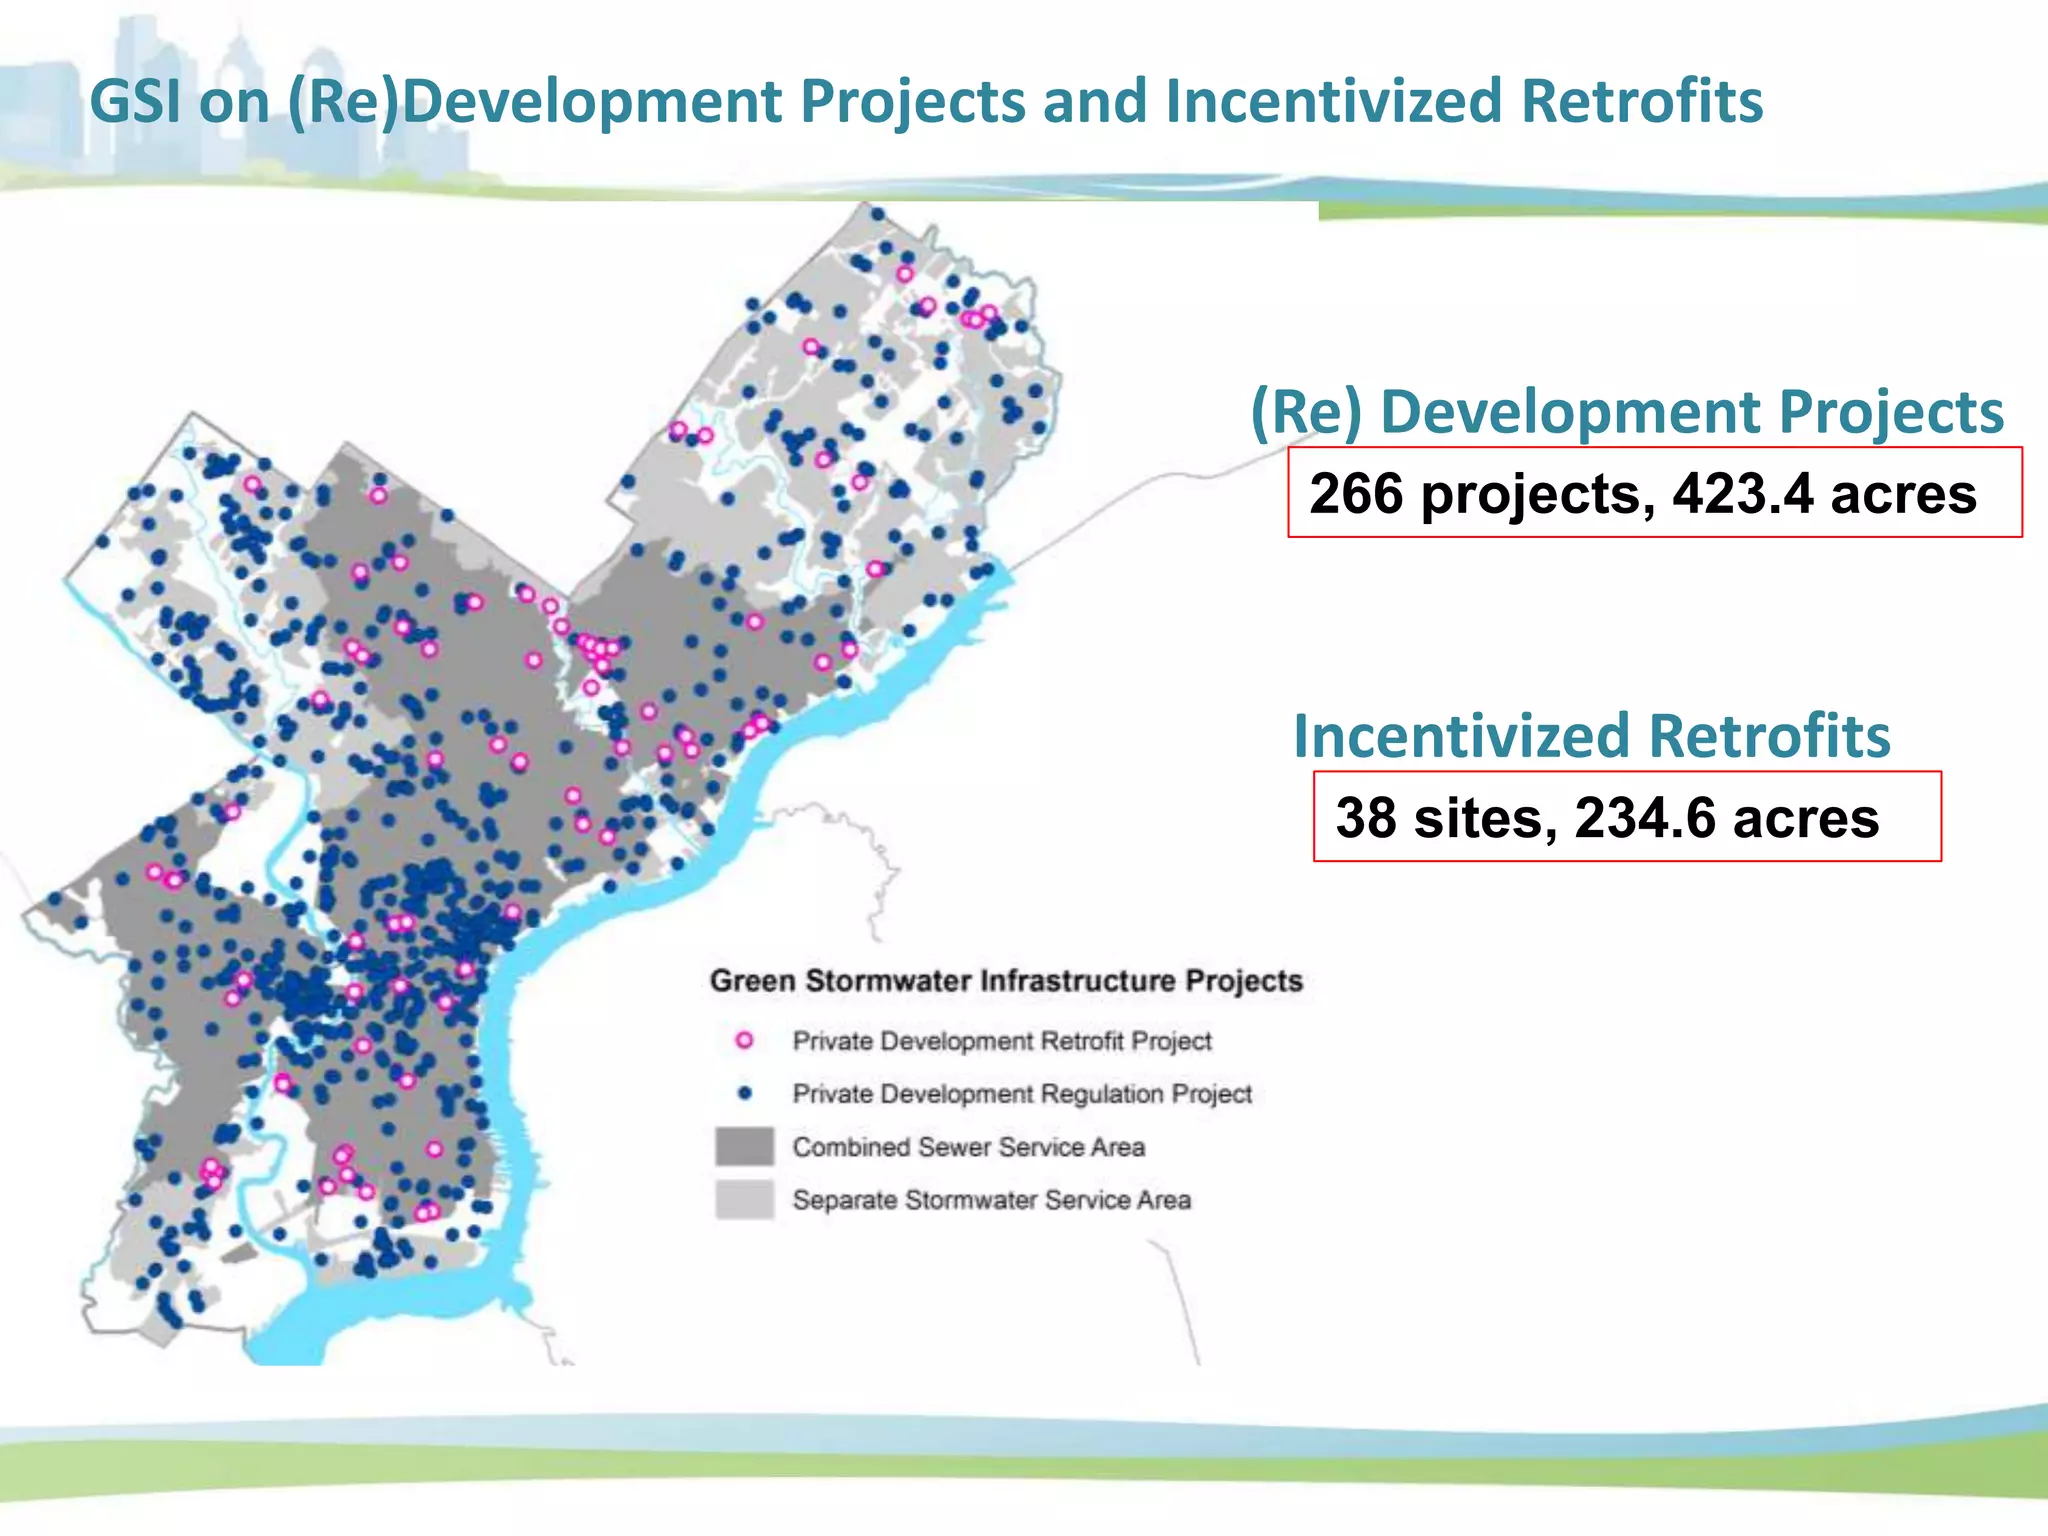
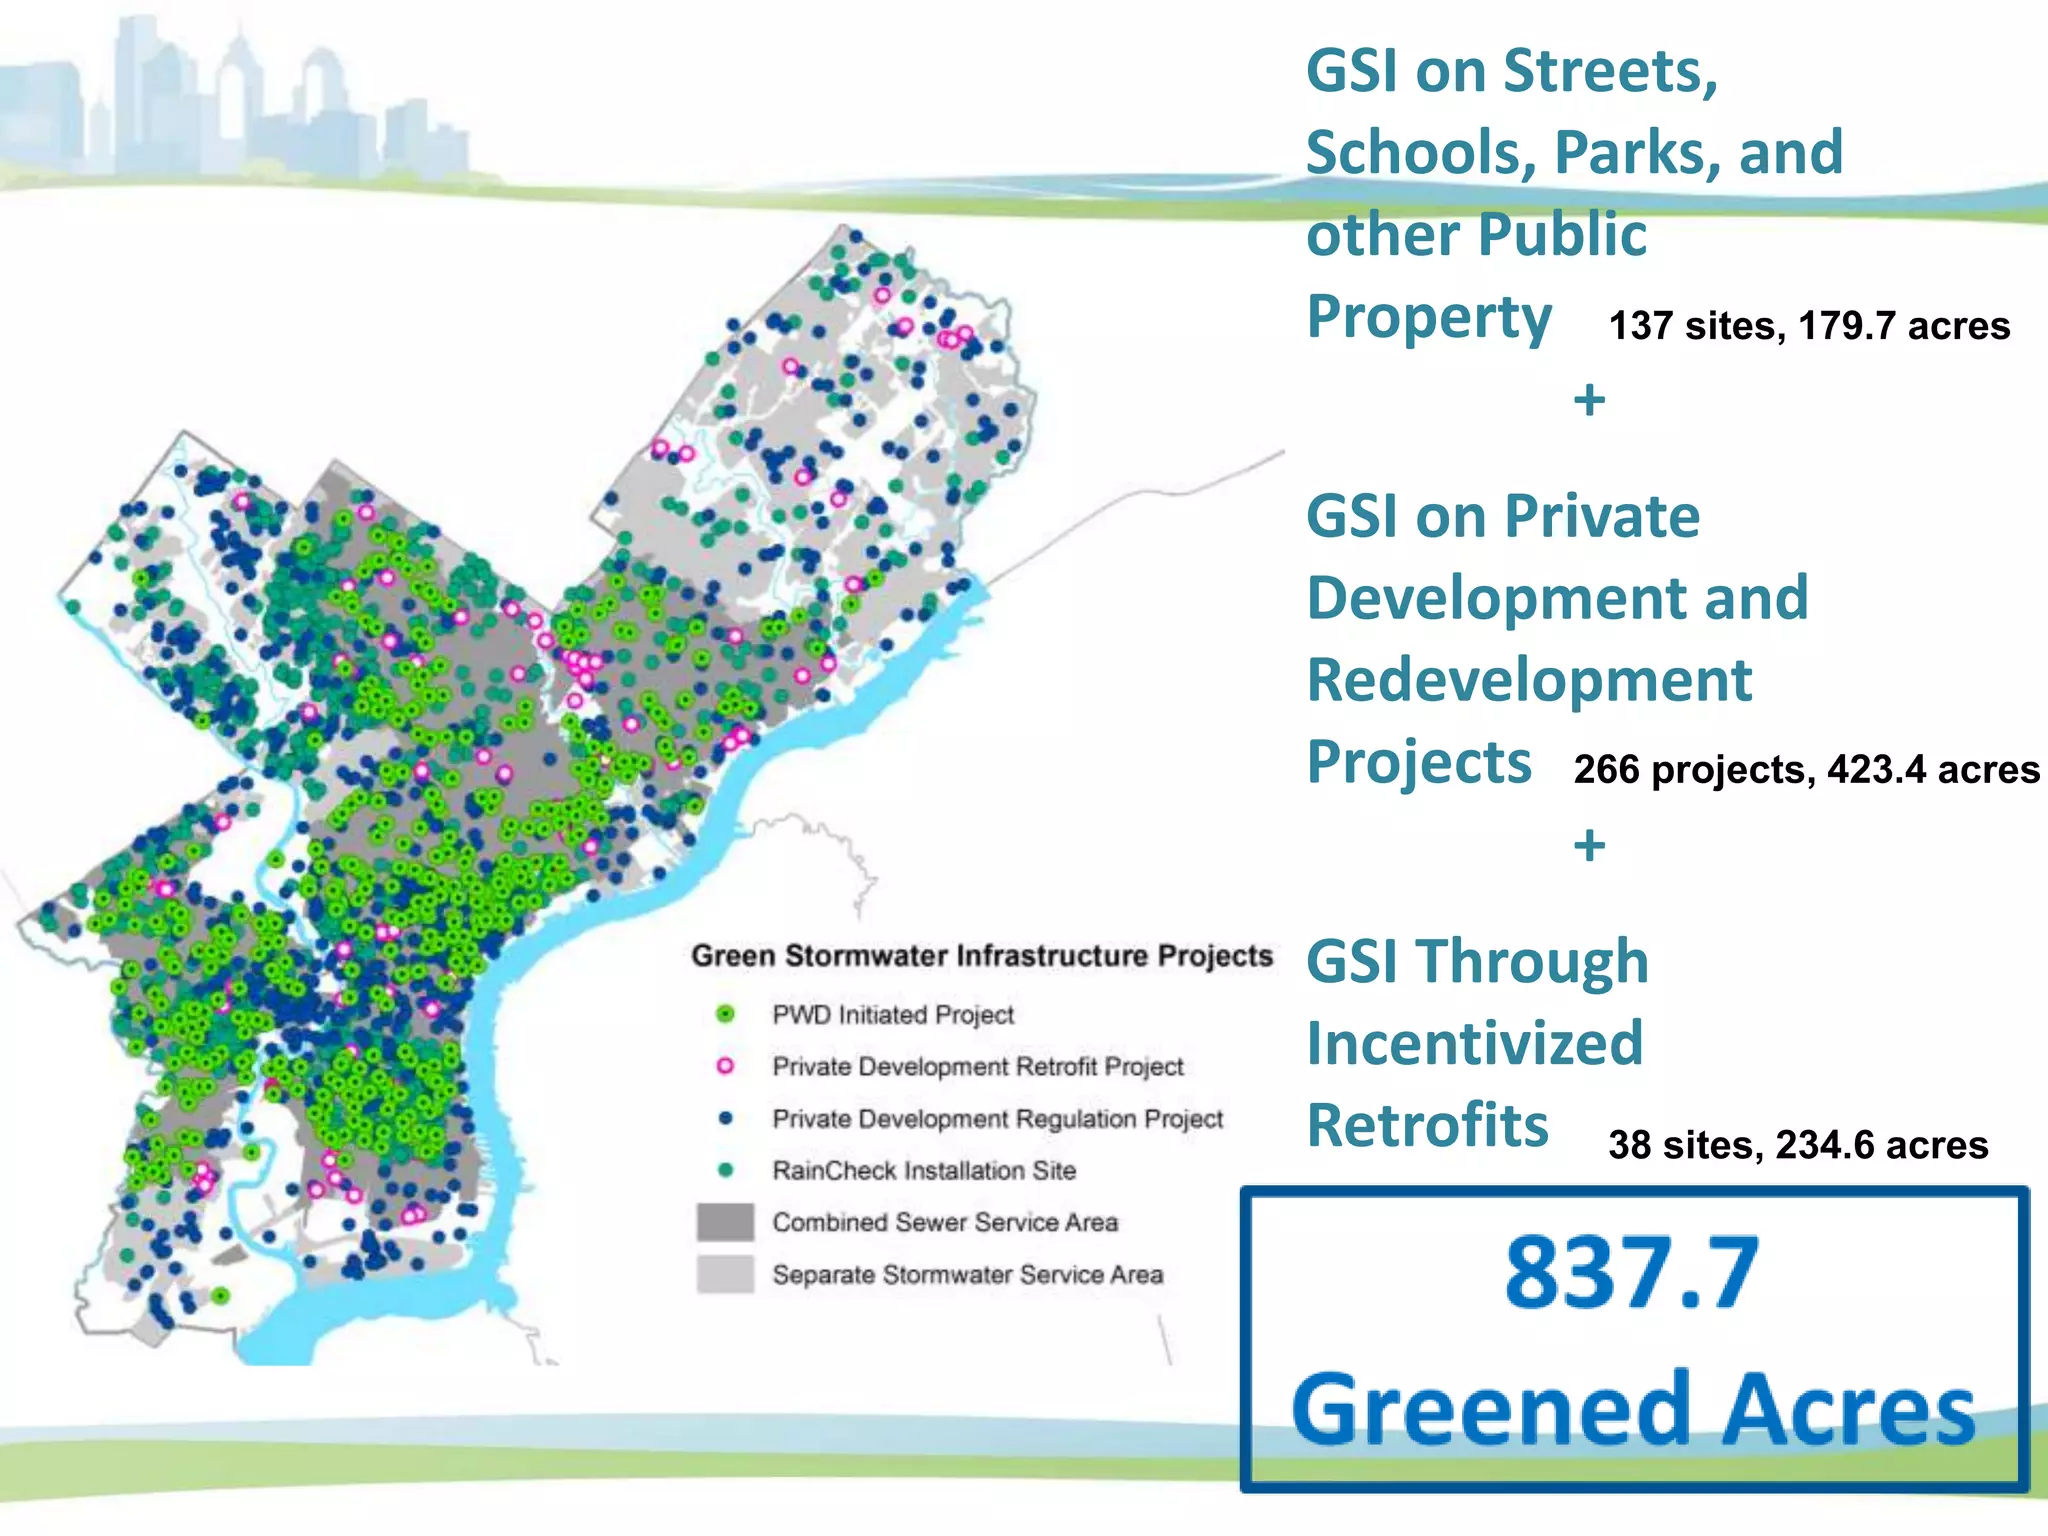
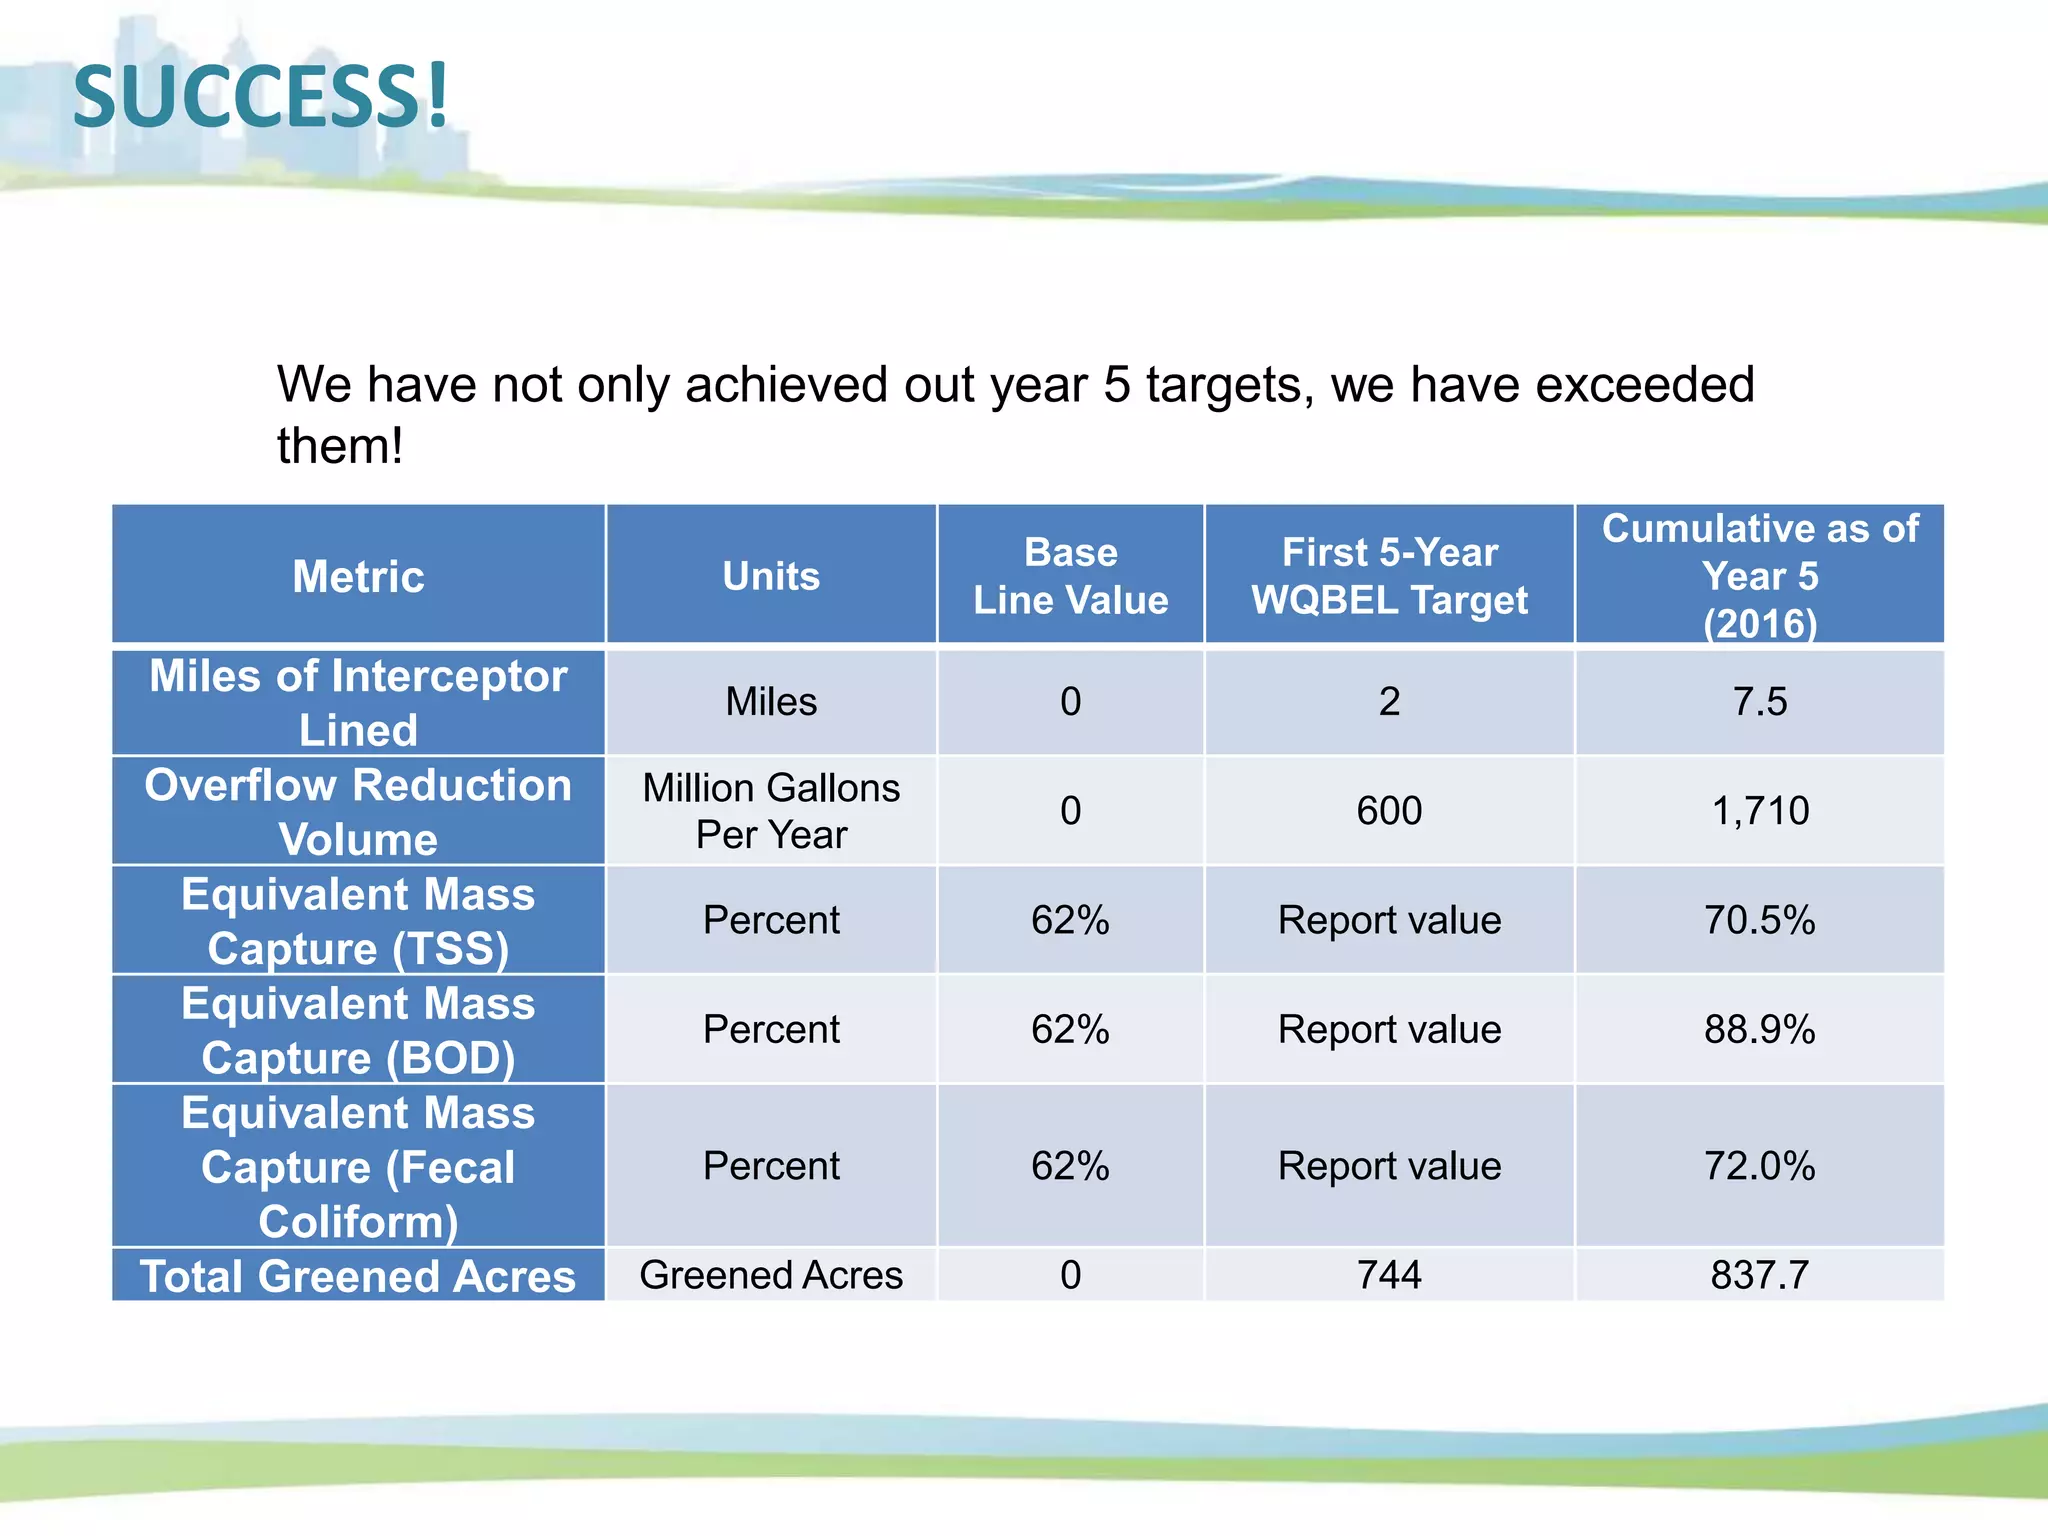
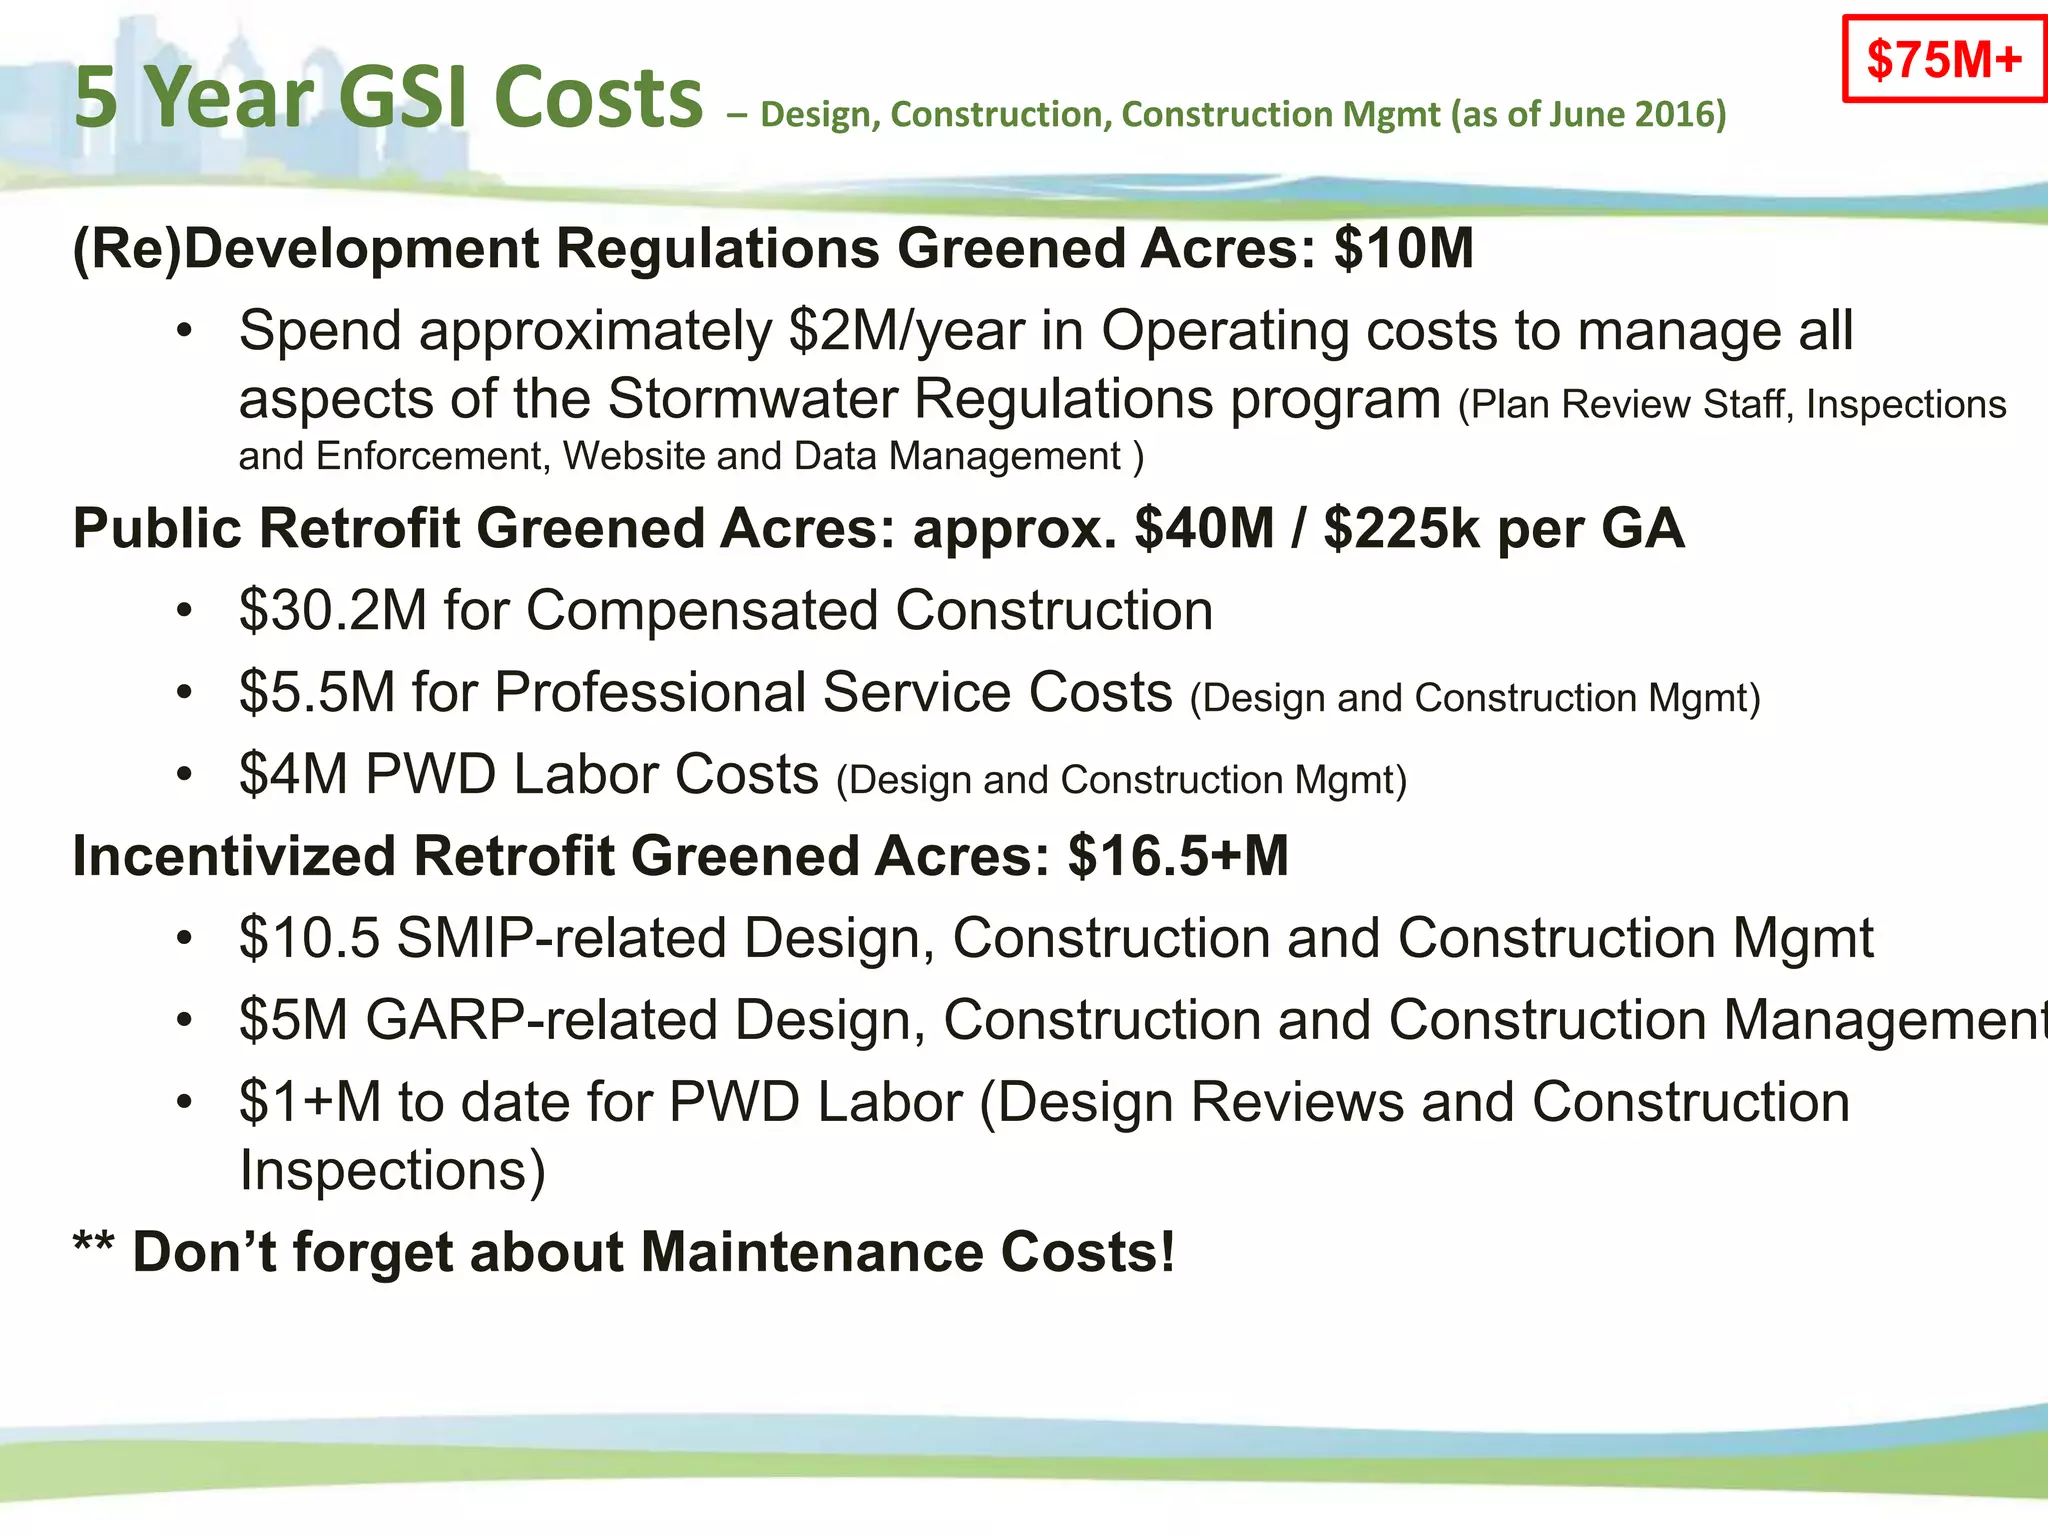
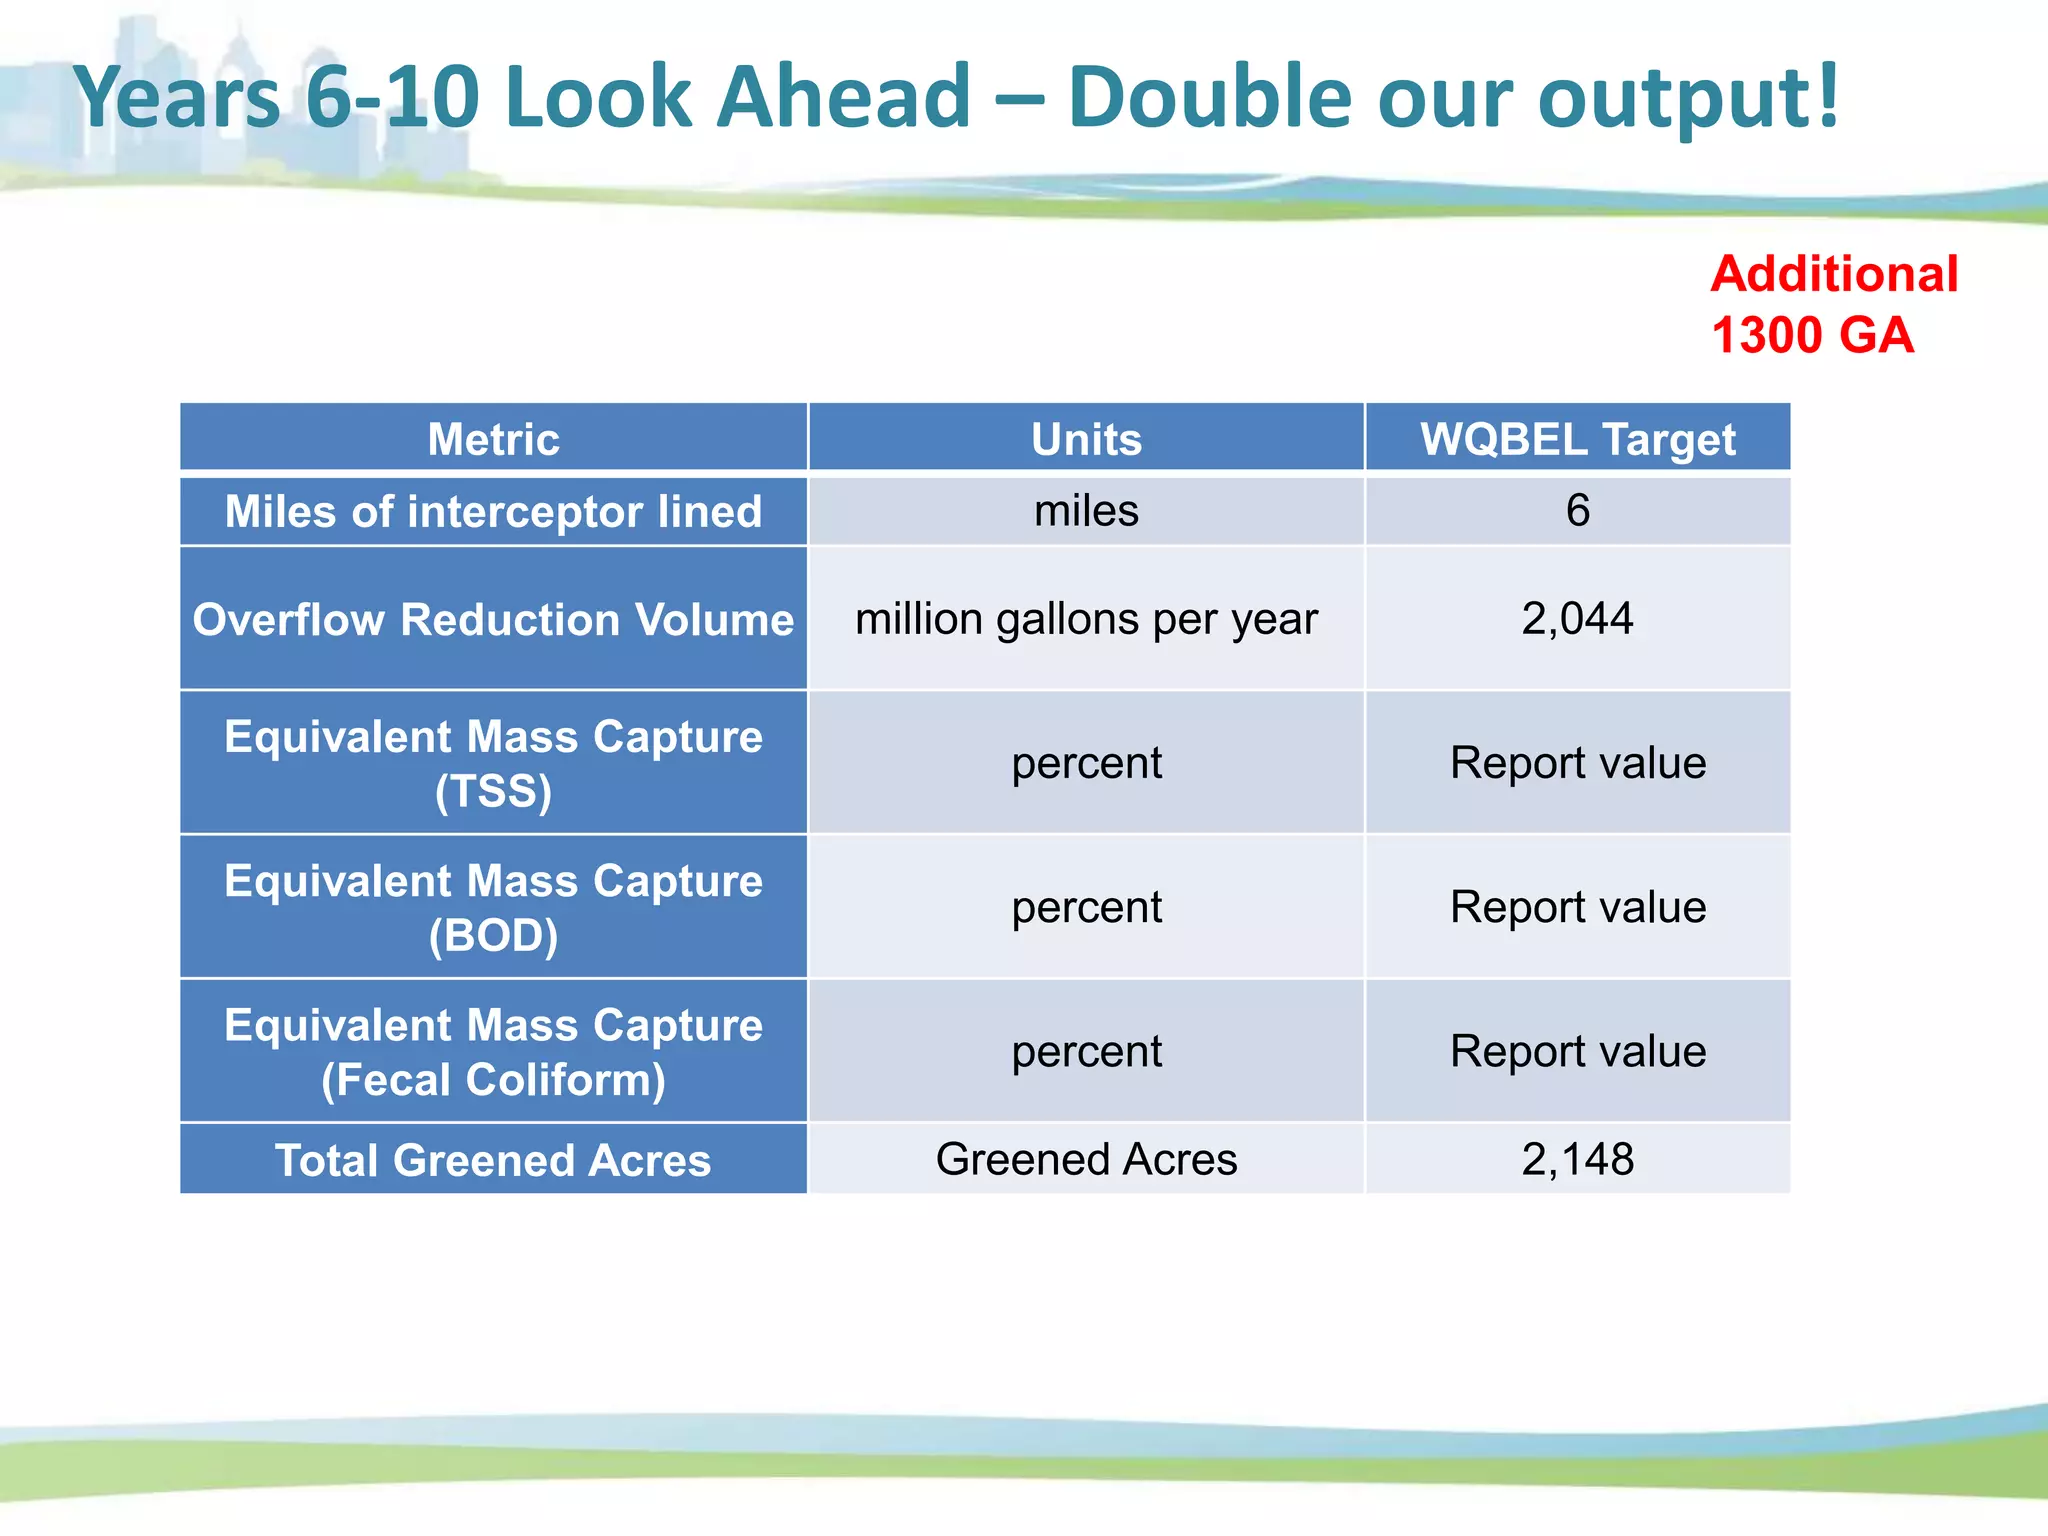
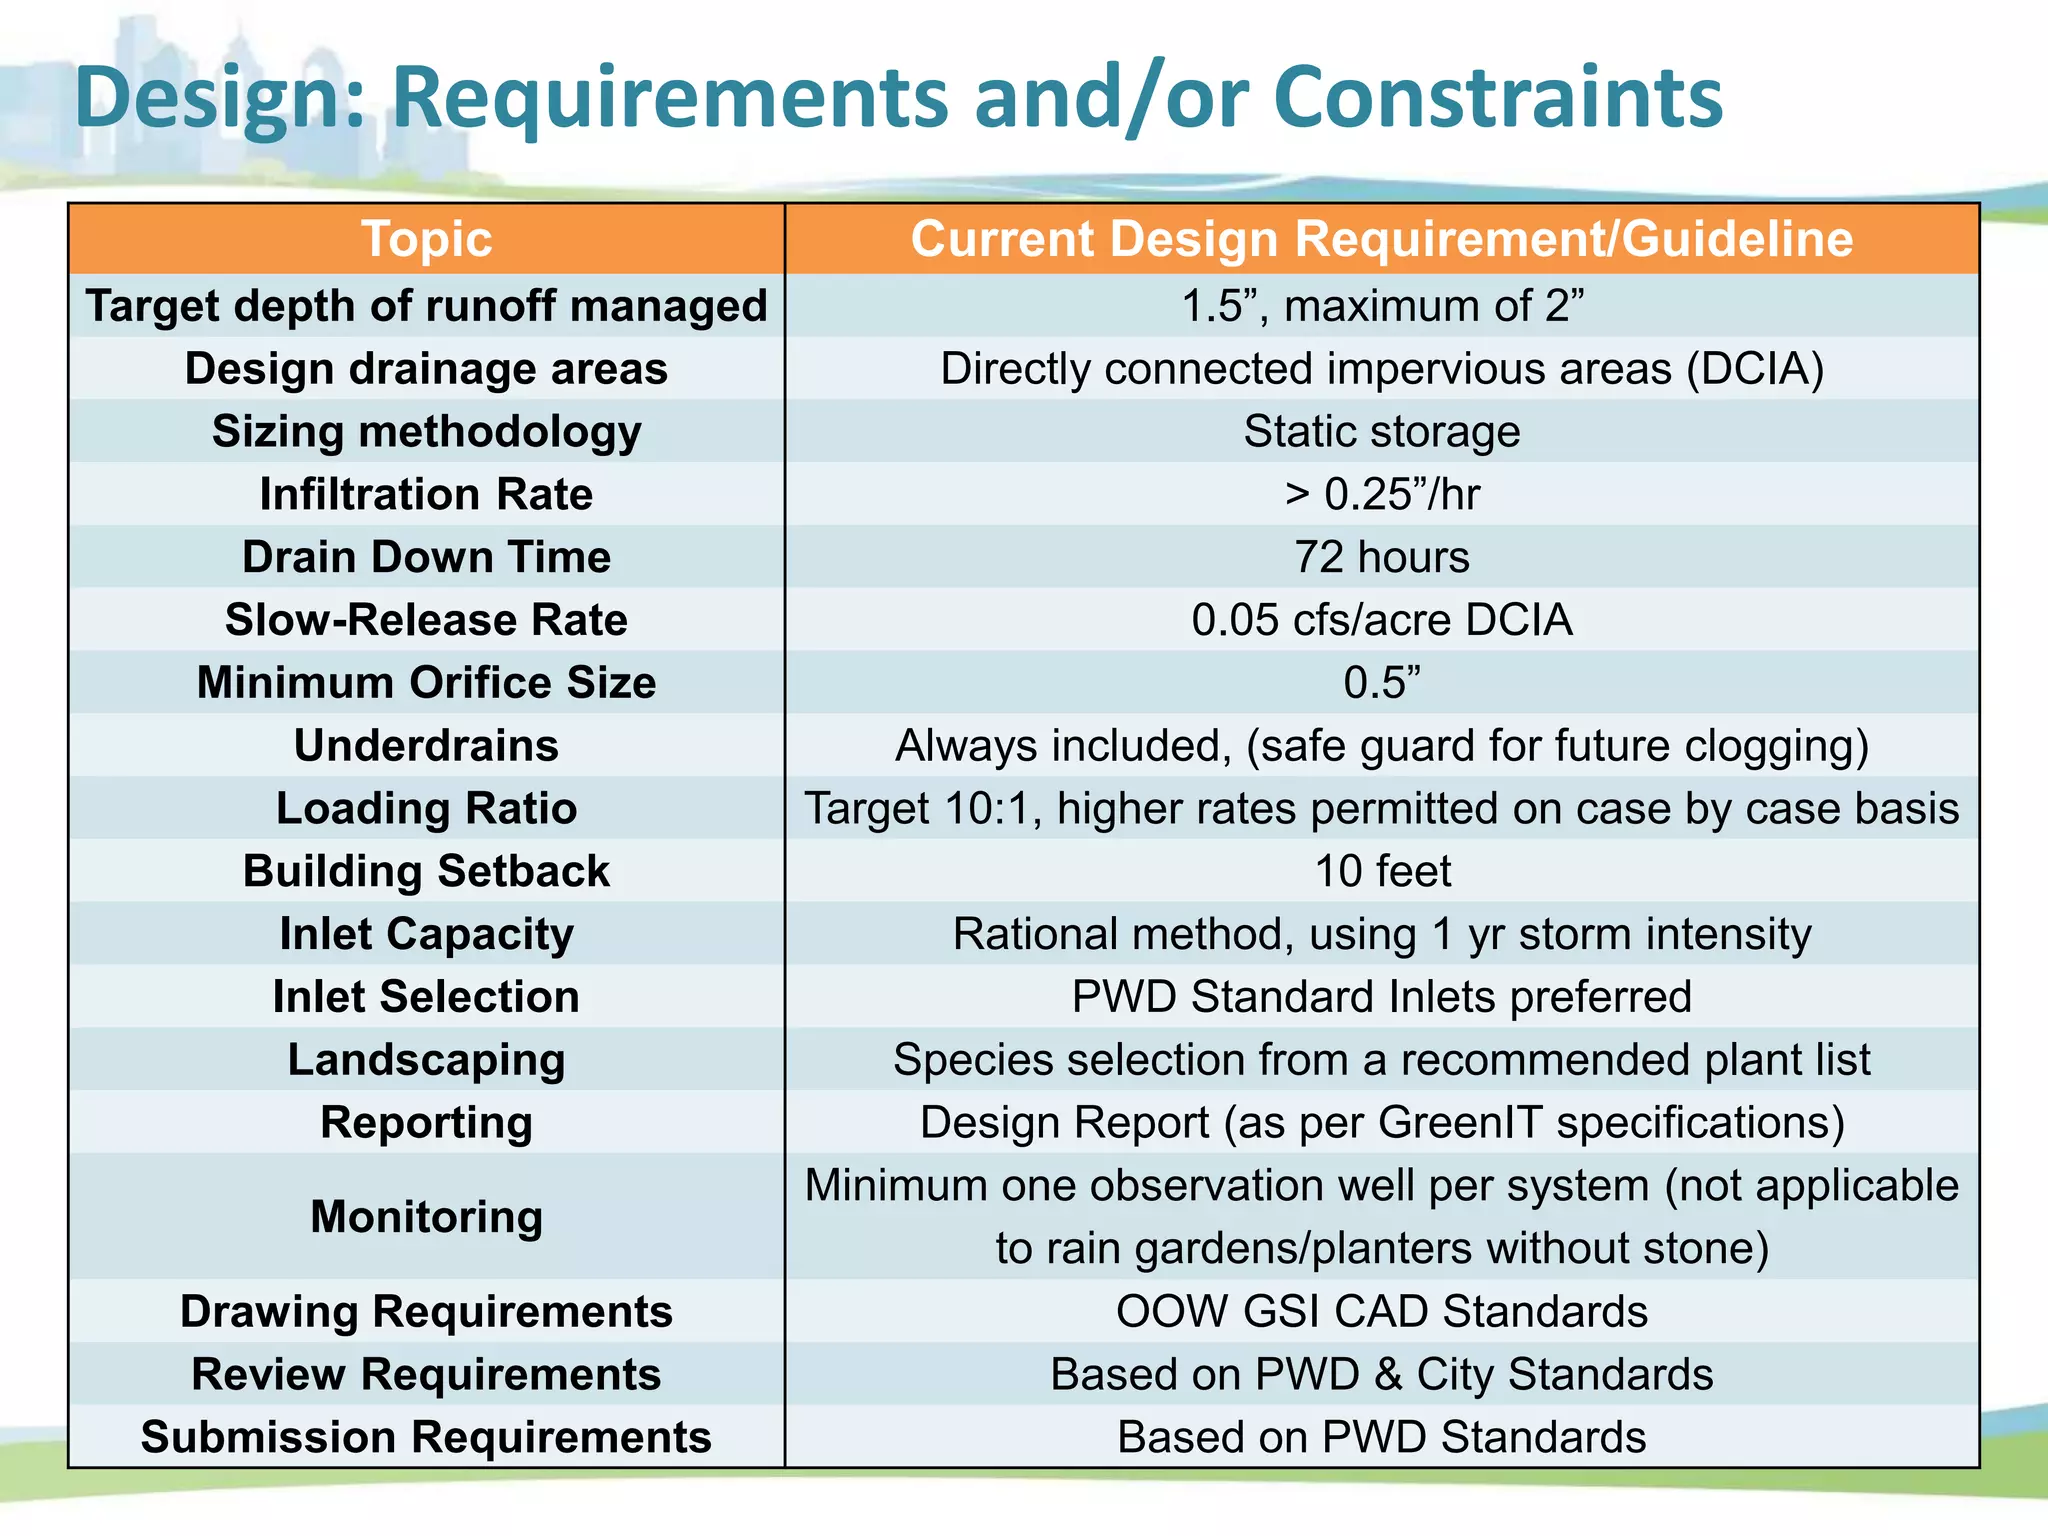
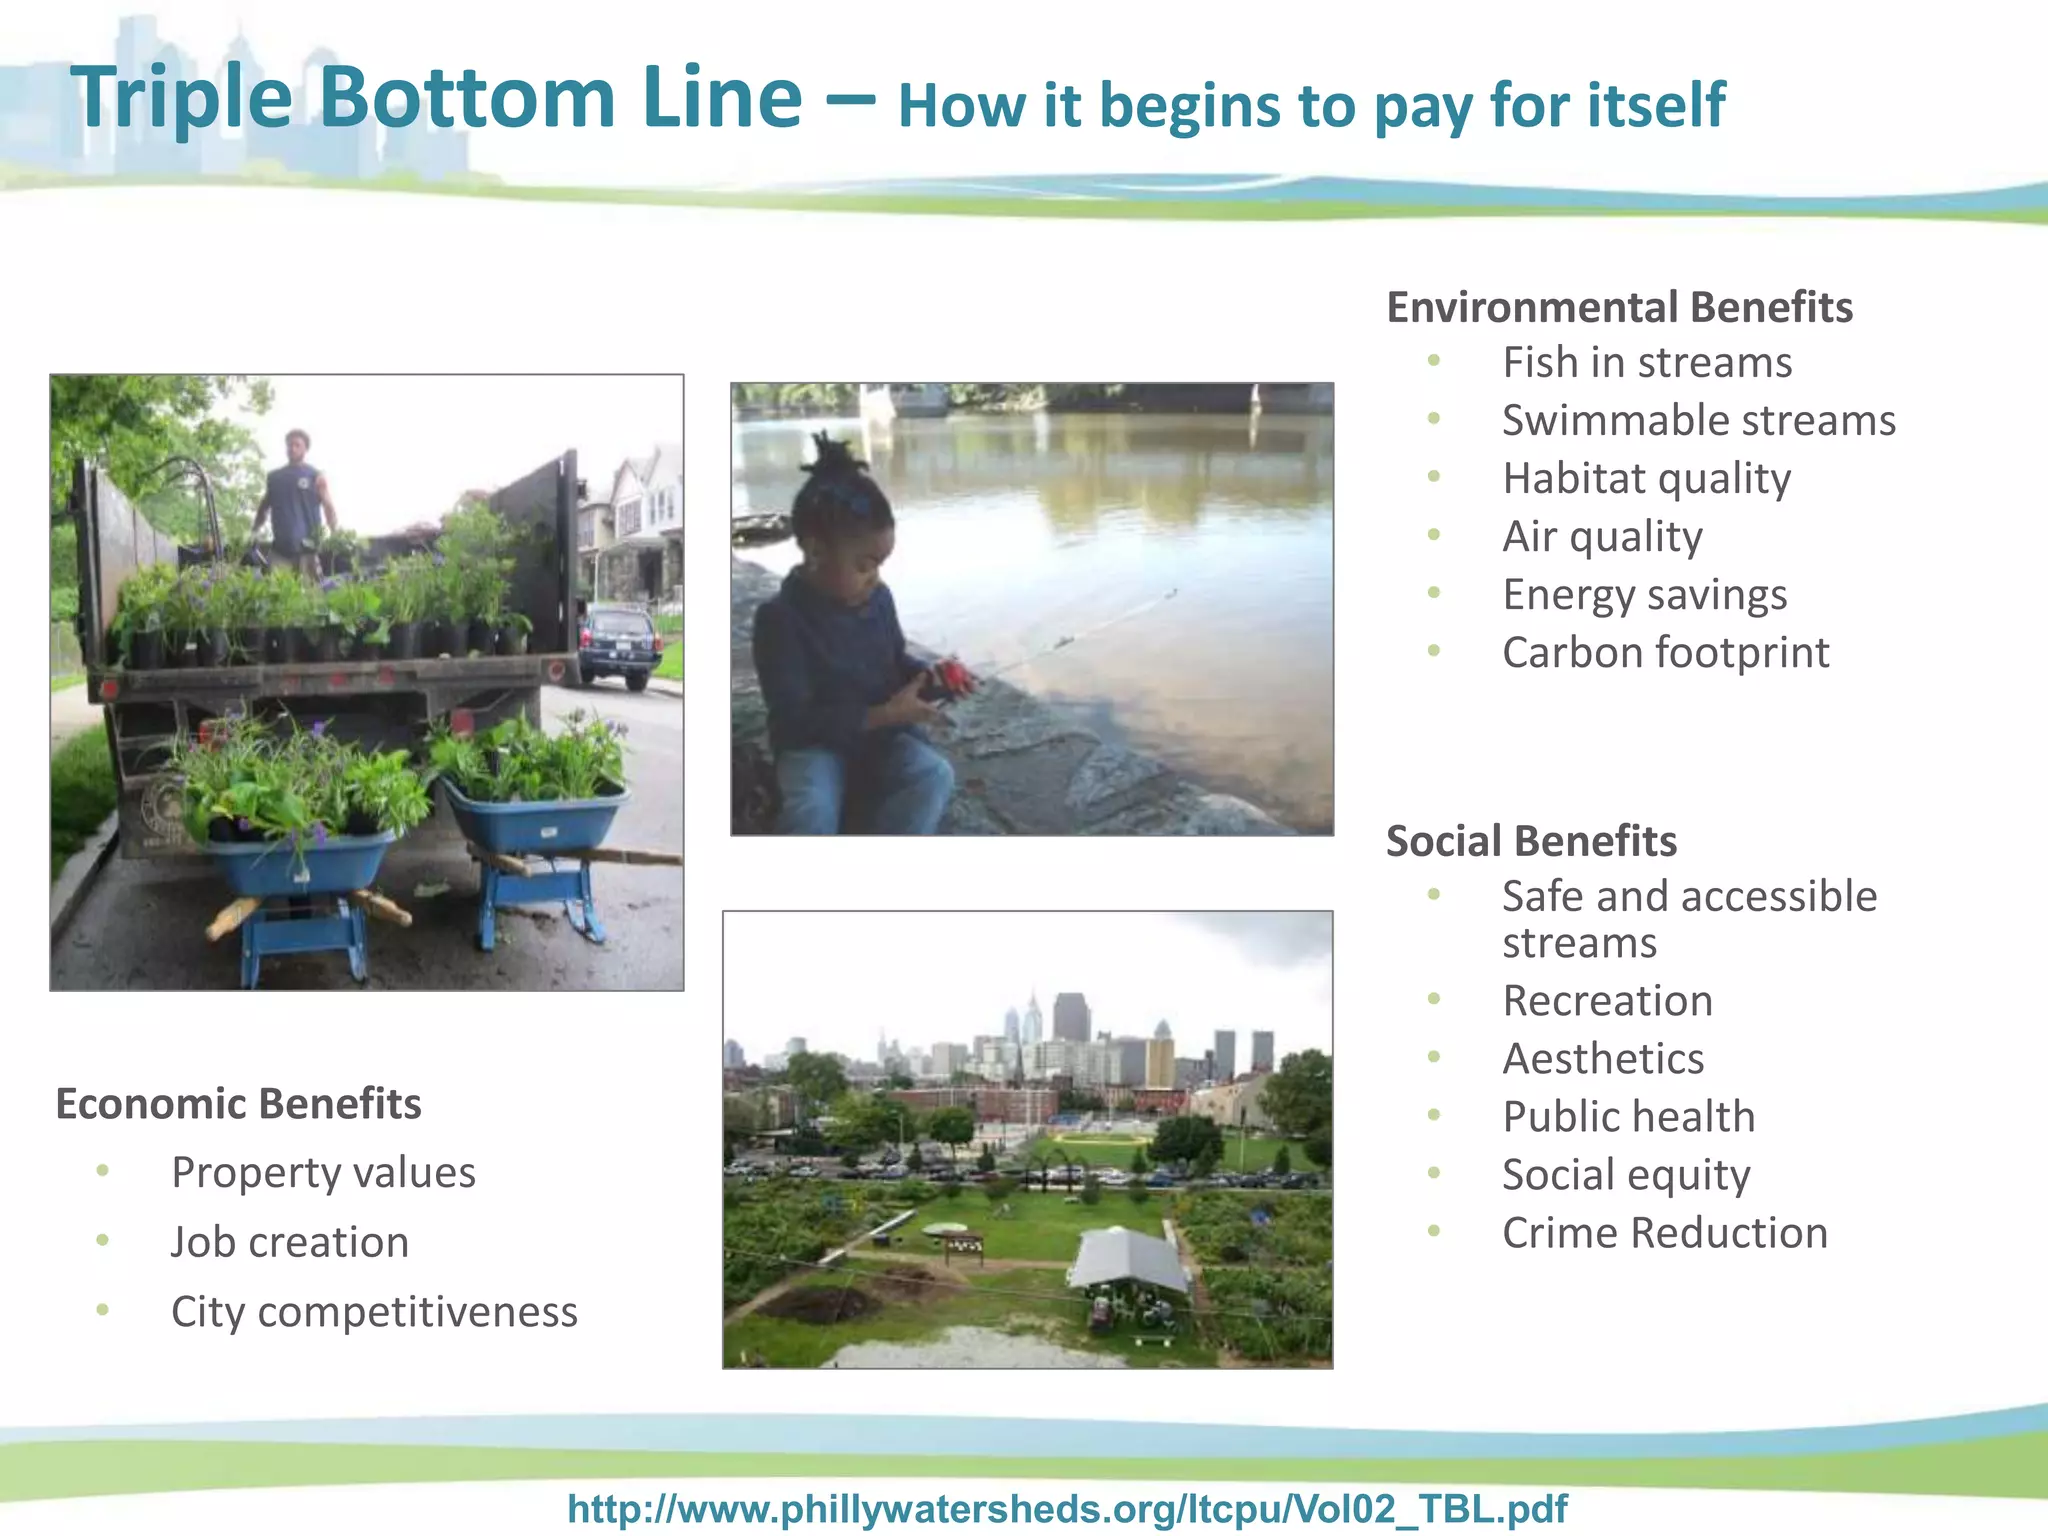
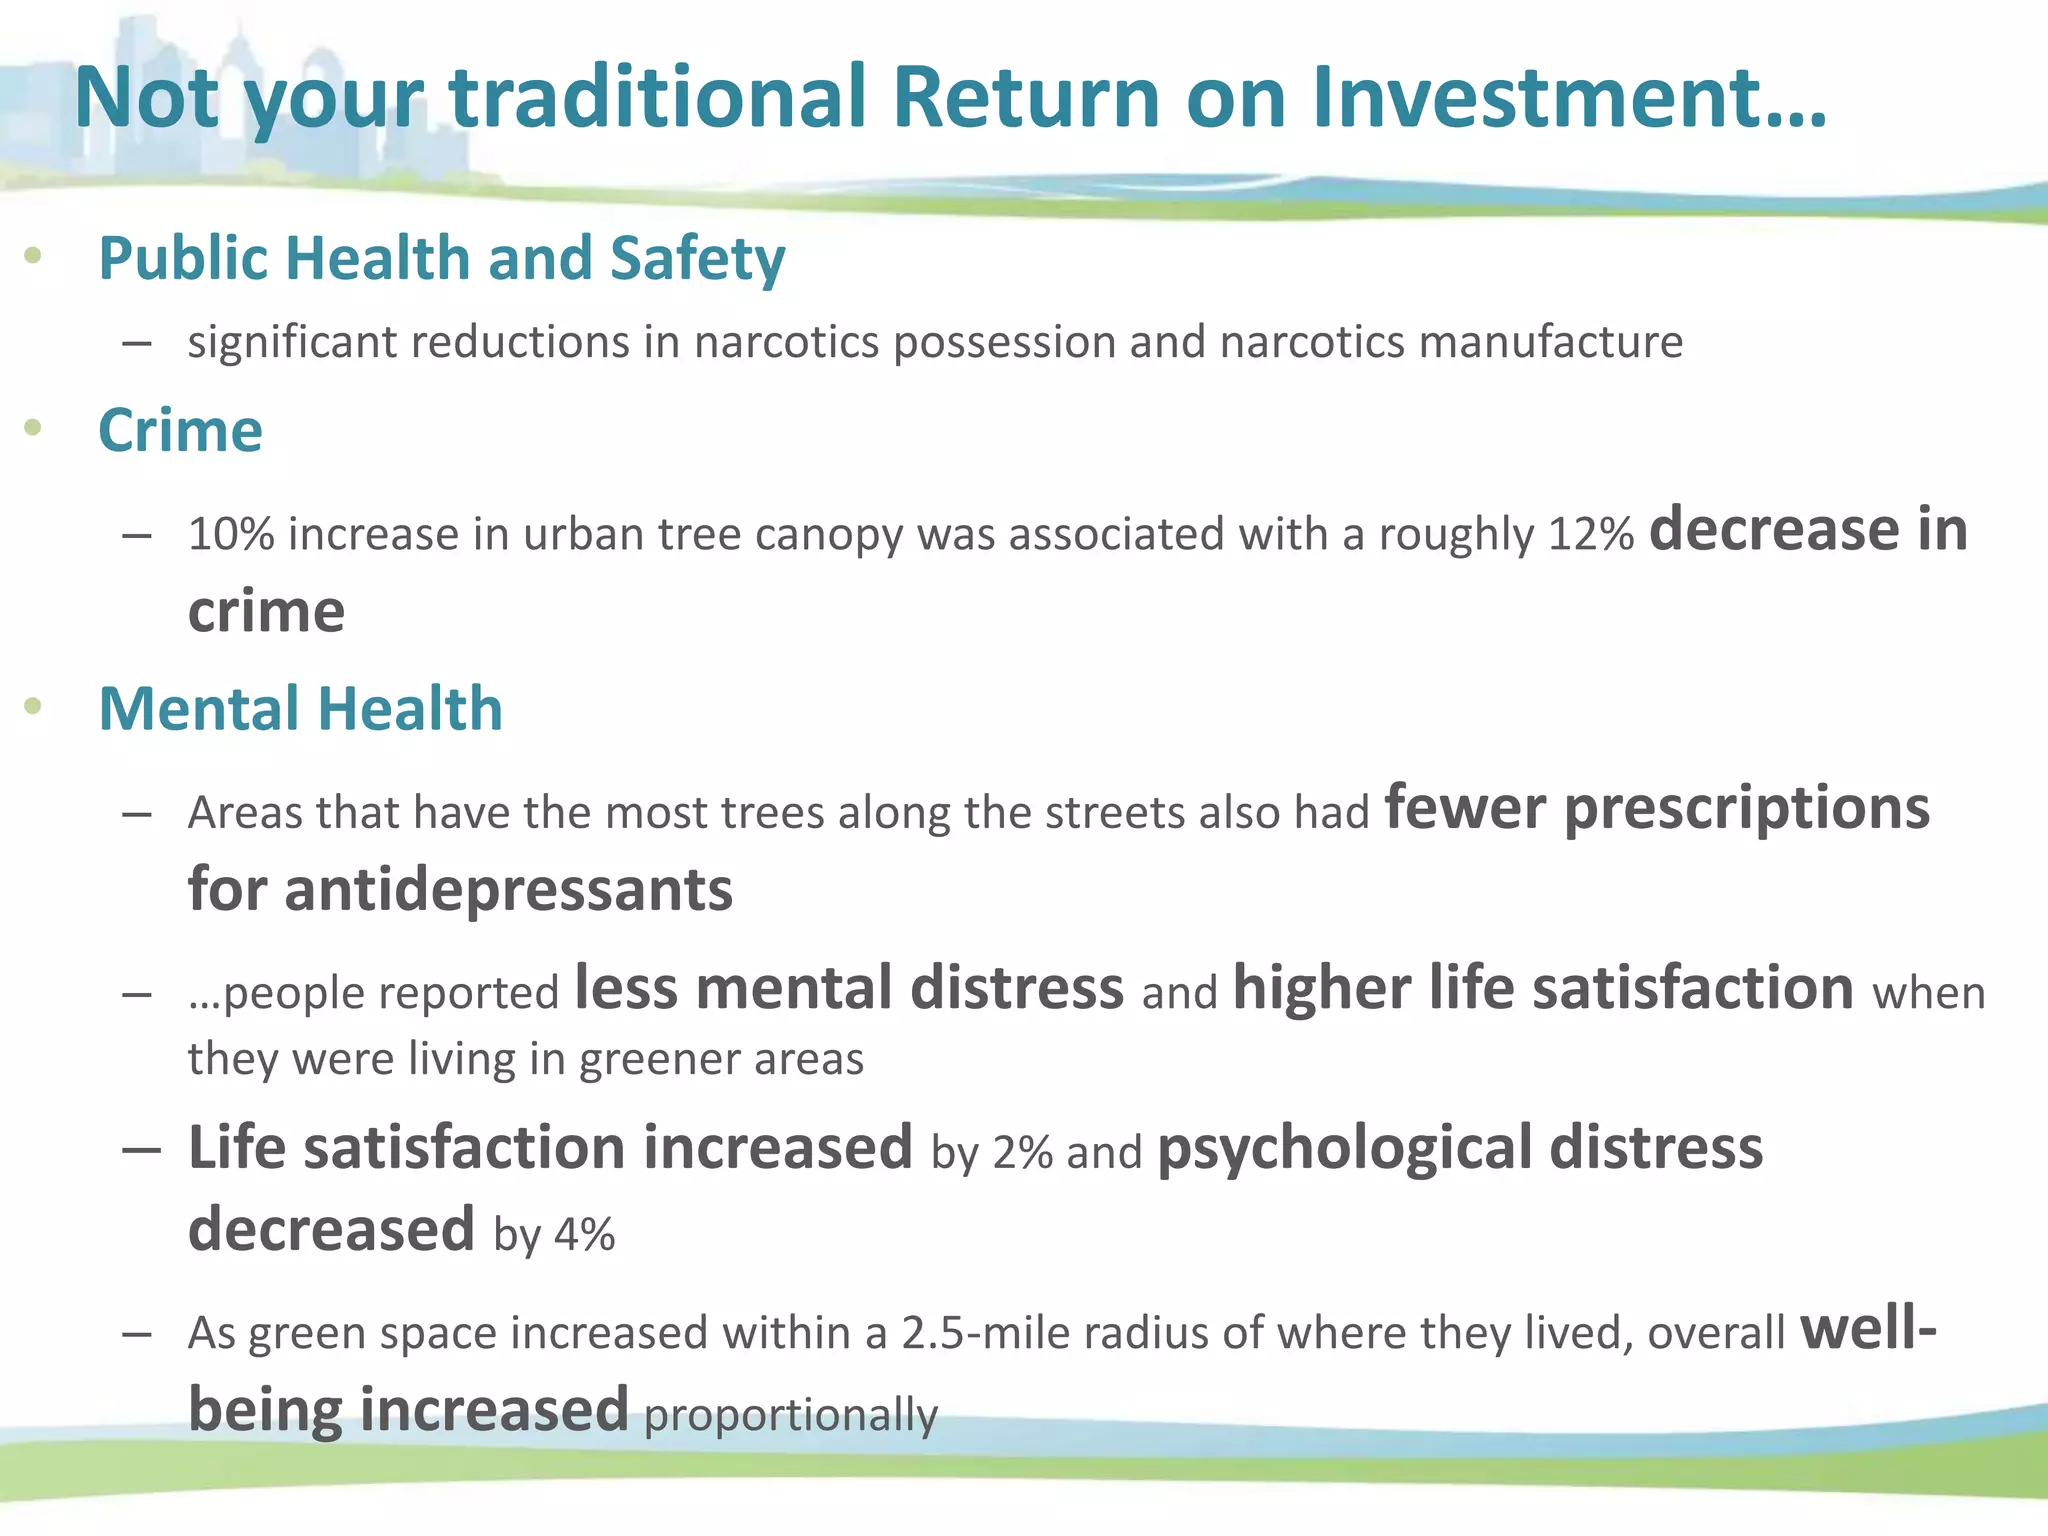
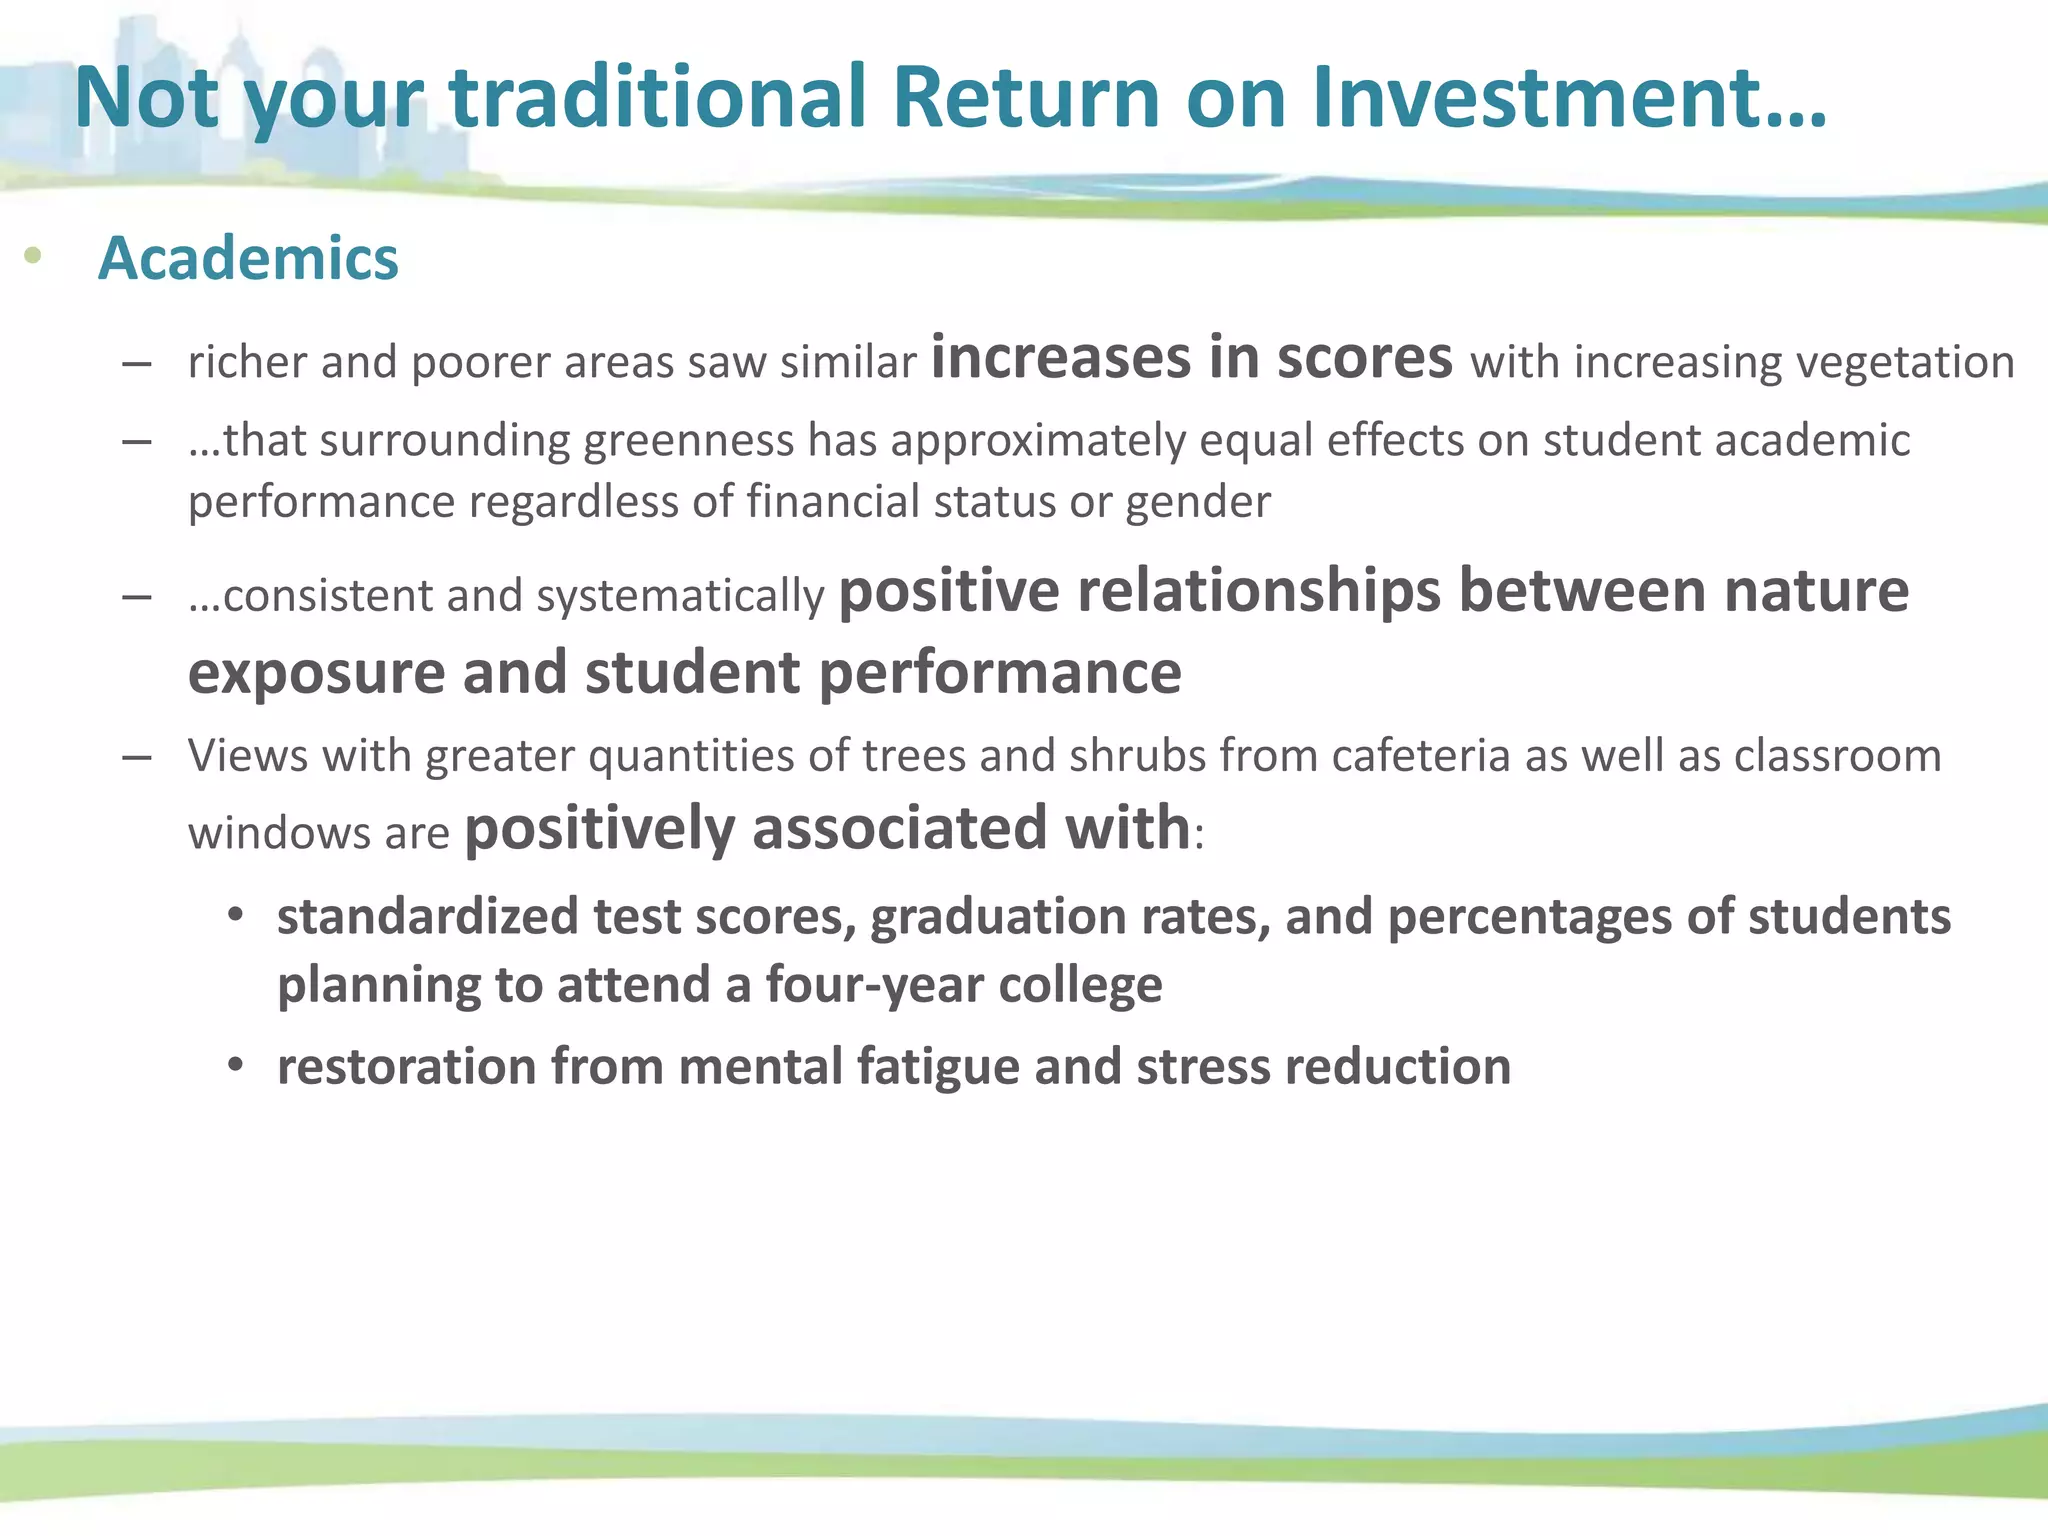
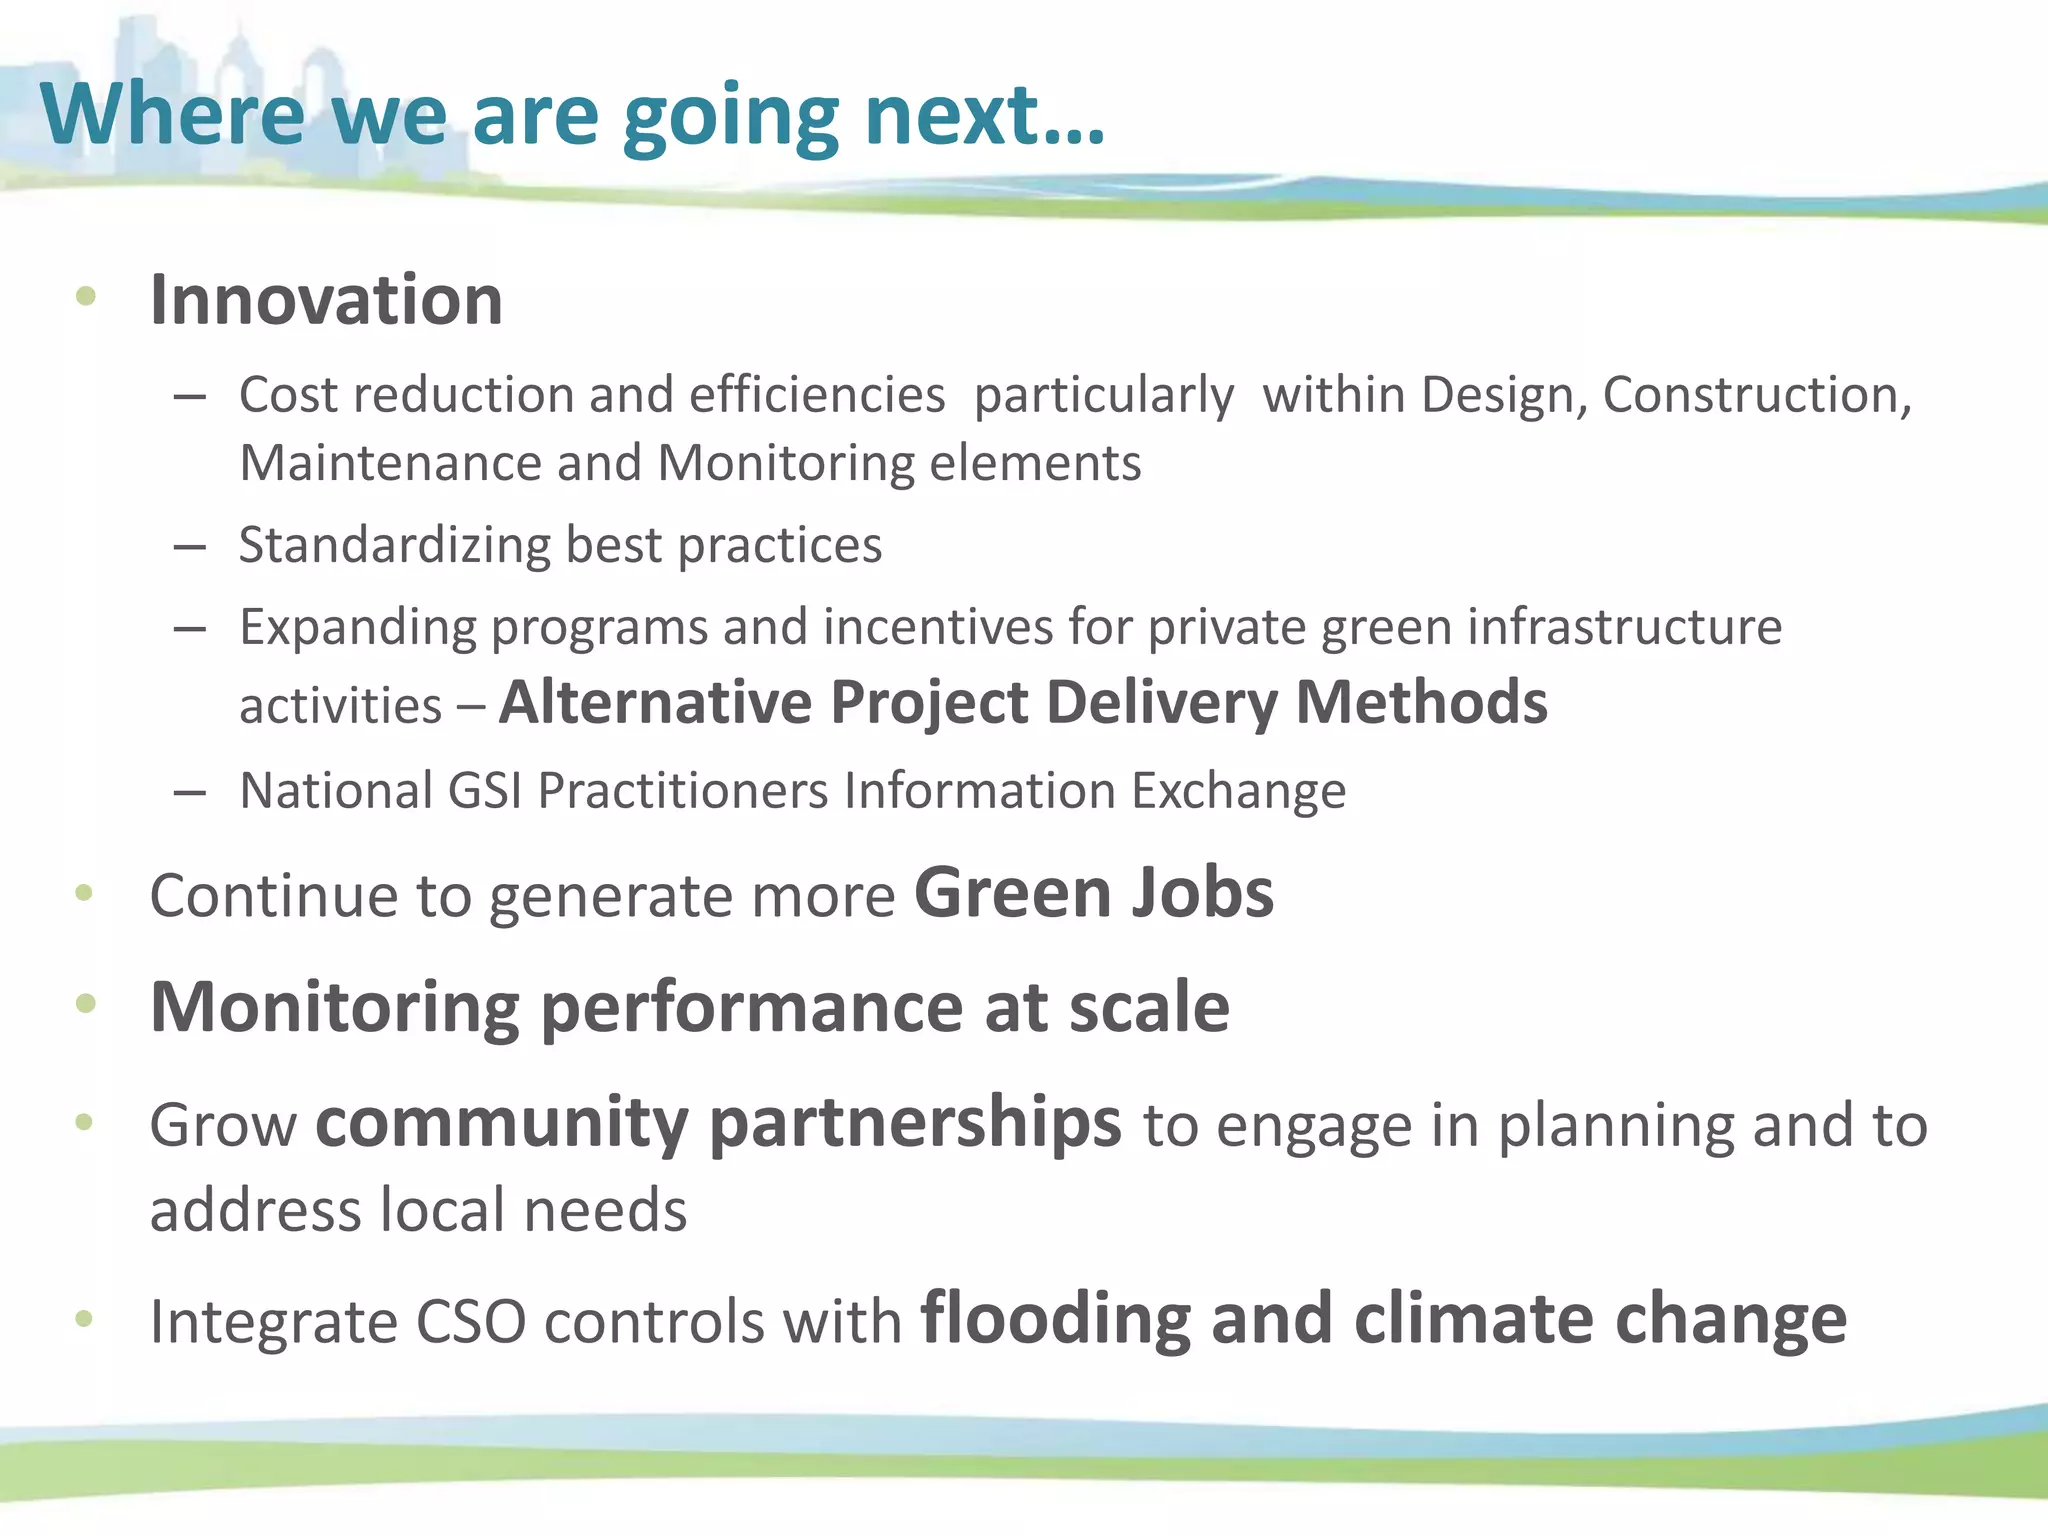
Green City, Clean Waters
The City of Philadelphia’s Combined Sewer Overflow Long Term
Control Plan Update
Green City, Clean Waters
Metric Units
Cumulative amount
as of Year 25
(2036)
NE / SW / SE WPCP
upgrade: Design &
Construction
Percent complete 100%
Miles of interceptor lined Miles 14.5
Overflow Reduction
Volume
Million Gallons per
year
7,960
Equivalent Mass Capture
TSS / BOD / Fecal
Coliform
Percent 85%
Total Greened Acres Greened Acres 9,564
Consent Order and Agreement Requirements
Green Infrastructure
Bureau of Laboratory Science planters Columbus Square planters
George W. Nebinger School rain garden
Kemble Park rain garden
Greened Acre = IC * Wd
Impervious
Cover
Runoff
Depth
Opportunities & Barriers
Year Greened Acres Square Miles
% Impervious
cover managed
5 750 1 3%
10 2,100 3 8%
15 3,800 6 14%
20 6,400 10 23%
25 9,600 15 34%
25-Year Implementation of Green City, Clean Waters
Green Stormwater Infrastructure Requirements
Assumes GSI
storage equivalent to
1.0 inch of runoff
Southeast Philadelphia (10th & Moyamensing), photo by Andrew Dobshinsky
Pathway to Green
$$$$$ $ $$
Public Investments: Streets, Parks & Schools
Opportunities & Barriers
Public Investments: Streets, Parks & Schools
Photo : Jenna Stamm , courtesy of The Trust for Public Land
Public Investments: Streets, Parks & Schools
Private Investment: Development Regulations
New Development & Redevelopment with earth disturbance
exceeding 15,000 square feet:
• Water Quality; Channel Protection; Flood Control
• Meets the definition of a greened acre and manages the first inch of
runoff
• Opportunity to leverage private development
Sites: Philadelphia Zoo, Shoemaker Green (Penn Campus), Paseo Verde (APM), Pashall Village (affordable housing), Radian (40th and Walnut)
Photo Credits: WRT and Paul Rider
Local Business:
PWD Storm water pioneer
Development:
Granary Green Roof
Private Investment: Development Regulations
Public/Private Investments: Incentivized Retrofits
• Up to 80% credit for the management of 1” of stormwater
• 1 acre parcel pays $500/mo, $5600/yr for stormwater / Managing 1” over
property lowers bill to $100/mo, $1100/yr
Rain Garden
Porous Pavement
Sub-surface Detention PondGreen Roof
Surface Detention Pond
Stormwater Wetland
Greene Street Friends School
Public/Private Investments: Incentivized Retrofits
Dependable Distribution
Wharton Street Lofts
You can do it
anywhere!
GSI on Streets, Schools, Parks, and other Public Property
PWD has completed or is in the
process of designing:
• 485 Stormwater Tree Trenches
• 73 Stormwater Planters
• 49 Stormwater Bump-outs
• 96 Rain Gardens
• 12 Stormwater Basins
• 141 Infiltration/Storage
Trenches
• 31 Porous Paving Projects
• 28 Swales
• 2 Stormwater Wetlands
• 33 Downspout Planters
• 15 Other Projects
137 sites, 179.7 acres
GSI on (Re)Development Projects and Incentivized Retrofits
266 projects, 423.4 acres
38 sites, 234.6 acres
(Re) Development Projects
Incentivized Retrofits
GSI on Streets,
Schools, Parks, and
other Public
Property
+
GSI on Private
Development and
Redevelopment
Projects
+
GSI Through
Incentivized
Retrofits
137 sites, 179.7 acres
266 projects, 423.4 acres
38 sites, 234.6 acres
SUCCESS!
Metric Units
Base
Line Value
First 5-Year
WQBEL Target
Cumulative as of
Year 5
(2016)
Miles of Interceptor
Lined
Miles 0 2 7.5
Overflow Reduction
Volume
Million Gallons
Per Year
0 600 1,710
Equivalent Mass
Capture (TSS)
Percent 62% Report value 70.5%
Equivalent Mass
Capture (BOD)
Percent 62% Report value 88.9%
Equivalent Mass
Capture (Fecal
Coliform)
Percent 62% Report value 72.0%
Total Greened Acres Greened Acres 0 744 837.7
We have not only achieved out year 5 targets, we have exceeded
them!
5 Year GSI Costs – Design, Construction, Construction Mgmt (as of June 2016)
(Re)Development Regulations Greened Acres: $10M
• Spend approximately $2M/year in Operating costs to manage all
aspects of the Stormwater Regulations program (Plan Review Staff, Inspections
and Enforcement, Website and Data Management )
Public Retrofit Greened Acres: approx. $40M / $225k per GA
• $30.2M for Compensated Construction
• $5.5M for Professional Service Costs (Design and Construction Mgmt)
• $4M PWD Labor Costs (Design and Construction Mgmt)
Incentivized Retrofit Greened Acres: $16.5+M
• $10.5 SMIP-related Design, Construction and Construction Mgmt
• $5M GARP-related Design, Construction and Construction Management
• $1+M to date for PWD Labor (Design Reviews and Construction
Inspections)
** Don’t forget about Maintenance Costs!
$75M+
Years 6-10 Look Ahead – Double our output!
Metric Units WQBEL Target
Miles of interceptor lined miles 6
Overflow Reduction Volume million gallons per year 2,044
Equivalent Mass Capture
(TSS)
percent Report value
Equivalent Mass Capture
(BOD)
percent Report value
Equivalent Mass Capture
(Fecal Coliform)
percent Report value
Total Greened Acres Greened Acres 2,148
Additional
1300 GA
• GSI Planning Guidelines
• GSI Design Process Workflow Packet
• GSI Design Requirements & Guidelines
• GSI Drawing Requirements Packet
– GSI CAD Standards
• GSI Standard Details
• GSI Project Implementation Workflows
• Landscape Guidebook
www.phillywatersheds.org/gsi_design_resources
Planning and Design | Key Resources
Stormwater Tree Trench
Stormwater Planter
Permeable Pavement
Rain Garden
Planning | Large Area Disconnection
Analysis for Large Area Disconnection (LAD)
is performed when there are open space
areas that appear to provide the
opportunity to manage runoff from areas
beyond those immediately adjacent to the
site.
Topic Current Design Requirement/Guideline
Target depth of runoff managed 1.5”, maximum of 2”
Design drainage areas Directly connected impervious areas (DCIA)
Sizing methodology Static storage
Infiltration Rate > 0.25”/hr
Drain Down Time 72 hours
Slow-Release Rate 0.05 cfs/acre DCIA
Minimum Orifice Size 0.5”
Underdrains Always included, (safe guard for future clogging)
Loading Ratio Target 10:1, higher rates permitted on case by case basis
Building Setback 10 feet
Inlet Capacity Rational method, using 1 yr storm intensity
Inlet Selection PWD Standard Inlets preferred
Landscaping Species selection from a recommended plant list
Reporting Design Report (as per GreenIT specifications)
Monitoring
Minimum one observation well per system (not applicable
to rain gardens/planters without stone)
Drawing Requirements OOW GSI CAD Standards
Review Requirements Based on PWD & City Standards
Submission Requirements Based on PWD Standards
Design: Requirements and/or Constraints
Construction
• Soil Compaction
• Erosion and Sediment
Controls
• Prime/Sub Supervision and
Communication
• Warranties
• Material availability and
integrity
• Landscaping
• Grading
• Small tolerances
• Punchlist items
Inspection:
•Visual/photographic
•Record condition of vegetative and structural
features
•Measure sediment and water levels
Maintenance:
•Trash and sediment removal
•Weeding, pruning, etc.
•New product testing
•Structural repairs
•Erosion control
•Reseeding / Watering
Reporting:
•Labor effort and materials required to
maintain each site
Creating Standards and Protocols:
•Required tools and Crew Size
•Frequency of visits
•Responsible party
Maintenance
Opportunities & Barriers
Diversity: Resources and Workforce
Professional Services
Contracts
City Workforce
Adoption Programs
Requirements ContractsSpecial Service Districts
PowerCorpsPHL
Equipment, Materials,
Supplies Contracts
Business Improvement
Districts
PowerCorpsPHL
The Importance of Monitoring
“Information from pilot projects will be collected to develop a cost
effective GSI program by testing a variety of projects and evaluating
them for a number of factors, including:
• Ability to meet performance requirements
• Ease of implementation for on-street and off-street settings
• Cost-effectiveness of various physical conditions
• Efficiency of various systems
• Effectiveness of various materials
• Ease of maintenance
Feedback Loop!
Program Performance/Pilot Results Summary
• The performance monitoring of GSI (results of infiltration rate, storage use, and
drain down duration analyses together) makes a strong case that GSI systems are
performing better than predicted using current engineering design assumptions
• The systems overflow less often than predicted
• The systems experience higher infiltration rates and
faster drain down times than predicted
• The systems have more excess storage capacity
available than predicted over a range of events
Triple Bottom Line – How it begins to pay for itself
Environmental Benefits
• Fish in streams
• Swimmable streams
• Habitat quality
• Air quality
• Energy savings
• Carbon footprint
Social Benefits
• Safe and accessible
streams
• Recreation
• Aesthetics
• Public health
• Social equity
• Crime Reduction
Economic Benefits
• Property values
• Job creation
• City competitiveness
http://www.phillywatersheds.org/ltcpu/Vol02_TBL.pdf
Not your traditional Return on Investment…
• Public Health and Safety
– significant reductions in narcotics possession and narcotics manufacture
• Crime
– 10% increase in urban tree canopy was associated with a roughly 12% decrease in
crime
• Mental Health
– Areas that have the most trees along the streets also had fewer prescriptions
for antidepressants
– …people reported less mental distress and higher life satisfaction when
they were living in greener areas
– Life satisfaction increased by 2% and psychological distress
decreased by 4%
– As green space increased within a 2.5-mile radius of where they lived, overall well-
being increased proportionally
Not your traditional Return on Investment…
• Academics
– richer and poorer areas saw similar increases in scores with increasing vegetation
– …that surrounding greenness has approximately equal effects on student academic
performance regardless of financial status or gender
– …consistent and systematically positive relationships between nature
exposure and student performance
– Views with greater quantities of trees and shrubs from cafeteria as well as classroom
windows are positively associated with:
• standardized test scores, graduation rates, and percentages of students
planning to attend a four-year college
• restoration from mental fatigue and stress reduction
Where we are going next…
• Innovation
– Cost reduction and efficiencies particularly within Design, Construction,
Maintenance and Monitoring elements
– Standardizing best practices
– Expanding programs and incentives for private green infrastructure
activities – Alternative Project Delivery Methods
– National GSI Practitioners Information Exchange
• Continue to generate more Green Jobs
• Monitoring performance at scale
• Grow community partnerships to engage in planning and to
address local needs
• Integrate CSO controls with flooding and climate change
Green City, Clean Waters
www.phila.gov/water
www.phillywatersheds.org
www.pwdplanreview.org
www.phila.gov/water/swmap/
@PhillyH2O
www.facebook.com/PhillyH2O

NJ Future Redevelopment Forum 2017 Cammarata

  • 1.
    Green City, CleanWaters The City of Philadelphia’s Combined Sewer Overflow Long Term Control Plan Update
  • 2.
  • 3.
    Metric Units Cumulative amount asof Year 25 (2036) NE / SW / SE WPCP upgrade: Design & Construction Percent complete 100% Miles of interceptor lined Miles 14.5 Overflow Reduction Volume Million Gallons per year 7,960 Equivalent Mass Capture TSS / BOD / Fecal Coliform Percent 85% Total Greened Acres Greened Acres 9,564 Consent Order and Agreement Requirements
  • 4.
    Green Infrastructure Bureau ofLaboratory Science planters Columbus Square planters George W. Nebinger School rain garden Kemble Park rain garden Greened Acre = IC * Wd Impervious Cover Runoff Depth
  • 5.
    Opportunities & Barriers YearGreened Acres Square Miles % Impervious cover managed 5 750 1 3% 10 2,100 3 8% 15 3,800 6 14% 20 6,400 10 23% 25 9,600 15 34% 25-Year Implementation of Green City, Clean Waters Green Stormwater Infrastructure Requirements Assumes GSI storage equivalent to 1.0 inch of runoff
  • 6.
    Southeast Philadelphia (10th& Moyamensing), photo by Andrew Dobshinsky
  • 9.
  • 10.
  • 11.
  • 12.
  • 13.
  • 14.
  • 15.
    Opportunities & Barriers PublicInvestments: Streets, Parks & Schools
  • 16.
  • 17.
  • 18.
    Photo : JennaStamm , courtesy of The Trust for Public Land Public Investments: Streets, Parks & Schools
  • 19.
  • 20.
    Private Investment: DevelopmentRegulations New Development & Redevelopment with earth disturbance exceeding 15,000 square feet: • Water Quality; Channel Protection; Flood Control • Meets the definition of a greened acre and manages the first inch of runoff • Opportunity to leverage private development Sites: Philadelphia Zoo, Shoemaker Green (Penn Campus), Paseo Verde (APM), Pashall Village (affordable housing), Radian (40th and Walnut) Photo Credits: WRT and Paul Rider
  • 21.
    Local Business: PWD Stormwater pioneer Development: Granary Green Roof Private Investment: Development Regulations
  • 22.
    Public/Private Investments: IncentivizedRetrofits • Up to 80% credit for the management of 1” of stormwater • 1 acre parcel pays $500/mo, $5600/yr for stormwater / Managing 1” over property lowers bill to $100/mo, $1100/yr Rain Garden Porous Pavement Sub-surface Detention PondGreen Roof Surface Detention Pond Stormwater Wetland
  • 23.
  • 24.
    Public/Private Investments: IncentivizedRetrofits Dependable Distribution Wharton Street Lofts
  • 25.
    You can doit anywhere!
  • 28.
    GSI on Streets,Schools, Parks, and other Public Property PWD has completed or is in the process of designing: • 485 Stormwater Tree Trenches • 73 Stormwater Planters • 49 Stormwater Bump-outs • 96 Rain Gardens • 12 Stormwater Basins • 141 Infiltration/Storage Trenches • 31 Porous Paving Projects • 28 Swales • 2 Stormwater Wetlands • 33 Downspout Planters • 15 Other Projects 137 sites, 179.7 acres
  • 29.
    GSI on (Re)DevelopmentProjects and Incentivized Retrofits 266 projects, 423.4 acres 38 sites, 234.6 acres (Re) Development Projects Incentivized Retrofits
  • 30.
    GSI on Streets, Schools,Parks, and other Public Property + GSI on Private Development and Redevelopment Projects + GSI Through Incentivized Retrofits 137 sites, 179.7 acres 266 projects, 423.4 acres 38 sites, 234.6 acres
  • 32.
    SUCCESS! Metric Units Base Line Value First5-Year WQBEL Target Cumulative as of Year 5 (2016) Miles of Interceptor Lined Miles 0 2 7.5 Overflow Reduction Volume Million Gallons Per Year 0 600 1,710 Equivalent Mass Capture (TSS) Percent 62% Report value 70.5% Equivalent Mass Capture (BOD) Percent 62% Report value 88.9% Equivalent Mass Capture (Fecal Coliform) Percent 62% Report value 72.0% Total Greened Acres Greened Acres 0 744 837.7 We have not only achieved out year 5 targets, we have exceeded them!
  • 33.
    5 Year GSICosts – Design, Construction, Construction Mgmt (as of June 2016) (Re)Development Regulations Greened Acres: $10M • Spend approximately $2M/year in Operating costs to manage all aspects of the Stormwater Regulations program (Plan Review Staff, Inspections and Enforcement, Website and Data Management ) Public Retrofit Greened Acres: approx. $40M / $225k per GA • $30.2M for Compensated Construction • $5.5M for Professional Service Costs (Design and Construction Mgmt) • $4M PWD Labor Costs (Design and Construction Mgmt) Incentivized Retrofit Greened Acres: $16.5+M • $10.5 SMIP-related Design, Construction and Construction Mgmt • $5M GARP-related Design, Construction and Construction Management • $1+M to date for PWD Labor (Design Reviews and Construction Inspections) ** Don’t forget about Maintenance Costs! $75M+
  • 34.
    Years 6-10 LookAhead – Double our output! Metric Units WQBEL Target Miles of interceptor lined miles 6 Overflow Reduction Volume million gallons per year 2,044 Equivalent Mass Capture (TSS) percent Report value Equivalent Mass Capture (BOD) percent Report value Equivalent Mass Capture (Fecal Coliform) percent Report value Total Greened Acres Greened Acres 2,148 Additional 1300 GA
  • 35.
    • GSI PlanningGuidelines • GSI Design Process Workflow Packet • GSI Design Requirements & Guidelines • GSI Drawing Requirements Packet – GSI CAD Standards • GSI Standard Details • GSI Project Implementation Workflows • Landscape Guidebook www.phillywatersheds.org/gsi_design_resources Planning and Design | Key Resources
  • 36.
  • 37.
  • 38.
  • 39.
  • 40.
    Planning | LargeArea Disconnection Analysis for Large Area Disconnection (LAD) is performed when there are open space areas that appear to provide the opportunity to manage runoff from areas beyond those immediately adjacent to the site.
  • 41.
    Topic Current DesignRequirement/Guideline Target depth of runoff managed 1.5”, maximum of 2” Design drainage areas Directly connected impervious areas (DCIA) Sizing methodology Static storage Infiltration Rate > 0.25”/hr Drain Down Time 72 hours Slow-Release Rate 0.05 cfs/acre DCIA Minimum Orifice Size 0.5” Underdrains Always included, (safe guard for future clogging) Loading Ratio Target 10:1, higher rates permitted on case by case basis Building Setback 10 feet Inlet Capacity Rational method, using 1 yr storm intensity Inlet Selection PWD Standard Inlets preferred Landscaping Species selection from a recommended plant list Reporting Design Report (as per GreenIT specifications) Monitoring Minimum one observation well per system (not applicable to rain gardens/planters without stone) Drawing Requirements OOW GSI CAD Standards Review Requirements Based on PWD & City Standards Submission Requirements Based on PWD Standards Design: Requirements and/or Constraints
  • 42.
    Construction • Soil Compaction •Erosion and Sediment Controls • Prime/Sub Supervision and Communication • Warranties • Material availability and integrity • Landscaping • Grading • Small tolerances • Punchlist items
  • 43.
    Inspection: •Visual/photographic •Record condition ofvegetative and structural features •Measure sediment and water levels Maintenance: •Trash and sediment removal •Weeding, pruning, etc. •New product testing •Structural repairs •Erosion control •Reseeding / Watering Reporting: •Labor effort and materials required to maintain each site Creating Standards and Protocols: •Required tools and Crew Size •Frequency of visits •Responsible party Maintenance
  • 44.
    Opportunities & Barriers Diversity:Resources and Workforce Professional Services Contracts City Workforce Adoption Programs Requirements ContractsSpecial Service Districts PowerCorpsPHL Equipment, Materials, Supplies Contracts Business Improvement Districts
  • 45.
  • 46.
    The Importance ofMonitoring “Information from pilot projects will be collected to develop a cost effective GSI program by testing a variety of projects and evaluating them for a number of factors, including: • Ability to meet performance requirements • Ease of implementation for on-street and off-street settings • Cost-effectiveness of various physical conditions • Efficiency of various systems • Effectiveness of various materials • Ease of maintenance Feedback Loop!
  • 47.
    Program Performance/Pilot ResultsSummary • The performance monitoring of GSI (results of infiltration rate, storage use, and drain down duration analyses together) makes a strong case that GSI systems are performing better than predicted using current engineering design assumptions • The systems overflow less often than predicted • The systems experience higher infiltration rates and faster drain down times than predicted • The systems have more excess storage capacity available than predicted over a range of events
  • 48.
    Triple Bottom Line– How it begins to pay for itself Environmental Benefits • Fish in streams • Swimmable streams • Habitat quality • Air quality • Energy savings • Carbon footprint Social Benefits • Safe and accessible streams • Recreation • Aesthetics • Public health • Social equity • Crime Reduction Economic Benefits • Property values • Job creation • City competitiveness http://www.phillywatersheds.org/ltcpu/Vol02_TBL.pdf
  • 49.
    Not your traditionalReturn on Investment… • Public Health and Safety – significant reductions in narcotics possession and narcotics manufacture • Crime – 10% increase in urban tree canopy was associated with a roughly 12% decrease in crime • Mental Health – Areas that have the most trees along the streets also had fewer prescriptions for antidepressants – …people reported less mental distress and higher life satisfaction when they were living in greener areas – Life satisfaction increased by 2% and psychological distress decreased by 4% – As green space increased within a 2.5-mile radius of where they lived, overall well- being increased proportionally
  • 50.
    Not your traditionalReturn on Investment… • Academics – richer and poorer areas saw similar increases in scores with increasing vegetation – …that surrounding greenness has approximately equal effects on student academic performance regardless of financial status or gender – …consistent and systematically positive relationships between nature exposure and student performance – Views with greater quantities of trees and shrubs from cafeteria as well as classroom windows are positively associated with: • standardized test scores, graduation rates, and percentages of students planning to attend a four-year college • restoration from mental fatigue and stress reduction
  • 51.
    Where we aregoing next… • Innovation – Cost reduction and efficiencies particularly within Design, Construction, Maintenance and Monitoring elements – Standardizing best practices – Expanding programs and incentives for private green infrastructure activities – Alternative Project Delivery Methods – National GSI Practitioners Information Exchange • Continue to generate more Green Jobs • Monitoring performance at scale • Grow community partnerships to engage in planning and to address local needs • Integrate CSO controls with flooding and climate change
  • 52.
    Green City, CleanWaters www.phila.gov/water www.phillywatersheds.org www.pwdplanreview.org www.phila.gov/water/swmap/ @PhillyH2O www.facebook.com/PhillyH2O