Download as PDF, PPTX

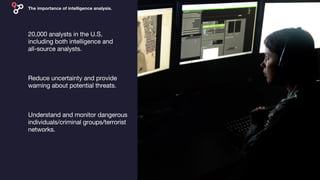


The document references a publication by the Central Intelligence Agency regarding issues faced by the U.S. intelligence community. It suggests that there is available content from Thinkstock related to this topic. Specific details or insights from the publication are not provided.