Download as PDF, PPTX
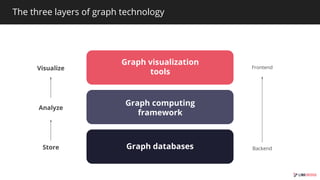
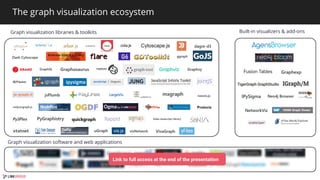
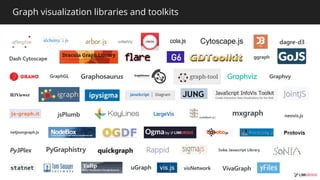
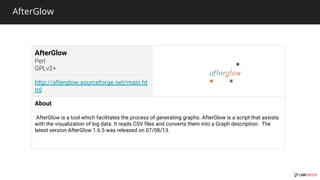


The document provides an overview of various graph visualization tools and libraries available in 2019, outlining their functionalities and links to resources. It includes tools like Afterglow, D3.js, Cytoscape.js, and many others, detailing their capabilities for generating, visualizing, and analyzing graphs. Each entry typically includes a brief description and a URL for further information.


![[PGConf.ASIA 2018]Deep Dive on Amazon Aurora with PostgreSQL Compatibility](https://cdn.slidesharecdn.com/ss_thumbnails/20181212pgconfasiaaurorapostgresql-181212055637-thumbnail.jpg?width=640&height=640&fit=bounds)